ˇ¤Clinical Researchˇ¤ˇ¤Current
Issueˇ¤ ˇ¤Achieveˇ¤ ˇ¤Search
Articlesˇ¤ ˇ¤Online Submissionˇ¤ ˇ¤About IJOˇ¤
A comparable study of clinical and optical outcomes
after 1.8, 2.0 mm microcoaxial and 3.0 mm coaxial cataract surgery
Yi-Bo Yu1,2, Ya-Nan Zhu1,
Wei Wang1, Yi-Dong Zhang1, Yin-Hui Yu1, Ke Yao1,2
1Eye Center, the Second
Affiliated Hospital of Zhejiang University School of Medicine, Hangzhou 310009, Zhejiang
Province, China
2Zhejiang Provincial Key Lab of Ophthalmology, Hangzhou 310009, Zhejiang Province, China
Correspondence
to: Ke Yao. Eye Center, the Second
Affiliated Hospital of Zhejiang University School of Medicine; Zhejiang Provincial Key Lab of Ophthalmology, Hangzhou
310009, Zhejiang Province, China. xlren@zju.edu.cn
Received: 2015-01-31
Accepted: 2015-07-06
Abstract
AIM: To evaluate the clinical and optical outcomes after clear
corneal incision cataract surgery (CICS) with three different incision sizes
(1.8, 2.0 and 3.0 mm).
METHODS: Eyes of 150 patients with age-related cataract scheduled
for coaxial cataract surgery were randomized to three groups: 1.8, 2.0, or 3.0
mm CICS. Intraoperative data and postoperative outcomes including surgically
induced astigmatism (SIA), the corneal incision thickness, wavefront
aberrations and modulation transfer function (MTF) of cornea were obtained.
RESULTS: There were no significant differences among the three
groups in demographic characteristics and intraoperative outcome. The 1.8 and
2.0 mm microincisions showed more satisfactory clinical outcomes than the 3.0
mm incision. The 1.8 mm incision showed significantly less SIA than the 2.0 mm
incision until postoperative 1mo (P<0.05),
but the difference was only 0.14-0.18 D. Combined with less increased incision
thickness only at postoperative 1d (P=0.013),
the 1.8 mm incision presented better uncorrected distance visual acuity (UCDVA) than the 2.0 mm incision only at 1d
postoperatively (P=0.008). For
higher-order aberrations and other Zernike coefficients, there were no
significant differences between the 1.8 mm group and 2.0 mm group (P>0.05).
CONCLUSION: Converting from 3.0 mm CICS to 1.8 or 2.0 mm CICS result
in better clinical and optical outcomes. However, when incision is 1.8 mm, the
benefits from further reduction in size compared with 2.0 mm are limited. The
necessity to reduce the incision size is to be deliberated.
KEYWORDS: microsurgery;
phacoemulsification;treatment outcome
DOI:10.18240/ijo.2016.03.13
Citation: Yu YB, Zhu YN, Wang W, Zhang YD, Yu YH, Yao K. A
comparable study of clinical and optical outcomes after 1.8, 2.0 mm
microcoaxial and 3.0 mm coaxial cataract surgery. Int J Ophthalmol 2016;9(3):399-405
INTRODUCTION
Microincision cataract surgery (MICS) has become
popular in recent years. Compared with standard incision cataract surgery
(SICS), MICS causes less surgical injury, which results in
less surgically induced astigmatism (SIA), better postoperative corneal optical
quality, rapid wound healing and fewer intraoperative complications[1].
However, recent studies showed almost the opposite, reporting that an
additional reduction in incision sizes (e.g.
1.8 mm) did not further improve SIA
or result in better uncorrected distance visual acuity (UCDVA) or better wound
integrity than a 2.2 mm or, even,
a 3.0 mm incision[2-3]. The
surgeonsˇŻ familiarity with the phacoemulsification systems may has affected
their conclusions. And the incision enlargement may indicate an inappropriate
method for intraocular lens (IOL) implantation.
Therefore, to perform a more objective assessment, the
present study investigated clinical and optical outcomes after
clear corneal incision cataract surgery (CICS) with three different incision
sizes using the same phacoemulsification system and
evaluated the relation between the incision size and surgically induced
incision oedema, SIA and corneal optical quality. Two MICS groups were tested
in this study to investigate whether a smaller incision is better and to evaluate the necessity and
benefits of developing new systems and supplies for smaller incisions.
SUBJECTS
AND METHODS
This
was a
prospective, randomized, double-masked clinical trial
(Registration
Number-ChiCTR-TRC-12002565). It was approved by the Institutional
Review Board of the Second Affiliated Hospital of
Zhejiang University School of Medicine, Hangzhou, China,
and performed
in accordance with the tenets of the Declaration of Helsinki stated in 2002[4].
Informed
consent was obtained from all the patients before enrollment.
This study comprised age-related
cataract patients in the Eye Center, the
Second
Affiliated Hospital of Zhejiang University School of Medicine, Hangzhou, Zhejiang
Province, China.
Inclusion criteria were ages between 50 and 80y, with no medication history or
other eye disease. Patients with diabetes or other diseases which
may influence
the biomechanical properties of the cornea were also excluded.
Patients
were randomly assigned to one of three groups the day before surgery. Group I
was to undergo 1.8 mm clear corneal incision surgery with an Akreos MI 60 IOL
(Bausch &Lomb, USA) implantation. Group II
was to
undergo 2.0 mm clear corneal incision surgery with a NY-60 IOL (Hoya,
Japan)
implantation. Group III
was to
undergo conventional coaxial phacoemulsification through a clear corneal
incision of 3.0 mm with a PY-60 IOL implantation (Hoya,
Japan).
Only one
eye
of
each
patient
was
involved
in
the
trial. All
patients were followed up at 1d, 1wk, 1 and 2mo after surgery.
All surgeries were performed by the
same experienced surgeon (Yao K) using the Bausch&Lomb Stellaris system
(Bausch
&Lomb, USA). First, to minimize the
differences in incision among the three groups and facilitate the
postoperative examination of incision, a one-step stab incision of 1.8, 2.0, or
3.0 mm width was made at the 12 oˇŻclock meridian with a stainless steel
keratome. Another 0.6 mm side incision was created in the clear cornea, 90
degrees from the main incision. Continuous curvilinear capsulorhexis measuring
approximately 5.5 mm in diameter was done with a microforceps. After
hydrodissection, phacoemulsification of the nucleus was performed using the
stop-and-chop technique. After aspiration of residual cortex, an Akreos MI
60 IOL was
implanted with wound-assisted technique for Group
I, and a
foldable IOL (Hoya NY-60 IOL for Group
II, Hoya PY-60 IOL for Group
III) was
implanted with an injector through the main incision. The
methods for IOL implantation were strictly consistent with product manuals. Then the wound widths were measured
using the F-gauge by the same surgeon (Yao K).
All
surgeries were uneventful. Intraoperative outcome measures, including average
ultrasound power (AVE), effective phacoemulsification time (EPT), and
ultrasound time (UST), were recorded at the end of the surgeries.
The postoperative follow-up was performed by the same independent
examiner (Yu YB),
who did not perform any of the surgeries. Uncorrected and best
spectacle-corrected decimal visual acuity was recorded at all examination
visits postoperatively. The keratometric cylinder was measured using a Corneal
Topography System (Orbscan IIZTM, Bausch & Lomb, Germany) at
each visit. The data on keratometric cylinder and axes of each cornea were used
for calculation of the surgically induced astigmatism by the vector analysis
described by Jaffe and Clayman[5]. The corneal
endothelial cell density (cells per square millimeter) was measured using a
specular microscope (EM-3000, Tomey, Japan); 100 cells per cornea were counted
at the preoperative and 2mo postoperative examinations. Corneal incision
thickness at the 12 oˇŻclock meridian was measured with anterior segment optical
coherence tomography (Visante OCT, Zeiss Meditec, USA) at all visits.
Wavefront
aberrations and modulation transfer function (MTF) were measured using the
OPD-Scan (ARK-10000, NIDEK Co. Ltd., Japan). In this study, corneal
wavefront aberrations up to the sixth order through a 5 mm optical zone of the
cornea and the spatial frequencies at 0.5 MTF of
the cornea were analyzed at each visit.
Statistical
Analysis
Statistical analysis was performed
using SPSS for Windows software (version 13.0, SPSS, Inc.). Data were expressed
as meanˇŔstandard deviation. The amount of SIA, age, AVE, EPT, UST, nucleus
sclerosis, visual acuity, endothelial cell count and increase in corneal incision
thickness, other variables in corneal aberrations, and 0.5 MTF values among the three groups were compared using ANOVA test. The
Chi-square test was used to compare sex. Any differences showing a P value less than 0.05 were considered
statistically significant.
RESULTS
One hundred
and fifty patients (150 eyes) were
enrolled in the study
and divided into three groups (n=50
in each). The
distribution of sex, age, preoperative UCDVA and mean nucleus sclerosis was comparable among the three groups. No significant
differences were observed in
the intraoperative outcome among the three groups. At postoperative 2mo, the mean endothelial cells among the groups were similar. The mean proportional enlargement in the wound size in Group II was greater than that in Group I and Group III (8.5% vs
1.11% and 1.33%, respectively) (Table 1).
Table 1 Patient characteristics and surgical
data
![]()
|
Parameters |
Group I |
Group II |
Group III |
P |
|
Eyes/patients (n) |
50/50 |
50/50 |
50/50 |
- |
|
Male/female (n) |
11/39 |
13/37 |
13/37 |
0.866 |
|
Mean age (a) |
70.30ˇŔ6.67 |
70.68ˇŔ6.98 |
70.34ˇŔ7.23 |
0.937 |
|
Pre-op UCDVA |
0.88ˇŔ0.44 |
0.73ˇŔ0.39 |
0.81ˇŔ0.44 |
0.623 |
|
Mean nuclear sclerosis |
1.84ˇŔ0.78 |
1.77ˇŔ0.72 |
1.85ˇŔ0.81 |
0.779 |
|
Corneal endothelial cell
density (cells/mm2) |
|
|
|
|
|
Pre-op. |
2638.8ˇŔ291.2 |
2700.0ˇŔ295.7 |
2656.2ˇŔ286.4 |
0.501 |
|
Post-op.
2mo |
2465.5ˇŔ269.7a |
2463.4ˇŔ241.7a |
2423.7ˇŔ175.3a |
0.732 |
|
EPT (s) |
6.35ˇŔ4.84 |
6.18ˇŔ4.37 |
5.50ˇŔ4.49 |
0.573 |
|
AVE (%) |
13.16ˇŔ3.81 |
13.32ˇŔ4.11 |
14.02ˇŔ4.31 |
0.508 |
|
UST (s) |
38.68ˇŔ16.29 |
38.76ˇŔ12.61 |
36.51ˇŔ18.52 |
0.702 |
|
Implanted IOL |
Bausch&Lomb MI60 |
Hoya NY-60 |
Hoya PY-60 |
- |
|
Incision width before IOL implantation (mm) |
1.8 |
2.0 |
3.0 |
- |
|
Final main incision width (mm) |
1.82ˇŔ0.04 |
2.17ˇŔ0.05 |
3.04ˇŔ0.05 |
- |
|
Change (%) |
1.11 |
8.50 |
1.33 |
- |
UCDVA:
Uncorrected distance visual acuity; EPT: Effective phacoemulsification time;
AVE: Average ultrasound power; UST: Ultrasound time. aP<0.05 vs preoperative value in the same group.
The SIA
decreased in each group with an increase in the time since the surgery. The mean
SIA tended to be greater in Group
III than in Groups I and II in all follow-up visits. At postoperative 1d, 1wk and 1mo, the
SIA was significantly lower
in Group I than in Group II (P=0.006, 0.011, 0.021), although
the difference was only 0.14-0.18 D (Figure 1A). At
postoperative 1d, 1wk, and 1mo, there was significant difference in SIA among
the 3 groups (P=0.001, 0.002, 0.013).
At 2mo after surgery, the SIA in Group III was significantly greater than that
in Group I and Group II (P=0.011, 0.021), but
there was no significant difference between Group I and Group II (P=0.251).
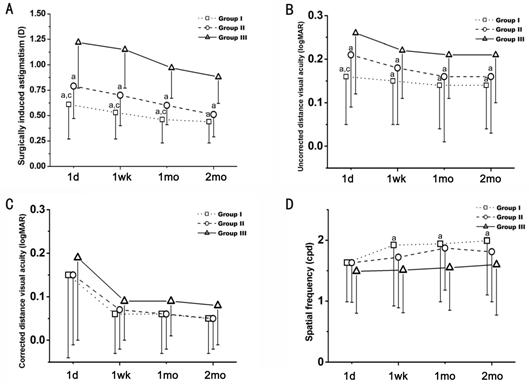
Figure 1 The clinical and optical outcomes in each
group A: Comparison of SIA in the three groups at 1d, 1wk, 1
and 2mo after surgery; B, C: Comparison of UCDVA and CDVA among the three
groups at 1d, 1wk, 1, and 2mo after surgery. D: Spatial frequency (cpd) of 0.5
MTF in the three groups at preoperative and postoperative 1d, 1wk, 1, and 2mo.
Group I: 1.8 mm incision; Group II: 2.0 mm incision; Group III: 3.0 mm
incision. aP<0.05 vs Group III; cP<0.05 vs Group II.
There was
also a statistically significant difference in the mean UCDVA of Group I (approximately 20/30) and Group II (approximately 20/32) on postoperative day 1 (P=0.037). The UCDVA was better in both Group I
and Group II
than in Group III at all follow-up times (postoperative day 1: P=0.001 for Group I vs Group III, P=0.012
for Group II vs Group III; postoperative week 1: P=0.003 for Group I vs Group III, P=0.018
for Group II vs Group III; postoperative month 1: P=0.008 for Group I vs Group III, P=0.021
for Group II vs Group III; postoperative month 2: P=0.009 for Group I vs Group III, P=0.030
for Group II vs Group III) (Figure 1B). At
postoperative 1d, mean UCDVA in Group I was significantly higher than that in
Group II (P=0.033). There was no significant
difference in mean UCDVA between Group I and Group II at postoperative 1wk, 1
and 2mo (P=0.078, 0.121, 0.283).
There was no
statistically significant difference in the mean corrected distance visual
acuity (CDVA) among the three groups at any postoperative visit (Figure 1C). One week, 1 and 2 mo
postoperatively, the mean 0.5 MTF in Group I was significantly higher than
those in Group III (P=0.002, 0.005, 0.023) (Figure 1D). There were no
significant differences among the three groups in 0.5 MTF before surgery (P=0.658).
The pachymetric values of the corneal
incision thickness are
shown in Table 2. The corneal thickness in the incision was
significantly less increased in Group I than in Group III on 1d and 1wk postoperatively (P=0.017, 0.009). There was also a significant
difference in increased corneal thickness between Groups I and II (P=0.036) but only on 1d postoperatively.
Figure 2 shows the
evolution in clear corneal incision thickness after the surgery.
Table 2 Increased corneal incision thickness in the
three groups
¦Ěm;
![]()
|
Follow-up time |
Group I |
Group II |
Group III |
|
Post-op 1d |
304.9ˇŔ67.6a, c |
337.7ˇŔ59.5a |
382.4ˇŔ73.7 |
|
Post-op 1wk |
234.7ˇŔ64.7a |
260.5ˇŔ64.4 |
303.5ˇŔ51.9 |
|
Post-op 1mo |
96.6ˇŔ34.7 |
98.5ˇŔ36.8 |
110.9ˇŔ41.8 |
|
Post-op 2mo |
51.5ˇŔ28.2 |
57.6ˇŔ30.1 |
63.5ˇŔ31.5 |
aP<0.05
vs Group III; cP<0.05 vs Group II.
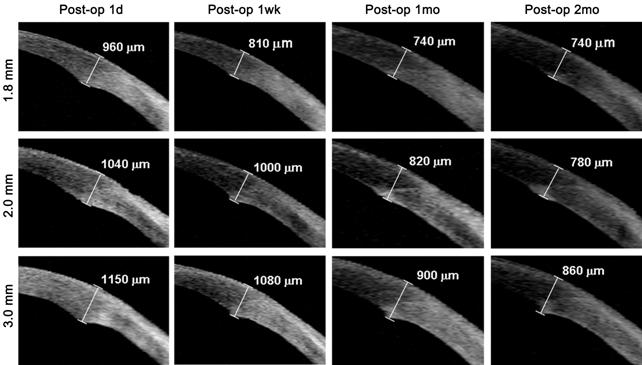
Figure 2 Anterior segment OCT images
of clear corneal incision thickness observed at all visits after surgery Images of 1.8, 2.0 and 3.0 mm showing the evolution
of corneal incision thickness at postoperative 1d, 1wk, 1 and 2mo.
As shown in
Table 3, in Group III, the mean values for higher-order aberrations (HOAs) and total trefoils were significantly different between the preoperative
and 1wk postoperative periods
(P=0.029 for HOAs, P=0.037 for total frefoils) but not
between the preoperative and 1 or 2mo postoperative periods. In Group I and Group II, these
values were increased
only in postoperative week 1, but the
difference was not
significant.
Table 3 Preoperative and postoperative root mean
square (RMS) values of the corneal wave aberrations for the three groups
![]()
|
Parameters |
Pre-op |
Post-op 1wk |
Post-op 1mo |
Post-op 2mo |
|
HOAs |
|
|
|
|
|
Group I |
1.40ˇŔ0.36 |
1.53ˇŔ0.33a |
1.45ˇŔ0.33 |
1.44ˇŔ0.23 |
|
Group II |
1.45ˇŔ0.39 |
1.60ˇŔ0.45 |
1.50ˇŔ0.30 |
1.46ˇŔ0.25 |
|
Group III |
1.37ˇŔ0.37 |
1.72ˇŔ0.40c |
1.57ˇŔ0.38 |
1.54ˇŔ0.26 |
|
Total
spherical aberration |
|
|
|
|
|
Group I |
0.18ˇŔ0.18 |
0.18ˇŔ0.18 |
0.18ˇŔ0.17 |
0.17ˇŔ0.15 |
|
Group II |
0.18ˇŔ0.15 |
0.19ˇŔ0.17 |
0.18ˇŔ0.14 |
0.16ˇŔ0.10 |
|
Group III |
0.19ˇŔ0.13 |
0.21ˇŔ0.19 |
0.21ˇŔ0.16 |
0.18ˇŔ0.13 |
|
Total
coma |
|
|
|
|
|
Group I |
0.36ˇŔ0.26 |
0.37ˇŔ0.29 |
0.36ˇŔ0.24 |
0.35ˇŔ0.22 |
|
Group II |
0.37ˇŔ0.26 |
0.38ˇŔ0.29 |
0.37ˇŔ0.33 |
0.34ˇŔ0.25 |
|
Group III |
0.37ˇŔ0.31 |
0.39ˇŔ0.38 |
0.36ˇŔ0.29 |
0.33ˇŔ0.27 |
|
Total
trefoils |
|
|
|
|
|
Group I |
0.76ˇŔ0.56 |
0.82ˇŔ0.55a |
0.78ˇŔ0.50 |
0.82ˇŔ0.52 |
|
Group II |
0.77ˇŔ0.67 |
0.92ˇŔ0.67 |
0.82ˇŔ0.42 |
0.85ˇŔ0.80 |
|
Group III |
0.77ˇŔ0.50 |
1.08ˇŔ0.84c |
0.92ˇŔ0.58 |
0.88ˇŔ0.55 |
|
Total
tetrafoils |
|
|
|
|
|
Group I |
0.36ˇŔ0.32 |
0.40ˇŔ0.43 |
0.36ˇŔ0.30 |
0.36ˇŔ0.22 |
|
Group II |
0.42ˇŔ0.31 |
0.43ˇŔ0.39 |
0.38ˇŔ0.25 |
0.40ˇŔ0.25 |
|
Group III |
0.39ˇŔ0.28 |
0.53ˇŔ0.49 |
0.42ˇŔ0.30 |
0.39ˇŔ0.32 |
aP<0.05
vs Group III; cP<0.05 vs preoperative value in the same group.
DISCUSSION
This study
compared the clinical and
optical outcomes of phacoemulsification in three incision
sizes: 1.8, 2.0 and 3.0 mm. The aim was to determine whether the smaller
incisions sizes (1.8 and 2.0 mm) conferred more advantages than the larger
incision size (3.0 mm) and
whether the 1.8 mm incision had obvious advantages over the 2.0 mm incision. To limit bias, the patients were
assigned to three groups with similar preoperative characteristics. There were no intraoperative
complications, cases of wound burn or Descemet membrane damage in our study. In agreement with the finding of
other studies[6] of MICS and SICS, we did not find any statistically
significant differences in the phacoemulsification time, ultrasound energy, and corneal endothelial cell loss among
the three groups. These findings indicate that the three different incision
sizes, which were made with the Venturi pump system, are equally efficient and safe, suggesting that
converting from SICS to MICS will not lengthen the duration of the surgery or reduce the efficiency of the surgery in nuclear
sclerosis cases under Grade
III.
It is generally
recognized that
wound healing is faster and that the recovery time is shorter when a smaller
incision size is used[7]. Raise
the question of whether an incision size with a mean of 1.8 mm would result in
better wound healing than a 3.0 mm incision or, even, a 2.0 mm incision. Luo et al[2] showed that
this was not the case, reporting a
significantly greater mean maximal incision thickness and greater enlargement of incision size with 1.8 mm
incisions than 2.2 and 3.0 mm incisions postoperatively. Vasavada et al[3] also showed a greater
incision enlargement in a 1.8 mm group compared to a 2.2 mm group. However, in
these studies, the surgeons used different phacoemulsification systems between
groups, and each of the surgeons made a big incision enlargement in 1.8 mm
group. Our clinical observations yielded different results from their studies. We found that the mean
increase in the corneal incision thickness in Group I was significantly less
than that in Group III on
both day 1 and week 1 postoperatively and that the thickness was even less than
that in Group II on postoperative day 1. Moreover, similar to that reported by
Can et al[8] and Ali¨® et al[9], the size of the
incision in Group I after IOL implantation was 1.82ˇŔ0.04 mm. The change in the
size of the incision was only 1.11% in Group I, significantly less than that in
Luo et alˇŻs[2] study (11.41%) and Vasavada et alˇŻs[3]
study (13.89%). The increase in the thickness and
size of the corneal incision is attributed to many intraoperative manipulations,
such as phacoemulsification, cortical aspiration, IOL implantation and the
water tightness of the incision.
In our study, phacoemulsification and I/A did not result in any incision
enlargement, whereas Luo et al[2] and Vasavada et al[3] reported a significant enlargement in the incision
before IOL implantation (5.69% vs
9.44%). As a result of the different phacoemulsification systems they used, we
thought their familiarity with the respective phacoemulsification systems may have
affected their results. We also noticed that the size of the incision increased
substantially during the IOL implantation (5.39% in Luo et alˇŻs[2]
study vs 4.06% in Vasavada et alˇŻs[3] study). We thought that the enlargement in the size
of the incision may have been caused by an inappropriate IOL implantation
method. We used the wound-assisted technique to implant MI60 IOL, and this
resulted in only a 1.11% enlargement in the incision. The insertion of an IOL
injector into the incision would have increased the size of the incision. Based
on our results, we propose that a smaller incision results in less damage and
less likelihood of oedema. The use of a smaller sized incision by an
experienced surgeon will not result in an increase in incision size.
The size of
the incision is the main factor governing the amount of SIA after
phacoemulsification. However, SIA is a complex problem, which is influenced by
various other factors, such as the location, shape and healing of the incision[10-11]. In Luo et alˇŻs[2] and Vasavada et alˇŻs[3] studies, the between-group difference in SIA and
UCDVA was not statistically significant. However, the magnitude of
SIA in the 1.8 mm group was greater than that in the 2.2 and 3.0 mm groups on
postoperative day 1 (Luo et alˇŻs[2] study) and greater than
that in the 2.2 mm group 3mo postoperatively (Vasavada et alˇŻs[3]
study). Moreover, the UCDVA in the 1.8 mm group was worse than that in the 2.2
mm group on postoperative day 1[3].
While, in our study, SIA was significantly reduced in Group I at all follow-up periods compared to that in Group II and Group III. In Group I, UCDVA was best on
postoperative day 1, which is in agreement with that of other
studies[12-13]. Interestingly, although there was a
significant difference in SIA between Group I and Group II until postoperative 1mo, the
difference was only 0.14-0.18 D,
which had little effect on the UCDVA. These results suggested that SIA was obviously reduced by
moving from a 3.0 mm incision to a 2.0 mm incision, but moving from a 2.0 mm
incision to an even smaller 1.8 mm incision offered limited benefit in reducing
SIA and improving visual acuity.
Many studies
have reported that cataract surgery with IOL implantation induces and increases
HOAs, which are not effectively corrected with spectacles, limiting the
performance of the eye.
Although aspherical IOL are applied to reduce the
aberrations of the whole eyeball, corneal incisions can alter the corneaˇŻs
optical power, generating SIA and postoperative changes in aberration[14]. In this study, we found a
significant increase in HOAs and total trefoils of the cornea between the
preoperative and 1wk postoperative periods in Group III. The HOAs and total
trefoils of the cornea were significantly greater in Group III compared to those in Group I only 1wk
postoperatively, which is in agreement with other studies[15]. After analysis of the effects of
surgically induced changes in corneal aberrations on the image quality using MTF,
the 0.5 MTF value was higher in Group I than in Group III at every postoperative visit, which
confirmed our previous data[16]. However,
with the 1.8 and 2.0 mm incisions, there were consistently no differences in
the HOAs or in the 0.5 MTF value. Our data indicate that successful MICS gives
better visual quality compared with SICS and leads to better patient
satisfaction, especially in the early postoperative period. However, there
appear to be little difference in the aforementioned parameters with 2.0 mm or
even smaller (1.8 mm) incisions.
In
conclusion, our results indicate that switching from conventional SICS to MICS
will result in less SIA, faster visual rehabilitation, better incision
integrity and better vision quality, without any reduction in efficiency and
safety. In addition, the microcoaxial phacoemulsification technique does not
require an additional learning curve when converting from a standard coaxial
technique in the same phacoemulsification system and offers comparable outcomes with 1.8 and 2.0 mm incisions.
Comparing the 1.8 and 2.0 mm incisions, the corneal optical quality is almost
the same, and the 1.8 mm incision results in less SIA, less increase in the
thickness of the corneal
incision and better UCDVA than the 2.0 mm incision in the
early postoperative period. However, the difference between the two groups is
small and has little effect on the clinical outcomes. Thus, when the incision is
reduced to 1.8 mm, compared with 2.0 mm, the benefits of the smaller incision
on clinical outcomes seem negligible. The development of a phacoemulsification
system for the smallest incision needs to be deliberated.
ACKNOWLEDGEMENTS
Foundations: Supported by the Key Program of
the National Natural Science Foundation of China (No. 81130018); National
Twelfth Five-Year Plan Foundation of China (No. 2012BAI08B01); Zhejiang Key
Innovation Team Project of China (No. 2009R50039); Zhejiang Key Laboratory Fund
of China (No. 2011E10006).
Conflicts
of Interest:
Yu YB, None; Zhu YN, None; Wang W,
None; Zhang YD, None; Yu YH, None; Yao K, None.
REFERENCES
1
Wilczynski M, Supady E, Loba P, Synder A, Omulecki W. Results of coaxial
phacoemulsification through a 1.8 mm microincision in hard cataracts.
<ii>Ophthalmic Surg Lasers Imaging</ii> 2011;42(2):125-131. [PubMed]
2 Luo L, Lin H, He M, Congdon N, Yang Y, Liu Y.
Clinical evaluation of three incision size-dependent phacoemulsification
systems.<ii> Am J Ophthalmol</ii> 2012;153(5): 831-839. [CrossRef] [PubMed]
3 Vasavada V, Vasavada AR, Vasavada VA,
Srivastava S, Gajjar DU, Mehta S. Incision integrity and postoperative outcomes
after microcoaxial phacoemulsification performed using 2 incision-dependent
systems.<ii> J Cataract Refract Surg</ii> 2013;39(4):563-571. [CrossRef] [PubMed]
4 World Medical Association Declaration of
Helsinki: Ethical principles for medical research involving human subjects.
Edinburgh, Scotland, 52nd general assembly, October 2000; Available at:
http://www.wma.net/e/policy/b3.htm. Accessed December 8, 2008.
5 Jaffe NS, Clayman HM. The pathophysiology of
corneal astigmatism after cataract extraction. <ii>Trans Am Acad
Ophthalmol Otolaryngol</ii> 1975;79:615-630.
6 Kim EC, Byun YS, Kim MS. Microincision versus
small-incision coaxial cataract surgery using different power modes for hard
nuclear cataract. <ii>J Cataract Refract Surg</ii>
2011;37(10):1799-1805. [CrossRef] [PubMed]
7 Podboraczy¨˝ska-Jodko K, Lubi¨˝ski W. Bimanual
microincision cataract surgery with implantation of an Akreos MI6O lens--one
year follow-up.<ii> Klin Oczna</ii> 2012;114(4):245-248. [PubMed]
8 Can I, Takmaz T, Bayhan HA, Bostanci Ceran B.
Aspheric microincision intraocular lens implantation with biaxial microincision
cataract surgery: efficacy and reliability.<ii> J Cataract Refract
Surg</ii> 2010;36(11):1905-1911. [CrossRef] [PubMed]
9 Ali¨® JL, Piñero DP, Ortiz D, Montalb¨˘n R.
Clinical outcomes and postoperative intraocular optical quality with a
microincision aberration-free aspheric intraocular lens. <ii>J Cataract
Refract Surg</ii> 2009;35(9):1548-1554. [CrossRef] [PubMed]
10 Jauhari N, Chopra D, Chaurasia RK, Agarwal A.
Comparison of surgically induced astigmatism in various incisions in manual
small incision cataract surgery. <ii>Int J Ophthalmol</ii>
2014;7(6):1001-1004. [PMC free article] [PubMed]
11 Du X, Zhao G, Wang Q, Yang X, Gao A, Lin J,
Wang Q, Xu Q. Preliminary study of the association between corneal
histocytological changes and surgically induced astigmatism after phacoemulsification.
<ii>BMC Ophthalmol </ii> 2014;14:134. [CrossRef] [PubMed] [PMC free article]
12 Klamann MK, Gonnermann J, Maier AK, Torun N,
Bertelmann E. Smaller incision size leads to higher predictability in
microcoaxial cataract surgery. <ii>Eur J Ophthalmol</ii>
2013;23(2):202-207. [CrossRef] [PubMed]
13 Dick HB. Controlled clinical trial comparing
biaxial microincision with coaxial small incision for cataract surgery.
<ii>Eur J Ophthalmol</ii> 2012;22(5):739-750. [CrossRef]
14 Oliveira CM, Ferreira A, Franco S. Wavefront
analysis and Zernike polynomial decomposition for evaluation of corneal optical
quality. <ii>J Cataract Refract Surg</ii> 2012;38(2):343-356. [CrossRef] [PubMed]
15 Tong N, He JC, Lu F, Wang Q, Qu J, Zhao YE.
Changes in corneal wavefront aberrations in microincision and small-incision
cataract surgery. <ii>J Cataract Refract Surg</ii> <ii>
</ii>2008;34(12):2085-2090. [CrossRef] [PubMed]
16 Yao K, Tang X, Ye P. Corneal astigmatism, high
order aberrations, and optical quality after cataract surgery: microincision
versus small incision.<ii> J Refract Surg</ii> 2006;22(9
Suppl):S1079-1082. [PubMed]
[Top]