・Clinical Research・ ・Current Issue・ ・Achieve・ ・Search Articles・ ・Online Submission・ ・About IJO・ PMC
Comparison
of corneal biomechanical properties in normal tension glaucoma patients with
different visual field progression speed
Ying
Hong1, Nobuyuki Shoji2,3, Tetsuya Morita4,
Kazunori Hirasawa2, Kazuhiro Matsumura4, Masayuki
Kasahara3, Kimiya Shimizu4
1Department
of Ophthalmology, Peking University Third Hospital, Key Laboratory of Vision
Loss and Restoration, Ministry of Education, Beijing 100191, China
2Department
of Rehabilitation, Orthoptics and Visual Science Course, Kitasato University
School of Allied Health Sciences, Sagamihara City 252-0373, Japan
3Department
of Ophthalmology, Kitasato University Hospital, Sagamihara City 252-0373, Japan
4Kitasato
University, Sagamihara City 252-0373, Japan
Correspondence to: Nobuyuki Shoji. Department
of Rehabilitation, Orthoptics and Visual Science Course, Kitasato University
School of Allied Health Sciences, 1-15-1, Kitasato, North District, Sagamihara
City 252-0373, Japan. ns_assist1@kjb.biglobe.ne.jp
Received: 2015-04-08
Accepted: 2015-11-21
Abstract
AIM: To compare the
corneal biomechanical properties difference by ocular response analyzer (ORA)
in normal tension glaucoma (NTG) patients with different visual field
(VF) progression speed.
METHODS: NTG patients
with well-controlled Goldmann applanation tonometer (GAT) who routinely
consulted Kitasato University Hospital Glaucoma Department between January 2010
and February 2014 were enrolled. GAT and ORA parameters including corneal
compensated intraocular pressure (IOPcc), Goldmann
estimated intraocular pressure (IOPg), corneal
hysteresis (CH), corneal resistance factor (CRF) were recorded. VF was tested
by Swedish interactive threshold algorithm (SITA)-standard 30-2 fields. All
patients underwent VF measurement regularly and GAT did not exceed 15 mm Hg at
any time during the 3y follow up. Patients
were divided into four groups according to VF change over 3y, and ORA findings were compared between
the upper 25th percentile group (slow progression group) and the lower 25th
percentile group (rapid progression
group).
RESULTS: Eighty-two
eyes of 56 patients were studied. There were
21 eyes (21 patients) each in rapid and slow progression groups respectively. GAT, IOPcc, IOPg, CH,
CRF were 12.1±1.4 mm Hg,
15.8±1.8 mm Hg, 12.8±2.0 mm Hg,
8.4±1.1 mm Hg, 7.9±1.3 mm Hg respectively in rapid progression group and 11.5±1.3
mm Hg,
13.5±2.1 mm Hg,
11.2±1.6 mm Hg,
9.3±1.1 mm Hg, 8.2±0.9
mm Hg respectively in slow progression group (P=0.214, <0.001, 0.007, 0.017, 0.413,
respectively).
In bivariate correlation analysis, IOPcc, IOPcc-GAT and CH were significant
correlated with m△MD (r=-0.292, -0.312, 0.228 respectively, P=0.008, 0.004, 0.039 respectively).
CONCLUSION: Relatively
rapid VF progression occurred in NTG patients whose IOPcc are rather high, CH
are rather low and the difference between IOPcc and GAT are relatively large.
Higher IOPcc and lower CH are associated with VF progression in NTG patients. This study suggests that GAT measures might underestimate
the IOP in such patients.
KEYWORDS: ocular response
analyzer; intraocular pressure; corneal biochemical properties; visual field;
normal tension glaucoma
DOI:10.18240/ijo.2016.07.06
Citation: Hong Y, Shoji N,
Morita T, Hirasawa K, Matsumura K, Kasahara M, Shimizu K. Comparison of corneal
biomechanical properties in normal tension glaucoma patients with different
visual field progression speed. Int J Ophthalmol 2016;9(7):973-978
INTRODUCTION
The prevalence of primary open angle glaucoma (POAG) in
Japan is 3.9% with 92% of POAG patients whose intraocular pressure (IOP) did
not exceed 21 mm Hg, which is defined as normal-tension glaucoma (NTG)[1]. In some patients with
well-controlled IOP, the visual field (VF) remains stable or progresses very slowly,
while in others the condition is quite different: IOP is well controlled but VF
progresses rapidly[2].
There have been a number of studies focusing on the pressure-independent
pathway of glaucoma[3-7], but the accuracy of IOP measurement may play an
important role in such cases.
Goldmann
applanation tonometer (GAT) is currently the gold standard for IOP measurement,
but these values (GAT-IOP) may be affected by central corneal thickness (CCT),
corneal curvature, corneal astigmatism and other corneal biomechanical
properties[8-11].
Therefore, it is very important to find a new method to determine the true IOP.
Ocular
response analyzer (ORA) (Reichert©; Reichert
Technologies, Buffalo, NY, USA) is a new device that is described as a non-contact
tonometer. ORA can measure corneal hysteresis (CH), corneal resistance factor
(CRF) and determine a specific corneal compensated intraocular pressure (IOPcc) which is less influenced by
corneal viscoelasticity. There have been studies discussing the relationship
between ORA measurements and structural or functional changes in glaucoma
patients, but most of them have focused on patients with POAG or suspected
glaucoma[2,12-15].
There
are limited data on ORA measurements in NTG patients. Moreover, the
relationship between corneal viscoelasticity, corneal thickness and VF
progression in NTG patients remains unclear. In the current study, we obtained
ORA parameters including IOPcc, Goldmann estimated intraocular pressure (IOPg), GAT, CH and CRF in NTG patients
with well-controlled GAT-IOP. We compare ORA data in patients with different VF
progression speed to see relatively rapid VF progression might occur in what
kind of NTG patients.
SUBJECTS AND METHODS
This
retrospective study was approved by the Kitasato University Hospital Review
Board and followed the tenets of the Declaration of Helsinki. Informed consent
was obtained from all patients included in this study. Patients routinely
consulted Kitasato University Hospital glaucoma department between January 2010
and February 2014 and were usually seen at intervals of 3-6mo.
The
inclusion criteria were as follows: NTG was defined by the presence of
glaucomatous optic neuropathy[16]
associated with reproducible VF abnormalities. GAT-IOP did not exceed 15 mm Hg
including diurnal variation during the recent 3y, because NTG patients whose
IOP exceed 16 mm Hg in the daytime are likely to have an IOP that exceeds 21 mm
Hg at night[17].
The
ocular examination included visual acuity, corneal parameters such as corneal
curvature and corneal refractive power, GAT, ORA parameters including IOPcc,
IOPg, CH, CRF and CCT. VF was examined by SITA-Standard 30-2 fields (Carl Zeiss
Meditec, Inc., Dublin, CA, USA). The parameters of VF using for the current
study were the mean deviation (MD) and the pattern standard deviation (PSD).
The minimum criterion for a VF abnormality was a glaucoma hemifield test
outside normal limits or a PSD result <5% on 2 consecutive reliable examinations. All
enrolled patients underwent at least 5 VF tests to analyze VF progression
statistically. We analyzed VF change by global trend analysis by MD slope. The
MD slope, MD change per year (dB/y) was obtained from linear regression
analysis of the HFA II glaucoma progression analysis software. MD change was
calculated by MD slope multiply 3 because the follow-up period was 3y. And the
PSD change was the difference between the VF results at last follow-up and the
baseline ones.
All eyes
had best corrected visual acuity ≥20/30.
Refractive error of the patients was between -8.0 diopters and 8.0 diopters
spherical equivalent and corneal astigmatism between -3.0 diopters and 3.0
diopters.
We
excluded patients with an insufficient number of VF results because we could
not analyze whether VF had progressed in such cases. Patients with other
diseases that may affect the VF test and/or ORA test were also excluded.
Patients who had undergone any type of intraocular surgery within the past 3mo
before the participation in this study were also excluded[13]. Patients underwent VF test first and then IOP
measurements were obtained in a random sequence in order to minimize the
potential for a statistical effect of applanation on lowering IOP.
Corneal
biomechanical properties were measured with ORA once at the patient's study visit. All patients
were tested by one experienced doctor. The device obtains 2 measurements of the
corneal response to the air pulse. The major outcomes are CH, CRF and IOPcc (mm
Hg). The difference between the 2 pressures is CH (mm Hg). CRF is thought to be
one of the indices of corneal elasticity based on CH, IOPg is the average of P1 and P2.
IOPcc is a pressure measurement based on CH, which is thought little to be
affected by corneal biomechanical properties. ORA can also provide CCT results[9,11,18]. A good
quality reading was defined as one with symmetrical height of force-in and
force-out waveform peaks and a waveform score >7 on a software-generated
scale of 0 to 10[18-19].
Statistical Analysis Data were analyzed by statistical
software (SPSS version 20.0 SPSS Inc., Chicago, IL, USA). Categorical data were
compared by χ2 tests.
Continuous variables were tested for normal distribution. Variables with normal
distribution are presented as mean±SD and were compared by independent
Student’s t-test. Variables with
skewed distribution are presented as median with interquartile range (IR) and
were compared by Mann-Whitney U test.
Bivariate correlation analysis was constructed to determine variables
associated with VF damage. A two-tailed P<0.05
was considered significant.
RESULTS
There
were 142 NTG patients with good follow-up during the study period, but only 82
eyes of 56 patients met the inclusion criterion of GAT-IOP (GATmax) not
exceeding 15 mm Hg during the 3y. Therefore, 82 eyes of 56 patients were
enrolled in this study. These 26 males and 30 females had an average age of
62.6y (range
from 37-84y). One eye of 30 patients and both eyes of 26 patients were
included. All patients were Asian. The included eyes underwent a median of 7.1
(range from 5-12) VF tests during follow-up. There were 16 eyes (19.5%) without
any kind of antiglaucoma eye drops, 43 eyes (52.4%) receiving one kind of eye
drops, 17 eyes (20.7%) receiving 2 kinds of eye drops and 6 eyes (7.3%)
receiving 3 kinds of eye drops. Details are showed in Table 1.
Table 1 Antiglaucoma eye drops of the
patients
|
Treatment |
Number
(eyes) |
Percentage
(%) |
|
None |
16 |
19.5 |
|
PG |
31 |
37.8 |
|
β-Blocker |
11 |
13.4 |
|
CAI |
1 |
1.2 |
|
PG+β-Blocker |
11 |
13.4 |
|
PG+CAI |
6 |
7.3 |
|
PG+β-Blocker+CAI |
6 |
7.3 |
PG:
Prostaglandin; CAI: Carbonic anhydrase inhibitor.
Patient
general information, their ORA parameters and VF change over the 3y are listed
in Table 2. In brief, the GAT on the day ORA obtained was 12.0 mm Hg, as the same
as the median GAT (GATavg, 12
mm Hg) over the 3y. Both of such measurements were approximately 3 mm Hg lower
than IOPcc (15.0 mm Hg). The average CH was 8.9 mm Hg and CRF was 8.1 mm Hg,
which were both below normal limits[18,20].
The median MD change (m△MD) was -0.8 dB
over the 3y, indicating approximately 0.3 dB VF loss per year.
Table 2 General and clinical
characteristics of the patients
|
Characteristics |
|
Range |
|
Age |
62.6±11.8 |
37-84 |
|
Gender (M/F) |
26/30 |
|
|
Eyedrops |
1.2±0.8 |
0-3 |
|
Corneal curvature |
7.73±0.23 |
7.27-8.49 |
|
Corneal refractive power |
43.7±1.3 |
39.75-46.50 |
|
GAT (mm Hg) |
12.0±1.5 |
9-15 |
|
GATmax |
14 (14, 15) |
10-15 |
|
GATavg |
12 (12, 13) |
9-14 |
|
IOPcc (mm Hg) |
15.0±2.5 |
9.3-20.1 |
|
IOPg (mm Hg) |
12.3±2.2 |
7.4-17.7 |
|
IOPcc-IOPg (mm Hg) |
2.6±1.4 |
-0.9-5.6 |
|
IOPcc-GAT (mm Hg) |
2.9±2.2 |
-2.0-9.1 |
|
CRF (mm Hg) |
8.1±1.2 |
5.6-11.5 |
|
CH (mm Hg) |
8.9±1.3 |
6.1-11.7 |
|
CCT (μm) |
520.0±26.8 |
474-580 |
|
MD (dB) |
-5.2 (-9.6, -2.5) |
-27.86-1.91 |
|
PSD (dB) |
9.3±4.4 |
1.66-18.34 |
|
Baseline MD (dB) |
-4.9 (-7.8, -1.3) |
-28.15-1.48 |
|
Baseline PSD (dB) |
8.5 (3.7, 12.5) |
1.72-18.31 |
|
△MD (dB) |
-0.8 (-1.8, -0.1) |
-5.58-1.58 |
|
△PSD (dB) |
0.9 (-0.2, 1.8) |
-2.75-6.67 |
GAT:
Goldmann applanation tonometer; IOP: Intraocular pressure; IOPcc: Corneal
compensated intraocular pressure; IOPg: Goldmann estimated intraocular
pressure; CRF: Corneal resistance factor; CH: Corneal hysteresis; CCT: Central
corneal thickness; MD: Mean deviation; PSD: Pattern standard deviation. Data
are skewed distribution and presented as median (IR).
Patients were divided into four groups according to the m△MD over 3y (Figure 1). The median, P25 and P75 value of the
m△MD in the four groups are -2.1 (-3.2, -1.9) dB; -1.1 (-1.3, -0.9) dB; -0.5 (-0.6, -0.3) dB and 0.4 (0.1, 0.8) dB respectively. The data-box plots of CH,
CRF, IOPcc and IOPg for 4 groups were shown in Figure 2. And findings were compared
between the upper 25th percentile group (slow progression group, 21 eyes in total) and the lower 25th
percentile group (rapid progression group,
21 eyes in total). Patient age, gender and the numbers of antiglaucoma
eyedrops did not significantly differ between the two groups (P=0.484, 1.000, 0.396 respectively).
There were no statistically significant differences of the parameters that may
affect ORA results such as corneal curvature or corneal refractive power
between the two groups (P=0.106,
0.101, respectively). And there were no significant differences in GAT, GATmax
or GATavg between two groups (P=0.142,
0.890, 0.966, respectively).
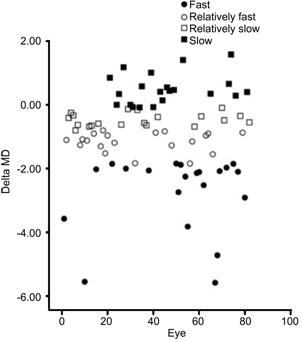
Figure 1 Delta MD of all patients over 3y.
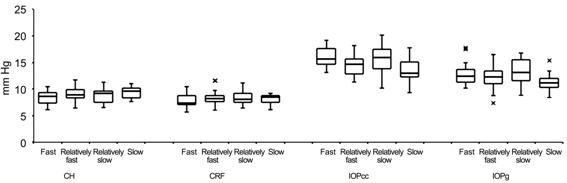
Figure 2 The data-box plots
of CH, CRF, IOPcc and IOPg for 4 groups.
ORA results
showed that the average IOPcc in the rapid progression group was 15.8 mm Hg, significantly higher than that in the
slow group (13.5 mm Hg) (P<0.001). The average IOPg in the
rapid group was 12.8 mm Hg, significantly higher than that in the slow group (11.2 mm Hg) (P=0.006). The difference between IOPcc
and IOPg was 3.0 mm Hg in the rapid group, significantly
higher than 2.3 mm Hg in the slow group (P=0.035). The difference between IOPcc
and GAT was 3.8 mm Hg in the rapid group, significantly
higher than 1.9 mm Hg in the slow group (P=0.004).
The
average CH in the rapid group was 8.4 mm Hg, significantly lower than 9.3 mm Hg in the slow group (P=0.009). The average CRF in the rapid
group was 7.9 mm Hg, which was lower than 8.2 mm Hg in the slow group, but the difference
did not reach significance (P=0.310).
There was no significant difference in CCT between the two groups (P=0.849).
At
baseline, MD did not significantly differ between the rapid and slow group (P=0.134) but PSD significantly differ
between the two groups (P=0.037).
After 3y, there was a significant difference. MD and PSD were -8.8 dB and 10.4
dB in the rapid group, but -2.1 dB and 6.4 dB in the slow group (P=0.001, 0.002, respectively).
Therefore, the VF change was also significantly different between the two
groups, m△MD and m△PSD were -2.1 dB
and 1.9 dB in the rapid group, but 0.4 dB and -1 dB in the slow group (P<0.001, 0.036 respectively) (Table
3).
Table 3 The comparison of the worst and
best 25th percentile group
|
Characteristics |
Rapid (n=21) |
Slow (n=21) |
P |
|
Age |
60.9±12.2 |
62.2±12.9 |
0.484 |
|
Gender (M/F) |
10/11 |
11/10 |
1.000 |
|
Eyedrops |
1.4±0.9 |
1.2±0.9 |
0.396 |
|
Corneal curvature |
7.73±0.23 |
7.65±0.16 |
0.106 |
|
Corneal refractive power |
43.67±1.29 |
44.13±0.91 |
0.101 |
|
GAT (mm Hg) |
12.1±1.4 |
11.5±1.3 |
0.142 |
|
GATmax |
14 (14, 14.5) |
14 (13.5, 14) |
0.890 |
|
GATavg |
12 (12, 12) |
12 (11.5, 12.5) |
0.966 |
|
IOPcc (mm Hg) |
15.8±1.8 |
13.5±2.1 |
<0.001 |
|
IOPg (mm Hg) |
12.8±2.0 |
11.2±1.6 |
0.006 |
|
IOPcc-IOPg (mm Hg) |
3.0±1.3 |
2.3±1.1 |
0.035 |
|
IOPcc-GAT (mm Hg) |
3.8±2.1 |
1.9±1.8 |
0.004 |
|
CRF (mm Hg) |
7.9±1.3 |
8.2±0.9 |
0.310 |
|
CH (mm Hg) |
8.4±1.1 |
9.3±1.1 |
0.009 |
|
CCT (μm) |
516.1±28.2 |
515.3±25.0 |
0.849 |
|
MD (dB) |
-8.8 (-11.4, -3.4) |
-2.1 (-5.5, 0.1) |
0.001 |
|
PSD (dB) |
10.4±4.6 |
6.4±3.7 |
0.002 |
|
Baseline MD (dB) |
-5.4 (-9.3, -1.1) |
-2.9 (-5.7, -0.6) |
0.134 |
|
Baseline PSD (dB) |
8.9±5.2 |
6.1±3.8 |
0.037 |
|
△MD (dB) |
-2.1 (-3.2, -1.9) |
0.4 (0.1, 0.8) |
<0.001 |
|
△PSD (dB) |
1.9 (0.3, 2.6) |
-1 (-0.7, 1.4) |
0.036 |
Data
are skewed distribution and presented as median (IR).
In
bivariate correlation analysis, the Pearson correlation coefficient of CH, CRF etc. were listed in Table 4. Briefly,
IOPcc, IOPcc-GAT and CH were significant correlated with m△MD (r=-0.292, -0.312, 0.228 respectively and
P=0.008, 0.004 and 0.039
respectively).
Table 4 The Pearson correlation
coefficient of bivariate correlation analysis
|
Characteristics |
r |
P |
|
Age |
-0.044 |
0.693 |
|
Corneal curvature |
-0.058 |
0.606 |
|
Corneal refractive power |
0.056 |
0.619 |
|
GAT (mm Hg) |
-0.020 |
0.860 |
|
GATmax |
0.006 |
0.960 |
|
GATavg |
0.109 |
0.330 |
|
IOPcc (mm Hg) |
-0.292 |
0.008 |
|
IOPg (mm Hg) |
-0.206 |
0.063 |
|
IOPcc-IOPg (mm Hg) |
-0.191 |
0.085 |
|
IOPcc-GAT (mm Hg) |
-0.312 |
0.004 |
|
CRF (mm Hg) |
0.106 |
0.344 |
|
CH (mm Hg) |
0.228 |
0.039 |
|
CCT (μm) |
-0.042 |
0.709 |
DISCUSSION
The current
study investigated whether there was difference of corneal biomechanical
properties in NTG patients with different VF progression speed. The results
demonstrated that in NTG patients whose GAT-IOP did not exceed the mid-teens
during the recent 3y, relatively rapid VF progression occurred in patients with
rather high IOPcc, rather low CH and relatively large difference between IOPcc
and GAT. IOPcc and CH were significantly correlated with VF progression. These
findings indicated that IOPcc and CH might be associated with VF progression in
NTG patients.
Recently,
there have been some studies focusing on corneal biomechanical properties, the
accuracy of IOP measurement and VF progression. The study by Congdon et al[13] in 2006 included 230
subjects (POAG, suspected POAG and ocular hypertension) and showed that neither
CCT nor CH was related to VF progression. However, other studies suggested that
there was relationship between corneal biomechanical properties and VF
progression[2,12,14-15]. Anand et
al[12] compared CH and VF asymmetry in open
angle glaucoma. Their findings demonstrated that CH, CRF and IOPcc were risk
factors for worse VF. Mansouri et al[14] compared corneal biomechanical properties and VF between glaucoma
patients and suspected glaucoma patients and found worse CH, CRF and CCT values
in the glaucoma group. De Moraes et al[2] categorized different types of glaucoma patients based on whether
VF progressed and concluded that CH and CCT are associated with VF progression.
Most recently, a prospective longitudinal study by Medeiros et al[15] claimed that baseline CH and baseline GAT were
associated with the risk of glaucoma progression. A summary of recent research
is presented in Table 5. Our study differed from the previous
studies are all of the patients included in the current study were Asian and
NTG patients. A group comprised of a single race might demonstrate fewer
anatomic differences than a group comprised of different races[21].
Table 5 Summary of
recent similar researches
|
Authors |
Eye/Patient |
Diagnosis |
MD (dB) |
PSD (dB) |
GAT (mm Hg) |
CH (mm Hg) |
CRF |
IOPcc (mm Hg) |
Associated with
worse VF |
|
Congdon et al[13] |
N/A/230 |
POAG; POAG
suspect; OH |
N/A |
N/A |
N/A |
N/A |
N/A |
N/A |
Neither nor CH |
|
Anand et al[12] |
234/117 |
POAG with
asymmetric VF |
Worse eye |
Worse eye |
14 |
Worse eye |
Worse eye |
Worse eye |
CH; CRF; IOPcc |
|
-11.2±6.4 |
9.6±3.2 |
8.2±1.9 |
8.6±2.0 |
17.4 |
|||||
|
Better eye |
Better eye |
Better eye |
Better eye |
Better eye |
|||||
|
-2.1±2.5 |
3.2±2.3 |
8.9±1.9 |
8.8±2.1 |
16.9 |
|||||
|
Mansouri et al[14] |
299/191 |
Glaucoma;
glaucoma suspect |
Glaucoma |
Glaucoma |
Glaucoma |
Glaucoma |
Glaucoma |
Glaucoma |
CH; CRF |
|
-3.3±3.3 |
4.0±3.0 |
15.0±5.6 |
9.4±1.7 |
9.4±2.0 |
16.6±5.4 |
||||
|
Suspect -0.38±1.6 |
Suspect 1.6±0.9 |
Suspect 16.6±4.5
(IOPg) |
Suspect 10.4±1.7 |
Suspect 10.7±2.1 |
Suspect 6.9±4.1 |
||||
|
De Moraes et al[2] |
153/153 |
POAG; NTG; XFG;
ACG; JOAG; PG |
Progress |
Progress |
Progress |
Progress |
Progress |
Progress |
CH |
|
-5.3±4.1 |
4.7±3.0 |
15.3±3.7 |
7.5±1.4 |
7.6±1.3 |
18.0±5.3 |
||||
|
Non-prog |
Non-prog |
Non-prog |
Non-prog |
Non-prog |
Non-prog |
||||
|
-6.5±6.8 |
5.4±4.3 |
14.7±3.9 |
9.0±1.8 |
8.9±2.0 |
16.5±5.0 |
||||
|
Medeiros et al[15] |
114/68 |
POAG |
Baseline
-2.45±3.22 |
Baseline
3.32±2.84 |
Baseline 16.1±3.8 |
Baseline 9.5±1.7 |
N/A |
N/A |
Baseline; CH;
baseline GAT |
The findings of the current study
concurred with recent articles suggesting that corneal biomechanical properties
were associated with VF change[2,12,14-15]. This
difference between IOPcc and GAT was similar to what was found in other studies[2,12].
The VF loss of approximately 0.3 dB per year which did not reach the
progression standard of 1 dB per year[22],
indicating that the patients included in the current study were relatively well
controlled. These results of the comparison of rapid progression
group and slow progression group indicate that patients showing rapid
progression had rather high IOPcc, rather low CH which along with relatively
large difference between IOPcc and GAT. This finding suggests that the IOP
values obtained of such patients during follow up were underestimated. In such
cases, the optic nerve might be chronically exposed to relatively high IOP
resulting in obvious progression of VF.
There
are lots of experimental and clinical evidence that the biomechanical
properties of the eyeball may be related to those of the optic nerve complex[23-27]. Scleral stiffness
and collagen fiber organization influence IOP-induced deformation of the optic
nerve head in a computer model[27].
Downs et al[24] reported a change in the viscoelastic properties of
peripapillary sclera on exposure to chronic IOP elevations in monkey eyes with
glaucoma. Another study reported that monkey eyes with stiff or thick sclera
seemed to be less prone to biomechanical changes in response to chronic IOP
elevation[26]. Another
experimental study found an association between higher CH and greater optic
nerve deformation when IOP was artificially elevated in glaucoma eyes[25]. We think the
biomechanical properties of the eyeball in NTG patients may also be related to
those of the optic nerve complex. So it may explain why the VF progress rapidly
of NTG patients with rather high IOPcc and rather low CH. But it remains
unclear whether there is a causal relationship between CH and VF progression or
not[2,12-15].
It may be that the corneal biomechanical properties change first, then
compliance of the eyeball to IOP decreases and pressure on the optic nerve head
increases, finally causing retina nerve fiber layer defects (RNFLD) and
glaucomatous VF change. Another possibility is that lower CH presents as a
result of chronic IOP elevation, similar to optic disc cupping and RNFLD. A
third possibility is that these are simultaneous but independent changes.
Further research is needed to clarify the nature of the association.
As
far as was concerned, unlike ocular hypertension treatment study[28], we did not find was
associated with VF progression in our study. This may be because the patients
in their study had hypertension, while our study investigated NTG. And other
studies did not find any relationship between and VF progression too[12-13,15,25,29].
There
are several limitations in current study. First, it is a small sample study. It
is because the inclusion criteria were very strict. Although this choice
reduced the number of patients, it increased the homogeneity and reduced the
influence of other confounding factors. Second, both eyes of some patients were
included in this study, but only one eye of each patient was compared in the
two groups. Third, because of the retrospective nature of the study, the
baseline corneal biomechanical properties of the patients were not available.
The
current study demonstrated that relatively rapid VF progression occurred in NTG
patients with rather high IOPcc, rather low CH and relatively large difference
between IOPcc and GAT. These findings indicated that IOPcc and CH were
associated with VF progression in NTG patients.
Since
treatment to decrease IOP is the only therapy confirmed
by evidence-based medicine for controlling the progression of VF in NTG
patients, the “target” IOP should take corneal biomechanical properties into
consideration. IOPcc is significantly higher than GAT in those who appear to
progress faster. So IOPcc may be a better method of monitoring IOP in NTG
patients and patients with low CH should undergo more thorough investigation
and careful monitoring.
ACKNOWLEDGEMENTS
Conflicts
of Interest: Hong Y, None;
Shoji N, None; Morita T, None; Hirasawa K,
None; Matsumura K, None; Kasahara M, None; Shimizu K, None.
REFERENCES
1 Iwase A, Suzuki Y, Araie M, Yamamoto T, Abe H, Shirato S, Kuwayama
Y, Mishima HK, Shimizu H, Tomita G, Inoue Y, Kitazawa Y, Tajimi Study Group,
Japan Glaucoma Society. The prevalence of primary open-angle glaucoma in
Japanese: the Tajimi Study. Ophthalmology
2004;111(9):1641-1648. [CrossRef]
2 De Moraes CV, Hill V, Tello C, Liebmann JM, Ritch R. Lower
corneal hysteresis is associated with more rapid glaucomatous visual field
progression. J Glaucoma
2012;21(4):209-213. [CrossRef]
[PubMed]
3 Bell K, Gramlich OW, Von Thun Und Hohenstein-Blaul N, Beck S,
Funke S, Wilding C, Pfeiffer N, Grus FH. Does autoimmunity play a part in the
pathogenesis of glaucoma? Prog Retin Eye
Res 2013;36:199-216. [CrossRef] [PubMed]
4 Joachim SC, Reinehr S, Kuehn S, Laspas P, Gramlich OW, Kuehn M,
Tischoff I, VON Pein HD, Dick HB, Grus FH. Immune response against ocular
tissues after immunization with optic nerve antigens in a model of autoimmune
glaucoma. Mol Vis 2013;19:1804-1814.
[PMC free article]
[PubMed]
5 Krizaj D, Ryskamp DA, Tian N, Tezel G, Mitchell CH, Slepak VZ,
Shestopalov VI. From mechanosensitivity to inflammatory responses: new players
in the pathology of glaucoma. Curr Eye
Res 2014;39(2):105-119. [CrossRef] [PubMed] [PMC free article]
6 Shazly TA, Aljajeh M, Latina MA. Autoimmune basis of glaucoma. Semin Ophthalmol 2011;26(4-5):278-281. [CrossRef] [PubMed]
7 Huang W, Fan Q, Wang W, Zhou M, Laties AM, Zhang X. Collagen: a
potential factor involved in the pathogenesis of glaucoma. Med Sci Monit Basic Res 2013;19:237-240. [CrossRef] [PubMed] [PMC free article]
8 Kniestedt C, Lin S, Choe J, Bostrom A, Nee M, Stamper RL.
Clinical comparison of contour and applanation tonometry and their relationship
to pachymetry. Arch Ophthalmol 2005;123(11):1532-1537.
[CrossRef] [PubMed]
9 Medeiros FA, Weinreb RN. Evaluation of the influence of corneal
biomechanical properties on intraocular pressure measurements using the ocular
response analyzer. J Glaucoma 2006;15(5):364-370. [CrossRef] [PubMed]
10 Morita T, Shoji N, Kamiya K, Fujimura F, Shimizu K. Corneal
biomechanical properties in normal-tension glaucoma. Acta Ophthalmol 2012;90(1):e48-e53. [CrossRef] [PubMed]
11 Morita T, Shoji N, Kamiya K, Hagishima M, Fujimura F, Shimizu
K. Intraocular pressure measured by dynamic contour tonometer and ocular
response analyzer in normal tension glaucoma. Graefes Arch Clin Exp Ophthalmol 2010;248(1):73-77. [CrossRef] [PubMed]
12 Anand A, De Moraes CG, Teng CC, Tello C, Liebmann JM, Ritch R.
Corneal hysteresis and visual field asymmetry in open angle glaucoma. Invest Ophthalmol Vis Sci
2010;51(12):6514-6518. [CrossRef]
[PubMed]
13 Congdon NG, Broman AT, Bandeen-Roche K, Grover D, Quigley HA.
Central corneal thickness and corneal hysteresis associated with glaucoma
damage. Am J Ophthalmol 2006;141(5):868-875.
[CrossRef] [PubMed]
14 Mansouri K, Leite MT, Weinreb RN, Tafreshi A, Zangwill LM,
Medeiros FA. Association between corneal biomechanical properties and glaucoma
severity. Am J Ophthalmol 2012;153(3):419-427.
[CrossRef] [PubMed] [PMC free article]
15 Medeiros FA, Meira-Freitas D, Lisboa R, Kuang TM, Zangwill LM,
Weinreb RN. Corneal hysteresis as a risk factor for glaucoma progression: a
prospective longitudinal study.
Ophthalmology 2013;120(8):1533-1540. [CrossRef] [PubMed] [PMC free article]
16 Foster PJ, Buhrmann R, Quigley HA, Johnson GJ. The definition
and classification of glaucoma in prevalence surveys. Br J Ophthalmol 2002:86(2):238-242. [CrossRef] [PubMed] [PMC free article]
17 Aihara M, Yamagami J, Araie M, Yamamoto S. Relationship of the
office intraocular pressure (IOP) to diurnal fluctuation of IOP in low-tension
glaucoma: a multivariate analysis. Nippon
Ganka Gakkai Zasshi 1992:96(8):1007-1013. [PubMed]
18 Luce DA. Determining in vivo biomechanical properties of the
cornea with an ocular response analyzer. J
Cataract Refract Surg 2005;31(1):156-162. [CrossRef] [PubMed]
19 Lam AK, Chen D, Tse J. The usefulness of waveform score from
the ocular response analyzer. Optom Vis
Sci 2010;87(3):195-199. [CrossRef] [PubMed]
20 Laiquzzaman M, Bhojwani R, Cunliffe I, Shah S. Diurnal
variation of ocular hysteresis in normal subjects: relevance in clinical
context. Clin Experiment Ophthalmol 2006;34(2):114-118.
[CrossRef] [PubMed]
21 Leite MT, Alencar LM, Gore C, Weinreb RN, Sample PA, Zangwill
LM, Medeiros FA. Comparison of corneal biomechanical properties between healthy
blacks and whites using the Ocular Response Analyzer. Am J Ophthalmol 2010;150(2):163-168. [CrossRef] [PubMed] [PMC free article]
22 Smith SD, Katz J, Quigley HA. Analysis of progressive change in
automated visual fields in glaucoma.
Invest Ophthalmol Vis Sci 1996;37(7):1419-1428. [CrossRef]
23 Bochmann F, Ang GS, Azuara-Blanco A. Lower corneal hysteresis
in glaucoma patients with acquired pit of the optic nerve (APON). Graefes Arch Clin Exp Ophthalmol
2008;246(5):735-738. [CrossRef]
[PubMed]
24 Downs JC, Suh JK, Thomas KA, Bellezza AJ, Hart RT, Burgoyne CF.
Viscoelastic material properties of the peripapillary sclera in normal and
early-glaucoma monkey eyes. Invest
Ophthalmol Vis Sci 2005;46(2):540-546. [CrossRef] [PubMed]
25 Wells AP, Garway-Heath DF, Poostchi A, Wong T, Chan KC, Sachdev
N. Corneal hysteresis but not corneal thickness correlates with optic nerve
surface compliance in glaucoma patients. Invest
Ophthalmol Vis Sci 2008;49(8):3262-3268. [CrossRef] [PubMed]
26 Girard MJ, Suh JK, Bottlang M, Burgoyne CF, Downs JC.
Biomechanical changes in the sclera of monkey eyes exposed to chronic IOP
elevations. Invest Ophthalmol Vis Sci 2011;52(8):5656-5669. [CrossRef] [PubMed] [PMC free article]
27 Sigal IA, Yang H, Roberts MD, Burgoyne CF, Downs JC.
IOP-induced lamina cribrosa displacement and scleral canal expansion: an
analysis of factor interactions using parameterized eye-specific models. Invest Ophthalmol Vis Sci 2011;52(3):1896-1907.
[CrossRef] [PubMed] [PMC free article]
28 Gordon MO, Beiser JA, Brandt JD, Heuer DK, Higginbotham EJ,
Johnson CA, Keltner JL, Miller JP, Parrish RK 2nd, Wilson MP, Kass MA. The
Ocular Hypertension Treatment Study: baseline factors that predict the onset of
primary open-angle glaucoma. Arch
Ophthalmol 2002;120(6):714-720. [CrossRef]
29 Nemesure B, Wu SY, Hennis A, Leske MC, Barbados Eye Study
Group. Corneal thickness and intraocular pressure in the Barbados eye studies. Arch Ophthalmol 2003;121(2):240-244. [CrossRef]
[Top]