��Meta-Analysis����Current Issue�� ��Achieve�� ��Search
Articles�� ��Online
Submission�� ��About IJO�� PMC
Metabolic syndrome risk factors and dry
eye syndrome: a Meta-analysis
Ye-Lei Tang1, Ya-Lan
Cheng2,Yu-Ping
Ren2, Xiao-Ning Yu2, Xing-Chao Shentu2
1Department
of Neurology, the Second Affiliated Hospital, School of Medicine, Zhejiang University,
Hangzhou 310000, Zhejiang Province, China
2Eye
Center, the Second Affiliated Hospital, School of Medicine,
Zhejiang University, Hangzhou 310000, Zhejiang Province, China
Correspondence
to: Xing-Chao Shentu. Eye Center, the Second Affiliated
Hospital, School of Medicine, Zhejiang University, No.88 Jiefang Road, Hangzhou
310000, Zhejiang Province, China. stxc20030304@aliyun.com
Received:
2016-03-08
Accepted: 2016-05-04
Abstract
AIM: To explore the relationship
between metabolic risk factors and dry eye syndrome (DES).
METHODS: Retrieved studies on the
association of metabolic syndrome risk factors (hypertension, hyperglycemia,
obesity, and hyperlipidemia) and DES were collected from PubMed, Web of
Science, and the Cochrane Library in December 2015. Odds ratio (OR) with 95%
confidence interval (CI) were pooled to evaluate the final relationship.
Subgroup analyses were conducted according to diagnostic criteria of DES.
RESULTS: Nine cross-sectional studies and
three case-control studies were included in this Meta-analysis. The pooled
results showed that people with hypertension, hyperglycemia, and hyperlipidemia
had a higher risk of suffering from DES (P<0.05),
especially the typical DES symptoms. On the other hand, obesity did not increase
the risk of DES.
CONCLUSION: The present
Meta-analysis suggests that all metabolic risk factors
except obesity were risk factors for DES.
KEYWORDS: dry eye syndrome; hypertension; hyperglycemia; obesity; hyperlipidemia; Meta-analysis
DOI:10.18240/ijo.2016.07.17
Citation: Tang YL,
Cheng YL, Ren YP, Yu XN, Shentu XC. Metabolic syndrome
risk factors and dry eye
syndrome: a Meta-analysis. Int J Ophthalmol 2016;9(7):1038-1045
INTRODUCTION
Dry eye syndrome (DES) is
well recognized as a global health problem with a high prevalence ranging from 7.8% to 33.7%[1-3]. DES is also the most common reason among
patients for visiting ophthalmology clinics[1]. The concept
of DES has been consistently understood as an ocular surface disorder
characterized by eye discomfort, visual disturbance, tear film instability,
destruction and inflammation of the ocular surface, and high tear osmolarity[4-5]. In addition to increased
health care costs, physical discomfort, impaired vision-related quality-of-life
issues and visual dysfunction[6],
DES patients also suffer from a higher risk of psychological problems such as anxiety and depression[7]. In order to prevent the disease
from the source, during the past decades, numerous etiological studies have
been conducted to explore the potential risk factors of DES, many of which have
indicated that DES might be related to metabolic syndrome and its risk factors[2-3,8-17].
Metabolic syndrome risk factors
consist of four different disorders: obesity, hypertension, hyperglycemia, and
hyperlipidaemia[18].
The relationship between these four disorders and DES remains unclear and even controversial
among studies published so far[8-17]. Additionally, single
studies may be limited by sample size. We therefore performed this
Meta-analysis to quantitatively explore the relationship between metabolic
syndrome risk factors and DES, both of which are public health issues of common
concern.
MATERIALS AND METHODS
This Meta-analysis was performed in
accordance with the Preferred Reporting Items for Systematic Reviews and
Meta-Analyses (PRISMA) statement checklist[19].
Search Strategy and Study
Selection PubMed, Web of Science, and the
Cochrane Library databases were searched for original articles,
published until December 2015. The search strategy keywords included DES (��dry eye syndrome��, ��DES��,
��xerophthalmia�� and ��keratoconjunctivitissicca��), hypertension (��hypertension��
and ��high blood pressure��), hyperglycemia (��hyperglycemia��, ��hyperglycemia
mellitus��, ��hyperglycemia�� and ��high blood glucose��), obesity [��obesity�� and
��high body mass index (BMI)��], hyperlipidemia (��hyperlipidemia��, ��high
cholesterol�� and ��high blood lipids��) and human studies. Taking the PubMed
database as a sample, the search item for DES and hyperlipidemia was ��hyperlipidemia
(Title/Abstract)�� OR ��high cholesterol (Title/Abstract)�� OR ��high blood lipids
(Title/Abstract)�� AND ��dry eye (Title/Abstract)�� OR ��xerophthalmia
(Title/Abstract)�� OR ��keratoconjunctivitissicca (Title/Abstract)�� AND ��Human
(Mesh)��. The reference lists of selected papers were manually
screened for potentially missing papers.
DES patients were divided into two groups in terms of
diagnostic criteria: patients with typical DES symptoms and patients with
clinically diagnosed DES. The former were usually diagnosed through a questionnaire
or an interview containing typical DES symptoms (such as dryness, foreign body
sensation, burning, fatigue, discomfort, etc); and the later were diagnosed
according to both typical DES symptoms and objective tests (such as tear film
breakup time, Schirmer I test, etc)
The primary selection of studies was based on titles and
abstracts. Then two investigators (Shentu XC and Tang YL) independently
screened the full text of each selected study using the following detailed
inclusion criteria: 1) original research papers reporting independent data on
the relationship between metabolic syndrome risk factors and DES; 2)
case-control or cross-sectional studies. To avoid double publication, only the
most recent or most informative studies were included. The studies involving
two separate sets of data were considered to be two independent studies; and
for the studies involving two separate case groups and the same control group,
the data from the larger sample size was used. No specific language restriction
was imposed on the selection of publications.
Data Extraction and Study Quality
Assessment Two investigators (Tang YL and Cheng YL) independently extracted the data
using a standardized data extraction format including the following data: first
author��s name, publication year, country, study design, sample size,
hypertension status, hyperglycemia status, obesity status, hyperlipidemia
status, adjusted variables, and odds ratio (OR) values with corresponding 95%
confidence intervals (CI). Any disagreement was settled by consensus of the
investigators.
Qualities of all selected studies were evaluated according
to the Newcastle-Ottawa scale (NOS, Figure 1)[20], and studies
scoring five or more points were deemed to be of high quality.

Figure
1 Qualities of all selected studies were evaluated according to the NOS.
Statistical Analysis All statistical analyses were performed using Stata version
12.0 software (StataCorp, College Station, TX, USA). The significance level of the
statistics was set to P<0.05, except
in the case of heterogeneity. The OR values with corresponding 95% CI served as
the valid estimate for all qualified studies to obtain a pooled OR with 95% CI.
Potential heterogeneities among the included studies were evaluated using
Cochran��s Q statistic and an I2
index score, and a P-value less than
0.10 or an I2 score
greater than 50% was considered to be significant[21]. When high
heterogeneity was detected, the random-effects model based on the DerSimonian
and Laird method was used; otherwise, the fixed-effects model based on the
inverse variance method was used[22]. Subgroup analysis was performed
according to diagnostic criteria and adjusted factors. And only if more than
one study contained the same adjusted factors, subgroup analysis would be performed.
The sensitivity analysis was used to assess the robustness of the main
Meta-analysis results by sequentially omitting individual studies.
Meta-regression analysis was used to analyze the source of heterogeneity.
Egger��s linear regression test and Begg��s test were used to evaluate the
potential publication bias[23].
RESULTS
Characteristics of Included
Studies Seventy-six
unique articles were identified through searching three electronic databases
and reference lists of the selected articles. Twenty-two articles were
retrieved for the final review after the primary screen based on titles and
abstracts. Ten articles were excluded for the following reasons: sevenarticles
did not provide proper OR values with 95% CI, two articles provided data that
had been used in other studies, and the full text of one article was not
available. Finally, twelve articles met all the predefined inclusion criteria,
including nine cross-sectional studies and three case-control studies.
The characteristics of the selected studies are summarized in Table
1.
Table 1
Characteristics of 12 case-control/cross-sectional studies included into the
present Meta-analysis
|
Source
(Published year) |
Country |
Study
design |
Sample
size |
Age
(a) |
Diagnostic
criteria |
Adjusted
factors |
NOS
scores |
|
Yang et al
(2015) |
China |
Case-control |
1908 |
20-89 |
Typical
symptoms |
Age,
sex, acnerosacea, etc. |
7 |
|
Vehof et al
(2014) |
British |
Cross-sectional |
3824 |
20-87 |
Both |
Age,
glaucoma, asthma, etc. |
7 |
|
Ahn et al
(2014) |
South Korea |
Cross-sectional |
11666 |
19-95 |
Both |
Age,
gender, education, etc. |
6 |
|
Schaumberg et
al (2009) |
USA |
Cross-sectional |
25444 |
50-80+ |
Typical
symptoms |
Age,
race, region of residence, etc. |
5 |
|
Malet et al (2014) |
France |
Cross-sectional |
963 |
73-80+ |
Typical
symptoms |
Age,
gender,smoking, etc. |
8 |
|
Uchino et al
(2013) |
Japan |
Cross-sectional |
672 |
22-65 |
Clinical
diagnose |
Sex,
age, systemic disease, etc. |
8 |
|
Galor et al
(2012) |
USA |
Case-control |
2454458 |
21-100 |
Clinical
diagnose |
Gender,
age |
7 |
|
Uchino et al
(2011) |
Japan |
Cross-sectional |
3294 |
40-80+ |
Both |
None |
7 |
|
Viso et al
(2009) |
Spain |
Cross-sectional |
654 |
40�C96 |
Both |
Age,
sex, computer use, etc. |
6 |
|
Moss et al
(2000) |
USA |
Cross-sectional |
3722 |
48-91 |
Typical
symptoms |
Age,
sex, smoking status, etc. |
7 |
|
Chia et al (2003) |
Australia |
Cross-sectional |
1174 |
50-90 |
Typical
symptoms |
Age,
sex |
7 |
|
Jie et al
(2008) |
China |
Case-control |
5324 |
40-101 |
Typical
symptoms |
None |
7 |
Hyperglycemia and Dry Eye Syndrome Three case-control studies and six cross-sectional studies
involving 10 separate sets of data reported hyperglycemia data[2-3,9,11-16].
Since significant heterogeneity was
found among the included studies (I2=50.6%,
P=0.033), the random-effects model
was adopted. Based on the forest plot shown in Figure 2, hyperglycemia patients
have a higher risk of suffering from DES (OR: 1.18, 95% CI: 1.04-1.35).

Figure 2 The association of
hyperglycemia with DES.
Results from patients with typical
DES symptoms were consistent with the pooled OR values above, while results
from patients with clinically diagnosed DES were not (Figure 3; clinically
diagnosed DES: OR: 1.28, 95% CI: 0.99-1.66; I2=62.5%,
P=0.035; typical DES symptoms: OR:
1.24, 95% CI: 1.08-1.42; I2=30.0%,
P=0.210).

Figure 3 The association of
hyperglycemia with typical DES symptoms and clinically diagnosed DES.
Hypertension and Dry Eye Syndrome Nine separate sets of data from two case-control studies and
six cross-sectional studies reported hypertension data[2-3,8-13]. The
pooled results indicated that no significant relationship between hypertension
and DES was detectedin the random effects model (Figure 4, OR: 1.18,
95% CI: 0.93-1.50; I2=94.2%, P=0.000).
Subgroup analysis was performed according to diagnostic
criteria. According to Figure 5, patients with hypertension were more likely to
suffer from typical DES symptoms (OR: 1.17, 95% CI: 1.00-1.37; I2=56.7%, P=0.055), while they had no significant
relationship with risk of clinically diagnosed DES (OR: 1.03, 95% CI:
0.66-1.60; I2=93.3%, P=0.000).

Figure 4 The association of hypertension
with DES.

Figure 5 The association of hypertension
with typical DES symptoms and clinically diagnosed DES.
Obesity and Dry Eye Syndrome One case-control study and three cross-sectional studies
reported obesity data[2,8,12,17]. Based on the forest plot
shown in Figure 6, no significant relationship was detected between DES and
obesity in the fixed-effects model (OR: 0.98, 95% CI: 0.94-1.02; I2=12.2%, P=0.336). The results of subgroup
analysis were consistent with the results in Figure 7 (clinically
diagnosed DES: OR: 0.76, 95% CI: 0.55-1.04; I2=0.0%,
P=0.796; typical DES symptoms: OR:
0.98, 95% CI: 0.94-1.02; I2=0.0%,
P=0.440).

Figure 6 The association of obesity with
DES.

Figure
7 The association
of obesity with typical DES symptoms and clinically diagnosed DES.
Hyperlipidemia and Dry Eye Syndrome One case-control study and two cross-sectional studies were
included[3,8,11]. Two of
them reported hypercholesterolaemia data; one reported lipid metabolism
disorder data. In the random effects
model (I²=58.2%; P=0.092), a statistically significant relationship was detected (Figure 8,
OR: 1.46, 95%CI: 1.30-1.65).
The pooled results of subgroup analysis according to
diagnostic criteria were consistent with the main results above (Figure 9,
clinically diagnosed DES: OR: 1.32, 95% CI: 1.04-1.68; I2=80.5%, P=0.006;
typical DES symptoms: OR: 1.34, 95% CI: 1.17-1.54; I2=0.0%, P=0.641),
and so were the results for the hypercholesterolaemia subgroup in the fixed
model (OR: 1.35, 95% CI: 1.17-1.54; I2=0.0%,
P=0.630).
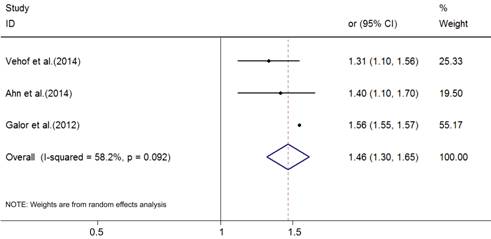
Figure 8 The association of
hyperlipidemia with DES.

Figure
9 The association
of hyperlipidemia with typical DES symptoms and clinically diagnosed DES.
Sensitivity Analysis and Publication
Bias Sensitivity analysis carried out by sequentially omitting
individual studies did not alter the significance of pooled OR estimates,
indicating robust main Meta-analysis results. No significant publication biases
were detected among the included studies, except hypertension (Begg��s test: Z=0.10, P=0.917; Egger��s
test: P=0.001).
Meta-regression Analysis We conducted a Meta-regression analysis to explore the
influences of study design, publication year, study conducted area, sample
size, and dry eye diagnostic criteria on explaining heterogeneity. The study
conducted area was proved to be the main source of hyperglycemia data (P<0.05), and study design was the
main source of hypertension data (P<0.05).
DISCUSSION
The results of the present Meta-analysis consisting three
case-control studies and nine cross-sectional studies indicated that
hyperglycemia, hyperlipidemia and hypertension were significantly associated
with an increased risk of DES, while obesity not. And the significance remained
unchanged after adjustment other risk factors of DES, such as age, gender,
alcohol, autoimmune disease and thyroid disease.
Our results imply that hyperglycemia could significantly
increase the risk of DES, especially in the case of patients with typical DES
symptoms. Diabetes could induce decrease in corneal sensation, followed by a
decrease in tear production, impaired metabolicactivity,
and loss of cytoskeletal structure associatedwith cellular adhesion, which is
the main mechanism of DES[2,8,24].
According to subgroup analysis results, hyperglycemia was
alsoa significant risk factor for patients with typical DES symptoms, and the relationship
between hyperglycemia and clinically diagnosed DES reached near statistically
significant level. Theminor inconsistencies of subgroup analysis might be
caused by the inaccuracy of diagnostic criteria described in the included
studies. Tear films consists of three layered structures: an inner mucus layer,
a middle aqueous layerand an outer lipid layer[25]. Nowadays,
traditional objective tests aimed for diagnose of DES could not comprehensively
evaluate the tear film, especially for patients with reflectively increased
tear secretion and reduced tear film quality[2,26]. Besides, tear osmolarity test should also be
involved in routine examination, as the progressively increased variation in tear
osmolarity can well reflect the severity of DES and increase the
sensitivity of current diagnosis criteria[2-3,26].
Thus, in our opinion, the limitations of clinically diagnostic criteria for DES
may influence the veracity of statistical results.
Our Meta-analysis also indicated that hypertension was a risk
factor for patients with typical DES symptoms. According to Viso et
al[13], hypertension may not be a direct risk factor for
DES, but anti-hypertension drugs were. In terms of people with clinically
diagnosed DES, no significant association was detected. That may be because,
not all hypertensive medications were DES risk factors, such as ACE inhibitors,
which were proven to be a protective factor for DES in a recent study[16]. The controversial effect of
hypertension drugs may mainly contribute to the inconsistency of our results,
and none of the involved studies have grouped subjects according to the type of
antihypertensive
drugs, which made it impossible for us to further confirm the effect of
different types of antihypertensive drugs on DES risk. What��s more, the
inaccuracy of diagnostic criteria mentioned above was another reason of the
inconsistency of subgroup results.
According to our results, no significant relationship was
detected between obesity and risk of DES, both for patients with typical DES
symptoms and clinically diagnosed DES. In this meta-analysis, both
normal-weight subjects and underweight subjects were considered to belong to
the control group. And according to Uchino et al[12], BMI less
than 18.5 kg/m2 was a protective factor for DES; thus, further
studies should be conducted among the underweight group, the normal-weight
group and the obesity group to distinguish the effect of different levels of
BMI on DES risk.
Some researchers have argued that hyperlipidemia would
increase the risk of DSE[3,11], which is consistent with our
results, especially for the hypercholesterolemia group. Compared with the
normal meibomian lipid melting point of 30��-34��, increased cholesterol in the meibomian lipid with
increased melting point of 46�� contributes to increased viscosity
and plugging of the meibomian orifice, thus increasing the risk of DES[13].
It was noteworthy that the sample size of one included study
is larger than all the other studies[7],
which included patients from 365 eye clinics across America. And according to
the results of sensitivity analysis, omitting this study did not alter the
significance of the pooled results.
This Meta-analysis has several limitations. First, not all
the included studies are well adjusted for other risk factors of DES. Although
we have performed subgroup analysis according to some adjusted factors
(including age, gender, alcohol, autoimmune disease and thyroid disease), other
known risk factors (such as contact lens uses, hormone replacement therapy)
were not included in this Meta-analysis, which was due to insufficient data.
Second, the diagnostic criteria of the metabolic risk factors and DES are not
uniform, which definitely contributed to some certain heterogeneity. Third,
publication bias should be taken into consideration, as studies without
statistically significant results would not be published. In addition, too few
studies were included in our analysis to improve the accuracy of the Egger��s
linear regression test or Begg��s rank correlation test. Fourth, Kawashima et al[27] reported that metabolic syndrome could induce
lacrimal gland hypofunction, but no published articles in the three included
electronic databases reported epidemiological data on the relationship between
metabolic syndrome and DES. We therefore did not conducted Meta-analyses to
ascertain whether metabolic syndrome, combining the four risk factors together,
would increase the risk of DES. Lastly, compared to randomized controlled study
design, the case-control or cross-sectional study design may lead to some
systemic errors.
In summary, the pooled results of the 12 involved studies
showed that hyperglycemia, hypertension and hyperlipidemia increase the risk of
DES, while obesity does not. Although DES may be partly relieved by the use of
artificial tears and other drugs, DES patients usually have poor quality of
life. Thus, for ophthalmologists, the key point is to cure the disease by
understanding and addressing the underlying source. These findings indicate
that controlling metabolic risk factors may help to reduce DES prevalence.
Based ona uniform and more comprehensive diagnostic criteria (for example, to
classify tear osmolarity test as routine examination) large-scale and long-term
randomized controlled trials in various populations should be designed to
provide more powerful evidence to confirm the conclusions.
ACKNOWLEDGEMENTS
Conflicts of Interest: Tang YL, None; Cheng YL, None; Ren YP, None; Yu
XN, None; Shentu XC, None.
REFERENCES
1
Management and therapy of dry eye disease: report of the Management and Therapy
Subcommittee of the International Dry Eye WorkShop (2007). Ocul Surf 2007;5(2):163-178. [CrossRef]
2
Yang WJ, Yang YN, Cao J, Man ZH, Yuan J, Xiao X, Xing YQ. Risk factors for dry
eye syndrome: a retrospective case-control study. Optom Vis Sci 2015;92(9):e199-205. [CrossRef] [PubMed]
3
Vehof J, Kozareva D, Hysi PG, Hammond CJ. Prevalence and risk factors of dry
eye disease in a British female cohort. Br
J Ophthalmol 2014;98(12):1712-1717. [CrossRef] [PubMed]
4
Lemp MA. Report of the National Eye Institute/Industry workshop on Clinical
Trials in Dry Eyes. CLAO J 1995;21(4):221-232. [PubMed]
5
The definition and classification of dry eye disease: report of the Definition
and Classification Subcommittee of the International Dry Eye WorkShop (2007). Ocul Surf 2007;5(2):75-92. [CrossRef]
6
Tan LL, Morgan P, Cai ZQ, Straughan RA. Prevalence of and risk factors for
symptomatic dry eye disease in Singapore. Clin
Exp Optom 2015;98(1):45-53. [CrossRef] [PubMed]
7 Li
M, Gong L, Sun X, Chapin WJ. Anxiety and depression in patients with dry eye
syndrome. Curr Eye Res
2011;36(1):1-7. [CrossRef]
[PubMed]
8
Ahn JM, Lee SH, Rim TH, Park RJ, Yang HS, Kim TI, Yoon KC, Seo KY. Prevalence
of and risk factors associated with dry eye: the Korea National Health and
Nutrition Examination Survey 2010-2011. Am
J Ophthalmol 2014;158(6):1205-1214.e7. [CrossRef] [PubMed]
9
Schaumberg DA, Dana R, Buring JE, Sullivan DA. Prevalence of dry eye disease
among US men: estimates from the Physicians' Health Studies. Arch Ophthalmol 2009;127(6):763-768. [CrossRef] [PubMed] [PMC free article]
10
Uchino M, Yokoi N, Uchino Y, Dogru M, Kawashima M, Komuro A, Sonomura Y, Kato
H, Kinoshita S, Schaumberg DA, Tsubota K. Prevalence of dry eye disease and its
risk factors in visual display terminal users: the Osaka study. Am J Ophthalmol 2013;156(4):759-766. [CrossRef] [PubMed]
11
Galor A, Feuer W, Lee DJ, Florez H, Faler AL, Zann KL, Perez VL. Depression,
post-traumatic stress disorder, and dry eye syndrome: a study utilizing the
national United States Veterans Affairs administrative database. Am J Ophthalmol 2012;154(2):340-346.e2. [CrossRef] [PubMed]
12
Uchino M, Nishiwaki Y, Michikawa T, Shirakawa K, Kuwahara E, Yamada M, Dogru M,
Schaumberg DA, Kawakita T, Takebayashi T, Tsubota K. Prevalence and risk
factors of dry eye disease in Japan: Koumi study. Ophthalmology 2011;118(12):2361-2367. [CrossRef] [PubMed]
13
Viso E, Rodriguez-Ares MT, Gude F. Prevalence of and associated factors for dry
eye in a Spanish adult population (the Salnes Eye Study). Ophthalmic Epidemiol 2009;16(1):15-21. [CrossRef] [PubMed]
14
Moss SE, Klein R, Klein BE. Prevalence of and risk factors for dry eye
syndrome. Arch Ophthalmol
2000;118(9):1264-1268. [CrossRef]
[PubMed]
15
Chia EM, Mitchell P, Rochtchina E, Lee AJ, Maroun R, Wang JJ. Prevalence and
associations of dry eye syndrome in an older population: the Blue Mountains Eye
Study. Clin Experiment Ophthalmol
2003;31(3):229-232. [CrossRef] [PubMed]
16
Jie Y, Xu L, Wu YY, Jonas JB. Prevalence of dry eye among adult Chinese in the
Beijing Eye Study. Eye (Lond) 2008;23(3):688-693.
[CrossRef] [PubMed]
17
Malet F, Le Goff M, Colin J, Schweitzer C, Delyfer MN, Korobelnik JF, Rougier
MB, Radeau T, Dartigues JF, Delcourt C. Dry eye disease in French elderly
subjects: the Alienor Study. Acta
Ophthalmol 2014;92(6):e429-436. [CrossRef] [PubMed]
18
Solovjova S, Ryliskyte L, Celutkiene J, Badariene J, Navickas R, Puronaite R,
Bieliauskaite G, Skiauteryte E, Lisaite G, Laucevicius A. Aortic stiffness is
an independent determinant of left ventricular diastolic dysfunction in
metabolic syndrome patients. Blood Press
2016;25(1):11-20. [CrossRef]
[PubMed]
19
Moher D, Liberati A, Tetzlaff J, Altman DG; PRISMA Group. Preferred reporting
items for systematic reviews and meta-analyses: the PRISMA statement. Int J Surg 2010;8(5):336-341. [CrossRef] [PubMed]
20 Wells GA, Shea B, O'Connell D, Peterson J, Welch V,
Losos M, Tugwell P. . The Newcastle-Ottawa Scale (NOS) for assessing the
quality of nonrandomised studies in meta-analyses. http://www.ohri.ca/programs/clinical_epidemiology/oxford.htm/.
(2012 published), Date of access: 15/06/2012.
21
Higgins JP, Thompson SG, Deeks JJ, Altman DG. Measuring inconsistency in
meta-analyses. BMJ
2003;327(7414):557-560. [CrossRef]
[PubMed] [PMC free article]
22
DerSimonian R, Kacker R. Random-effects model for meta-analysis of clinical
trials: an update. Contemp Clin Trials
2007;28(2):105-114. [CrossRef]
[PubMed]
23
Egger M, Davey SG, Schneider M, Minder C. Bias in meta-analysis detected by a
simple, graphical test. BMJ
1997;315(7109):629-634. [CrossRef]
24
Xu L, You QS, Jonas JB. Prevalence of alcohol consumption and risk of ocular
diseases in a general population: the Beijing Eye Study. Ophthalmology 2009;116(10):1872-1879. [CrossRef] [PubMed]
25
Kaercher T, Honig D, Mobius D, Welt R. Morphology of the Meibomian lipid film.
Results of Brewster angle microscopy. Ophthalmologe
1995;92(1):12-16. [PubMed]
26
Sullivan BD, Pepose JS, Foulks GN.Progressively Increased Variation in Tear
Osmolarity Mirrors Dry Eye Severity. JAMA
Ophthalmol 2015;133(12):1481-1482. [CrossRef] [PubMed]
27
Kawashima M, Uchino M, Yokoi N, Dogru M, Uchino Y, Komuro A, Sonomura Y, Kato
H, Kinoshita S, Tsubota K. Decreased tear volume in patients with metabolic
syndrome: the Osaka study. Br J
Ophthalmol 2014;98(3):418-420. [CrossRef] [PubMed] [PMC free article]
[Top]