INTRODUCTION
High intraocular pressure (IOP) is the main risk factor for the development and progression of glaucoma[1].Moreover, nowadays IOP is the only factor that, when treated,has demonstrated to improve the control of this disease[1].
Today’s gold standard for measuring IOP is Goldmann applanation tonometry (GAT), however its measurements are conditioned by various corneal variables. Amongst them,central corneal thickness (CCT) has revealed to be one of the most important confounders of this tonometry method[2-3].In an attempt to overcome this dependence several new IOP-measuring instruments have been developed. These instruments include the rebound tonometer, the ocular response analyzer and the Pascal dynamic contour tonometer (DCT)[4].
DCT measurements have proved to be more independent of the corneal characteristics that are known to affect GAT measurements[4]. Nonetheless, several studies have highlighted that, though more independent, DCT is also conditioned by corneal structure[4-7].
Despite the consistent body of evidence that proves the effect of CCT on diverse tonometry systems, very few studies have analysed whether other corneal thicknesses different from that of the main centre, could have any impact on IOP measurements[7-10]. The present study was designed to determine the effects of peripheral corneal thickness (PCT) on IOP as determined through DCT and GAT.
SUBJECTS AND METHODS
We performed a cross-sectional study on healthy volunteers to determine the effect of PCT on DCT and GAT readings,adjusting for age and sex. Volunteers were recruited among the staff of the Hospital Clínico San Carlos, Madrid, Spain.The study protocol (branch of the study protocol HCSCFSFSBY-CORNEA&HRT/1) was approved by our institution’s Review Board (Ethics Committee of the Clinico San Carlos Hospital of Madrid Spain) and complied with the guidelines of the Declaration of Helsinki. Written informed consent was obtained from each participant before inclusion in the study.The study examiners were masked to patients' personal data to protect their con fi dentiality. All the study participants were Caucasian. Exclusion criteria were: a spherical equivalent greater than 5 diopters or 3 or more dioptres of astigmatism,a best corrected visual acuity lower than 20/25, IOP higher than 24 mm Hg or glaucomatous appearance of the optic disc.We also excluded subjects who had undergone previous eye surgery or had any corneal disease. One eye per participant was analyzed; if both eyes ful fi lled the inclusion and exclusion criteria, the eye to be analyzed was selected through an automatic randomization system (www.randomization.com).All the study participants underwent a Pentacam (Pentacam,Oculus, USA) examination and ultrasound pachymetry(Dicon P55, Paradigm Medical Industries Inc., Salt Lake City, UT, USA), DCT (SMT Swiss Microtechnology, Port,Switzerland), GAT (Haag-Streit AG, Gartenstadtstrasse 10, 3098 Koeniz, Switzerland). All the examinations were performed by the same ophthalmologist, though, to avoid the introduction of observer bias, the ophthalmologist was masked to the results of all the devices which were collected by other examiner. Given it is a non-contact procedure, the Pentacam evaluation was performed first; the remaining exams were conducted in random order according to an automated randomization procedure (www.randomization.com). Then using the pachymetric maps generated by the Pentacam (this instrument makes thickness measurements across the entire cornea perpendicular to its surface separated by a distance of 1 mm), we constructed a model of circular (no circumferential)corneal thickness segmentation centered at the corneal apex.To construct this model we created a software which, firstly,calculates the corneal contour as a function of the radius from the corneal apex to each pixel of the corneal limbus; note that,for the orientations which do not correspond to any pixel of the corneal contour, the corneal radius is obtained by linear interpolation of the nearest data pixel available; secondly, the software generates a central circumference with 1 mm radius and then, the remainder of the cornea, apart from the central circle, is segmented in 5 rings concentric with the corneal apex; therefore, the diameter of each ring is not constant around the corneal circumference as a consequence of the irregular contour of the cornea but the software keeps constant the diameter of each ring in each direction of the corneal contour. PCT was determined as the mean thickness of the most eccentric ring (that is the fifth ring moving outwards from the apex).
From each quantitative variable (GAT, DCT, age in years and PCT), mean with its 95% CI and standard deviation were determined. Their distributions were depicted using box-plots.Sex distribution was presented as the percentage of males and females.
To examine the pattern of the dependence of GAT and DCT measurements on PCT, two locally weighted scatterplot smoothing (LOWESS) regression were conducted. Thereafter,two multivariable linear regression models were constructed.In each of them, the dependant variable was GAT and DCT measurements respectively. In both of the regression models the main predictive variable was PCT though, LOWESS regression pattern was considered to decide the most suitable way to model the relationship between the dependant variables and the predictor one: linear ( first degree polynomial), n-degree polynomial, fractional polynomial, etc. Age and sex were also introduced together with PCT as control variables. To study the presence of interactions between the main predictive variable (PCT) and control variables (age and sex), first order interactions (products) were also included as predictors in the regression models. Control variables were considered to produce confusion if their removal from regression models produced a change on PCT regression coefficient (B) greater than 10%.
The amount of IOP variation explained through both regression models was determined (R2). The regression coefficients (B) of the predictor variables were calculated.
Predicted means of IOP for each value of PCT (in steps of 20 mm), were determined for both regression models.
Sample size was calculated on the basis of previous research on the effect of corneal thickness on GAT and DCT measurements in order to provide 90% power to detect a regression coefficient equal or greater than 0.05 assuming an a risk of 5%.
RESULTS
On the basis of previous research on the effect of corneal thickness on GAT and DCT measurements[5]. We estimated a sample size of 83 volunteers to provide 90% power to detect a regression coefficient equal or greater than 0.05 assuming an a risk of 5%.
Totally 109 volunteers who complied with inclusion/exclusion criteria were recruited (post hoc power of 96.17%).
Figure 1 shows an example of the corneal thickness segmentation model (right eye). PCT was calculated as the mean of the most eccentric ring.
Table 1 presents the means along with theirs 95% CI and standard deviations, of the quantitative variables analysed.The 50 of the volunteers were male (45.87%) and 59 female(54.13%). Figures 2 and 3 depict respectively PCT and IOP distributions.
Figures 4 and 5 present the result of LOWESS regression of PCT on GAT and DCT respectively. As these figures show, the relationship between IOP measurements performed by both tonometers and PCT rather than linear, presents an “inverted bell” or “U” shape. Taking the former into account, we decided that a 2nd-degree polynomial could be suitable to model the dependence of IOP measurements on PCT. Hence, in both regression models, PCT was introduced as a linear term (PCT)but also as quadratic term (PCT2). Thus, in both models the predictors were PCT, PCT2, age, sex and first term interactions between PCT and PCT2 with age and sex (PCT-sex, PCT-age,PCT2-sex, PCT2-age).
The amount of IOP variation explained by GAT regression model (R2) is 17.14% (F=9.02; P=0.0002). PCT linear term has a statistically significant effect on GAT measurements (B=-1.163; 95% CI: -1.163, -0.617). PCT quadratic term (PCT2)also shows a significant effect on GAT readings (B=0.00081;95% CI: 0.00043, 0.00118). Table 2 and Figure 6 provide the predicted GAT means along with theirs 95% CIs for the values of PCT ranging from 600 mm to 800 mm in steps of 20 mm.
The amount of IOP variation explained by DCT regression model (R2) is 14.28% (F=9.29; P=0.0002). PCT linear term has a statistically significant effect on DCT measurements (B=-0.712; 95% CI: -1.052, -0.372). PCT quadratic term (PCT2)also shows a significant effect on DCT readings (B=0.0005;95% CI: 0.0003, 0.0007). Table 3 and Figure 7 provide the predicted DCT means along with theirs 95% CIs for the values of PCT ranging from 600 mm to 800 mm in steps of 20 mm.
No significant interaction term arose in both models. Neither age nor sex produced a significant effect on IOP measurements.Moreover, the removal of age and/or sex from both regression models did not produce a clinically significant modification in the regression coefficients of PCT and PCT2 (effect <10%),thus adjusting for these variables was discarded.
DISCUSSION
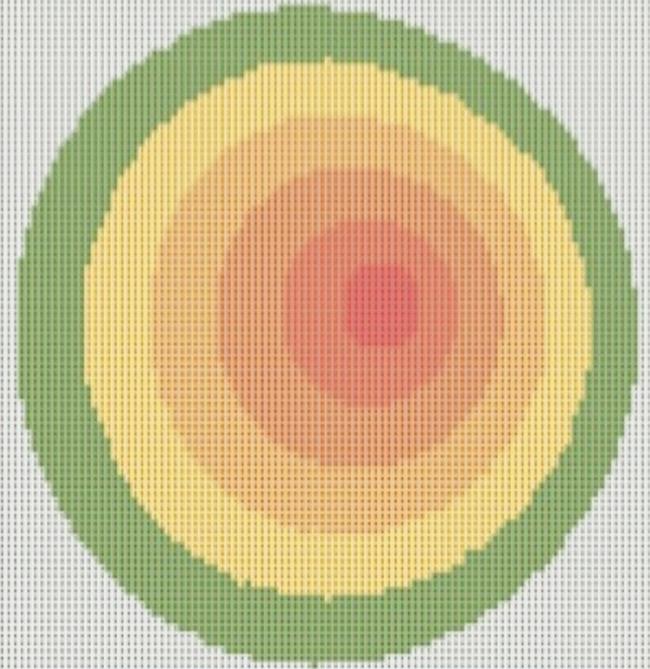
Figure 1 Corneal thickness segmentation model (right eye) PCT was calculated as the mean of the most eccentric ring (depicted in green).

Figure 2 Distribution of PCT.

Figure 3 IOP distribution as measured using DCT and GAT.
Table 1 Descriptive statistics of the quantitative variables
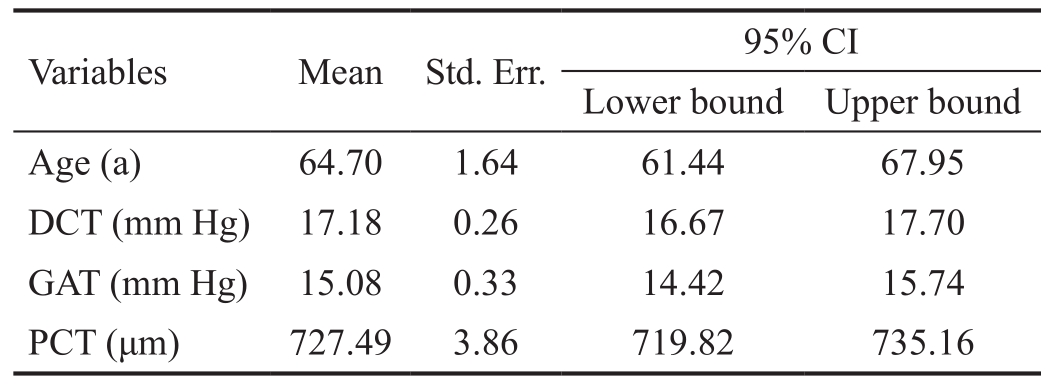
DCT: Dynamic contour tonometry; GAT: Goldmann applanation tonometry; PCT: Perpheral corneal thickness.
GAT remains the gold standard for IOP determination.Nonetheless, its readings are conditioned by several morphometric variables of the eye such as corneal thickness, curvature,hysteresis and ocular the longitudinal axis[11]. Amongst those parameters, CCT is one of the main sources of confounding for this device[12-14]. Interestingly, apart from its confounder role,CCT has been identified as a risk factor for both developing glaucoma and progressing, for those already diagnosed with this disease[15-16].

Figure 4 LOWESS regression of PCT on GAT.
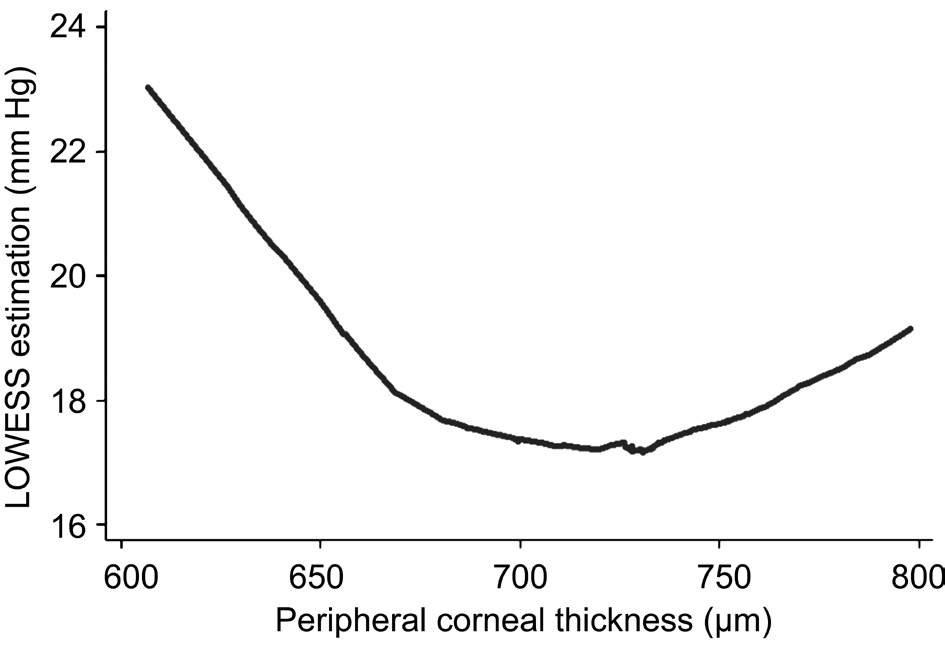
Figure 5 LOWESS regression of PCT on DCT.
Table 2 GAT predicted means
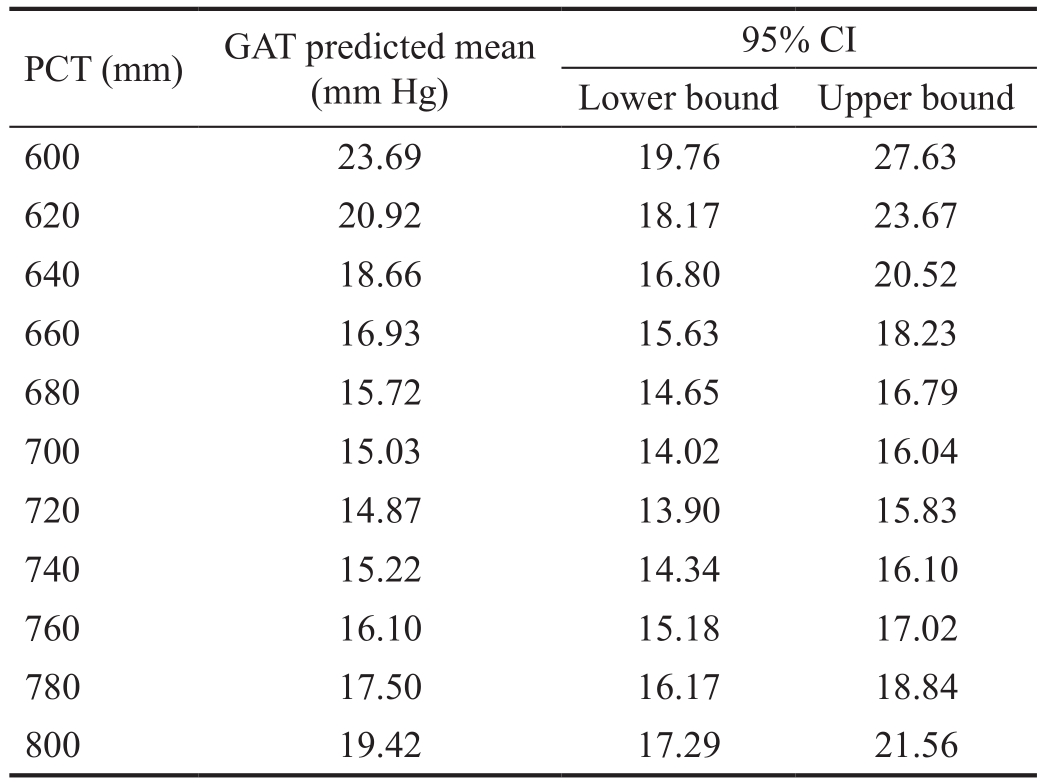
GAT: Goldmann applanation tonometry; PCT: Peripheral corneal thickness.
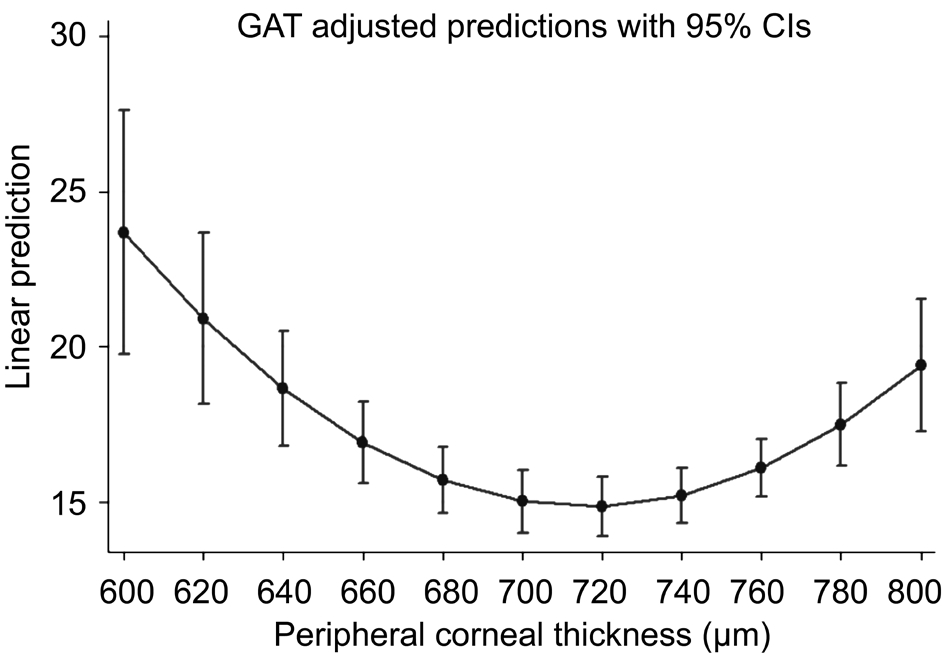
Figure 6 Predicted GAT means for values of PCT ranging from 600 mm to 800 mm in steps of 20 mm.
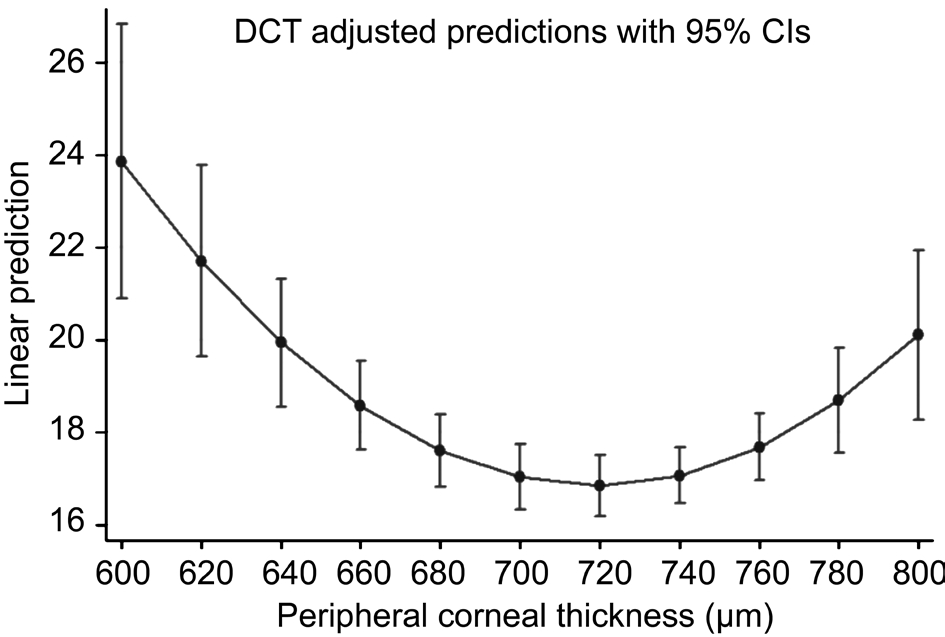
Figure 7 Predicted DCT means along with theirs 95% CIs for the values of PCT ranging from 600 mm to 800 mm in steps of 20 mm.
Table 3 DCT predicted means
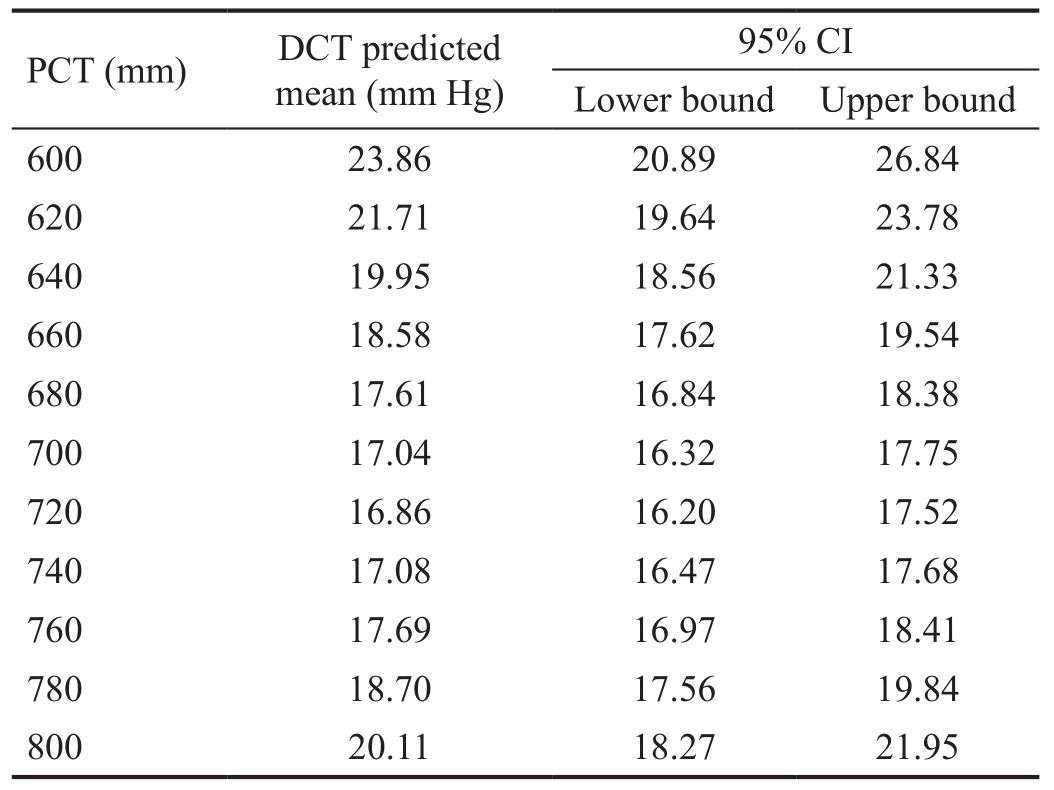
DCT: Dynamic contour tonometry; PCT: Peripheral corneal thickness.
The dependence of GAT on corneal factors, especially on CCT, along with the failure of the attempts to estimate formulas or nomograms to correct GAT readings according to CCT[17-19], has led to the development of new tonometry systems that pretend to be less influenced by any extrinsic variable. Amongst these, DCT has proved to be as perhaps the most independent tonometer from morphometric parameters[4], however, several studies have put forward that this independence is not absolute[4-7]. Nevertheless, there is no absolute consensus in the literature about the dependence of DCT on CCT. Moreover, there is not a definitive agreement with regard to the exact relationship that exists between GAT and corneal variables[20-27]. On the contrary, a wide consensus exists with regard to the fact that DCT tends to overestimate IOP compared to GAT[4,19-21]. Riva et al[28] have studied the relationship between DCT and GAT readings and intracameral assessed IOP in glaucomatous patients, showing that, whereas DCT overestimates intracameral IOP, GAT underestimates it.These authors found a similar influence of CCT on both DCT and GAT.
In clear opposition to the fl amboyant technological deployment that the development of the new tonometers have supposed,few attention seems to be paid to the technique and procedures used to determine corneal thickness. In this respect, ultrasound pachymetry continues to be the most widespread method to determine CCT at least in the field of glaucoma. In this method,an examiner places the ultrasound probe approximately, let’s not say haphazardly, in the centre of the cornea. Despite de former, ultrasound pachymetry has shown to be a quite reliable and reproducible method[29], although it has been demonstrated that the Pentacam shows higher reproducibility[30]. Nonetheless,several studies have put forward the utility of this pachymetric method in the field of glaucoma[31-32], though their results are not completely interchangeable with those of the Pentacam[33].With regard to the importance of other corneal thicknesses apart from CCT in the field of glaucoma, a non-significant lower peripheral thickness in patients diagnosed with normaltension glaucoma (NTG) than in healthy subjects has been reported[34]. In addition, Tonopen IOP measurements performed at the peripheral cornea are conditioned by corneal thickness estimations performed at the same point[35]. A comparison of central and paracentral corneal thicknesses between ocularhypertensive (OHT) subjects and NTG patients revealed that the former group tended to have higher values than the later[36].Is noteworthy that all non-central thickness performed in the above studies are punctual estimations[34-36]. In previous research, we considered that the estimation of the mean thickness of corneal zones rather than punctual measurements could provide with a more realistic scheme of corneal thickness pattern. Apart from the former, we also considered that these zones should have a rational disposition, thus, we decided to use corneal apex as the main reference point to locate this areas. Thereafter, we designed a software based on the pachymetric maps provided by the Pentacam to virtually divide the cornea in different ring-shaped patterns. These segmentation schemes provided the mean thickness of several non-central corneal areas which, not only proved to affect different tonometry devices[5,7], but also showed a significant effect when considering corneal thickness as an independent glaucoma risk factor[7,37-38]. One of the main problems that arose with our partitioning design was the hyper-correlation between the mean thicknesses of different corneal zones which could result in a collinearity phenomenon when introducing these thicknesses altogether in the regression models. The approach of the present study differs slightly from our former works as we have considered PCT as the unique main predictor. In our study, PCT was defined as the mean thickness of an eccentric corneal ring concentric with the corneal apex. To determine this ring, our software firstly defines the corneal contour as a function of the radius from the corneal apex to each pixel of the corneal limbus; secondly, the software generates a central circumference of certain diameter (as determined by the examiner) and then, the remainder of the cornea, apart from the central circle, is segmented in as many rings as the examiner decides; we would like to highlight the fact that diameter of each ring is not constant around the corneal circumference as a consequence of the irregular shape of the corneal contour but the software keeps constant the diameter of each ring in every direction. Therefore, PCT was defined as the mean thickness of the most eccentric corneal ring which, centered at the corneal apex, results from dividing the cornea in several regions consisting in the central circle and the rings concentric with it. The decision on the diameter of the central circle and the number of concentric rings was a result of a trade of between the amount of IOP (dependant variable) variation explained by the regression models and the maximum area of peripheral corneal analyzed: in this case, for both DCT and GAT it was a central circle of 1 mm radius and five concentric rings. Remarkably, the amount of IOP variation is higher in our model than when using CCT as the main predictor (11% for GAT and no significant variation for DCT).
Another issue that we consider should be taken into account is the fact that the dependence of IOP (as measured by both DCT and GAT) on PCT, rather than linear, is better modelled with a second-degree polynomial equation. Furthermore, there is not a statistically significant linear relation between DCT or GAT and PCT. The explanation of the biological reason for the pattern of this relationship between IOP and PCT is beyond the scope of this study. As far as we are aware, there is not a previous report in Scientific literature which models the relationship between IOP and corneal thickness using a nonlinear model.
This study presents a non-linear dependence of DCT and GAT measurements on PCT. In our opinion, this fact supports the idea that the relationship between IOP measurements and corneal thickness is by far more complex than that explained by CCT alone. One of our major concerns is the fact that our analysis is limited to a sample of healthy Caucasian volunteers;the reason for including just subjects from this ethnic group is that in our institution the population attended is mainly Caucasian. Further studies should be performed to con firm if our results are applicable to other ethnic groups and to patients suffering from OHT or glaucoma in its various forms.
ACKNOWLEDGEMENTS
Foundation: Supported in part by Carlos III Health Institute,“Research Cooperative Network. Project RD07/0062: Ocular ageing pathology, visual quality of life”.
Conflicts of Interest: Saenz-Frances F, None; Sanz-Pozo C, None; Borrego-Sanz L, None; Jañez L, None; Morales-Fernandez L, None; Martinez-de-la-Casa JM, None;Garcia-Sancehz J, None; Garcia-Feijoo J, None; Santos-Bueso E, None.
REFERENCES
1 Leske MC. The epidemiology of open-angle glaucoma: a review. Am J Epidemiol 1983;118(2):166-191.
2 Lee M, Ahn J. Effects of central corneal stromal thickness and epithelial thickness on intraocular pressure using Goldmann applanation and noncontact tonometers. PLoS One 2016;11(3):e0151868.
3 Davey PG, Elsheikh A, Garway-Heath DF. Clinical evaluation of multiparameter correction equations for Goldmann applanation tonometry.Eye (Lond) 2013;27(5):621-629.
4 Martínez-de-la-Casa JM, Garcia-Feijoo J, Vico E, Fernandez-Vidal A,Benitez del Castillo JM, Wasfi M, Garcia-Sanchez J. Effect of corneal thickness on dynamic contour, rebound, and Goldmann tonometry.Ophthalmology 2006;113(12):2156-2162.
5 Saenz-Frances F, Jañez L, Borrego-Sanz L, Martinez-de-la-Casa JM,Jerez-Fidalgo M, Garcia-Sánchez J, Garcia-Feijoo J. Effect of corneal morphometry on dynamic contour and Goldmann applanation tonometry.J Glaucoma 2013;22(5):380-383.
6 Özcura F, Yildirim N, Şahin A, Çolak E. Comparison of Goldmann applanation tonometry, rebound tonometry and dynamic contour tonometry in normal and glaucomatous eyes. Int J Ophthalmol 2015;8(2):299-304.
7 Saenz-Frances F, Jañez L, Borrego-Sanz L, Martinez-de-la-Casa JM,Morales-Fernandez L, Santos-Bueso E, Garcia-Sanchez J, Garcia-Feijoo J. Characterization of the thickness of different corneal zones in glaucoma:effect on dynamic contour, Goldmann and rebound tonometries. Acta Ophthalmol 2013;91(8):e620-e627.
8 Wasielica-Poslednik J, Lisch W, Bell K, Weyer V, Pfeiffer N, Gericke A. Reproducibility and daytime-dependent changes of corneal epithelial thickness and whole corneal thickness measured with Fourier domain optical coherence tomography. Cornea 2016;35(3):342-349.
9 Ahmadi Hosseini SM, Abolbashari F, Mohidin N. Anterior segment parameters in Indian young adults using the Pentacam. Int Ophthalmol 2013;33(6):621-626.
10 Martin R, Jonuscheit S, Rio-Cristobal A, Doughty MJ. Repeatability of Pentacam peripheral corneal thickness measurements. Cont Lens Anterior Eye 2015;38(6):424-429.
11 Khan MA. Numerical study on human cornea and modified multiparametric correction equation for Goldmann applanation tonometer.J Mech Behav Biomed Mater 2014;30:91-102.
12 Wang SY, Melles R, Lin SC. The impact of central corneal thickness on the risk for glaucoma in a large multiethnic population. J Glaucoma 2014;23(9):606-612.
13 Schallhorn JM, Schallhorn SC, Ou Y. Factors that influence intraocular pressure changes after myopic and hyperopic LASIK and photorefractive keratectomy: a large population study. Ophthalmology 2015;122(3):471-479.
14 Kim NR, Kim CY, Kim H, Seong GJ, Lee ES. Comparison of Goldmann applanation tonometer, noncontact tonometer, and TonoPen XL for intraocular pressure measurement in different types of glaucomatous,ocular hypertensive, and normal eyes. Curr Eye Res 2011;36(4):295-300.
15 Kass MA, Heuer DK, Higginbotham EJ, Johnson CA, Keltner JL, Miller JP, Parrish RK 2nd, Wilson MR, Gordon MO. The Ocular Hypertension Treatment Study: a randomized trial determines that topical ocular hypotensive medication delays or prevents the onset of primary open-angle glaucoma. Arch Ophthalmol 2002;120(6):701-713.
16 Weinreb RN, Zangwill LM, Jain S, Becerra LM, Dirkes K,Piltz-Seymour JR, Cioffi GA, Trick GL, Coleman AL, Brandt JD,Liebmann JM, Gordon MO, Kass MA; OHTS CSLO Ancillary Study Group. Predicting the onset of glaucoma: the confocal scanning laser ophthalmoscopy ancillary study to the Ocular Hypertension Treatment Study. Ophthalmology 2010;117(9):1674-1683.
17 Shetgar AC, Mulimani MB. The central corneal thickness in normal tension glaucoma, primary open angle glaucoma and ocular hypertension.J Clin Diagn Res 2013;7(6):1063-1067.
18 Orssengo GJ, Pye DC. Determination of the true intraocular pressure and modulus of elasticity of the human cornea in vivo. Bull Math Biol 1999;61(3):551-572.
19 Gunvant P, O'Leary DJ, Baskaran M, Broadway DC, Watkins RJ,Vijaya L. Evaluation of tonometric correction factors. J Glaucoma 2005;14(5):337-343.
20 Realini T, Weinreb RN, Hobbs G. Correlation of intraocular pressure measured with Goldmann and dynamic contour tonometry in normal and glaucomatous eyes. J Glaucoma 2009;18(2):119-123.
21 Lanza M, Borrelli M, De Bernardo M, Filosa ML, Rosa N. Corneal parameters and difference between Goldmann applanation tonometry and dynamic contour tonometry in normal eyes. J Glaucoma 2008;17(6):460-464.
22 Jordão ML, Lupinacci AP, Ferreira EL, Enomoto IJ, Costa VP.influence of age, central corneal thickness, and quality score on dynamic contour tonometry. Eye(Lond) 2009;23(6):1364-1369.
23 Halkiadakis I, Patsea E, Chatzimichali K, Skouriotis S, Chalkidou S, Amariotakis G, Papakonstadinou D, Theodossiadis G, Amariotakis A, Georgopoulos G. Comparison of dynamic contour tonometry with Goldmann applanation tonometry in glaucoma practice. Acta Ophthalmol 2009;87(3):323-328.
24 Hamilton KE, Pye DC, Kao L, Pham N, Tran AQ. The effect of corneal edema on dynamic contour and Goldmann tonometry. Optom Vis Sci 2008;85(6):451-456.
25 Milla E, Duch S, Buchacra O, Masuet C. Poor agreement between Goldmann and Pascal tonometry in eyes with extreme pachymetry.Eye(Lond) 2009;23(3):536-542.
26 Ceruti P, Morbio R, Marraffa M, Marchini G. Comparison of Goldmann applanation tonometry and dynamic contour tonometry in healthy and glaucomatous eyes. Eye(Lond) 2009;23(2):262-269.
27 Grieshaber MC, Schoetzau A, Zawinka C, Flammer J, Orgul S. Effect of central corneal thickness on dynamic contour tonometry and Goldmann applanation tonometry in primary open-angle glaucoma. Arch Ophthalmol 2007;125(6):740-744.
28 Riva I, Quaranta L, Russo A, Katsanos A, Rulli E, Floriani I. Dynamic contour tonometry and Goldmann applanation tonometry: correlation with intracameral assessment of intraocular pressure. Eur J Ophthalmol 2012;22(1):55-62.
29 Gunvant P, Broadway DC, Watkins RJ. Repeatability and reproducibility of the BVI ultrasonic Pachymeter. Eye(Lond) 2003;17(7):825-828.
30 Lackner B, Schmidinger G, Pieh S, Funovics MA, Skorpik C.Repeatability and reproducibility of central corneal thickness measurement with Pentacam, Orbscan and ultrasound. Optom Vis Sci 2005;82(10):892-899.
31 Singh RP, Goldberg I, Graham SL, Sharma A, Mohsin M. Central corneal thickness, tonometry and ocular dimensions in glaucoma and ocular hypertension. J Glaucoma 2001;10(3):206-210.
32 Kitsos G, Gartzios C, Asproudis I, Bagli E. Central corneal thickness in subjects with glaucoma and in normal individuals (with or without pseudoexfoliation syndrome). Clin Ophthalmol 2009;3:537-542.
33 Yu A, Zhao W, Savini G, Huang Z, Bao F, Lu W, Wang Q, Huang J. Evaluation of central corneal thickness using corneal dynamic Scheimp fl ug Analyzer Corvis ST and comparison with Pentacam Rotating Scheimpflug System and ultrasound pachymetry in normal eyes. J Ophthalmol 2015;2015:767012.
34 Rüfer F, Westphal S, Erb C. Comparison of central and peripheral corneal thicknesses between normal subjects and patients with primary open angle glaucoma, normal tension glaucoma and pseudoexfoliation glaucoma. Klin Monbl Augenheilkd 2007;224(8):636-640.
35 Amaral WO, Teixeira RM, Alencar LM, Cronemberger S, Calixto N. Central and peripheral corneal thickness: influence on the iop measurement by Tonopen. Arq Bras Oftalmol 2006;69(1):41-45.
36 Jordan JF, Joergens S, Dinslage S, Dietlein TS, Krieglstein GK. Central and paracentral corneal pachymetry in patients with normal tension glaucoma and ocular hypertension. Graefes Arch Clin Exp Ophthalmol 2006;244(2):177-182.
37 Saenz-Frances F, Garcia-Feijó J, Jañez L, Borrego-Sanz L, Martinez de la Casa JM, Fernandez-Vidal A, Mendez-Hernández C, Santos-Bueso E, Reche-Frutos J, Garcia-Sánchez J. Comparing corneal variables in healthy subjects and patients with primary open-angle glaucoma. Invest Ophthalmol Vis Sci 2011;52(6):3683-3688.
38 Saenz-Frances F, Jañez L, Berrozpe-Villabona C, Borrego-Sanz L,Morales-Fernández L, Acebal-Montero A, Mendez-Hernandez CD,Martinez-de-la-Casa JM, Santos-Bueso E, Garcia-Sanchez J, Garcia-Feijoo J. Corneal segmentation analysis increases glaucoma diagnostic ability of optic nerve head examination, Heidelberg Retina Tomograph's Moorfield's Regression Analysis, and Glaucoma Probability Score. J Ophthalmol 2015;2015:215951.