INTRODUCTION
Glaucoma is characterized by a progressive degeneration of the retinal ganglion cells (RGCs) and their axons leading to a reduction in the thickness of the retinal nerve fiber layer (RNFL) and RGCs layer[1-5]. This retina thickness loss makes optical coherence tomography (OCT) useful in glaucoma diagnosis since it allows objective measurement of the optic nerve head[6-10], RNFL[11], and macular thickness parameters[12-14].
Recently, a new protocol of OCT was proposed. Posterior pole asymmetry analysis (PPAA) was introduced to detect early glaucomatous damage[15-18]. By superimposing a 64-cell square grid on a 24°×24° retinal region centered on the foveola, PPAA yields retina thickness of each cell, as well as the retina thickness asymmetry (RTA) between superior and inferior corresponding cells (Figure 1A). The RTA is presented in a hemisphere asymmetry map displayed as a grey scale,in which white indicates no asymmetry and black represents greater asymmetries of more than 25 μm[19].
The RTA analysis seems to be promising in early glaucoma detection because glaucomatous damages often originate in only one horizontal hemifield[20]. Aside from that, this parameter also shows less between-subject variability in healthy population (compared to the parameter of retina thickness) and it isn’t affected by magnification factors such as axial length and corneal curvature[19].
Several studies reported that PPAA could potentially serve as an assessment tool in the early diagnosis of glaucoma. In these studies, RTA increased as significant as glaucomatous damage developed, hence were measured to distinguish glaucoma patients from healthy controls. To be more precise,researchers divided the posterior pole region into several zones and each zone included correlative pairs in superior and inferior hemifields, RTAs of these zones were measured.Although various investigators had different customs for zones setting, they all made full utilization of the whole posterior pole map to interpret PPAA printouts[16,21-24]. Alluwimi et al[19]questioned this study area because they found that, in a healthy population, RTA in posterior pole periphery area (i.e. 10°-20°from the foveola) had dramatically high between-subject variability. In other words, high variability appeared in the RTA of healthy periphery area has an overlap with the RTA in glaucoma patients. Ultimately, combining all of the zones together (the whole posterior pole map) produced even higher between-subject RTA variability in normal populations. Same conclusions were obtained by Jacobsen et al[25].
Given the fact that the periphery area of the map includes an extensive network of blood vessels and few RGCs, it’s not difficult to understand the dramatic local RTA fluctuation existing in a healthy population[19]. The high variability appearing in healthy periphery RTA makes normal people’s RTA overlap patients’ RTA, which may induce poor specificity of PPAA diagnostic capacity. These findings cannot be neglected because they implicate that the periphery area of posterior pole maps may not be suitable for PPAA interpretation. Due to the reasons we mentioned above, investigators suggested cautious interpreting strategies for PPAA printouts[19]. However, based on our knowledge, there is no study yet to characterize the periphery area RTA of glaucoma patients, which affirms that involving the periphery area can adversely impact the diagnostic ability of PPAA reports.
In our current study, we proposed a new strategy (Figure 1B) which divides the overlay 24°×24° grid into three zones per hemifield based on previous literature[19,26-27]. Zone 1 is defined as the area 10°-20° in posterior pole map. Rich in blood vessels, it shows high RTA variability in a healthy population[19]. Zone 2 is also reported with high RTA variability in healthy controls although it is the glaucoma susceptible area[19,26]. Zone 3 is quite vulnerable to glaucomatous damage and RTA in this area shows the minimal between-subject variability[26]. We hypothesize that glaucomatous damage fails to exert significant impact on PPAA in periphery area, we also hypothesize that strategies utilized in the periphery area of posterior pole map are not able to distinguish glaucoma patients from normal populations, thus involving this region would impair PPAA diagnostic efficiency.
SUBJECTS AND METHODS
Participants We recruited normal subjects and glaucoma patients from ongoing studies at Western China Hospital that were approved by Western China Hospital Institutional Review Board and Health Research Ethics Committee. This crosssectional study adhered to the tenets of Declaration of Helsinki.Inclusion criteria for both groups were: 1) best-corrected visual acuity of 20/30 or better, refractive error between -12 and +3 diopter (D) spherical equivalent; 2) cylinder correction within 3 D; 3) clear ocular media to prevent poor-quality imaging of the optic disc and macula. Open angle glaucoma was defined as the presence of glaucomatous optic nerve appearance,associated structural and functional visual field (VF) defect identified by RNFL photography and standard automated perimetry (OCTOPUS), and open angle on gonioscopic examination. A glaucomatous VF change was defined as 1)outside normal limit on glaucoma hemifield test; or 2) mean defect (MD) was greater than 2 dB; or 3) loss variance (LV)was greater than 5 dB, and at least seven points with sensitivity decreased by more than 5 dB, three of them being contiguous,confirmed by two consecutive tests[28]. A VF measurement was considered to be reliable when false-positive/negative results were less than 15% and fixation losses were less than 20%[28-31].In our study, glaucomatous eyes were classified into three categories based upon the MD. Respectively, these groups had MD values better than -1.5 dB (mild glaucoma group), between-1.5 and -5.5 dB (moderate glaucoma group), or worse than-5.5 dB (severe glaucoma group)[26]. For glaucoma patient,age matched healthy subjects who visited the clinic during the same recruitment period were enrolled and served as control subjects. Healthy subjects had 1) intraocular pressure (IOP)less than 21 mm Hg with no history of elevated IOP; 2) normal appearance of optic disc, intact neuroretinal rim, and RNFL;3) normal VF, defined as a MD within normal range and a glaucoma hemifield test result within normal limits. Exclusion criteria for both groups were 1) severe myopic disc and fundus changes impairing adequate evaluation for glaucoma; 2) media opacities impaired imaging; 3) coexisting retinal or neurologic diseases that could confound the results of VF examination and spectral domain (SD)-OCT; 4) poor quality SD-OCT scans that had significant artifacts (poor signal strength <8, loss of fixation, asymmetric illumination, or motion artifacts such as edge duplication); 5) any intraocular surgery within the last 6mo. The affected eye was selected in patients with unilateral glaucoma, and if both eyes of a patient had glaucoma and met the inclusion criteria, one eye was randomly selected for entry.A healthy control eye was randomly selected in patients with no sign of glaucoma in both eyes.
Each subject underwent a full ophthalmic examination including best-corrected visual acuity, IOP measurement, slitlamp biomicroscopy, anterior chamber angle examination by 4-mirror gonioscopy and fundus examination by direct ophthalmoscope. The VF examination was done on an OCTOPUS white to white perimetry with G1 test program and TOP strategy. The OCT scanning for PPAA was done using spectralis SD-OCT (Heidelberg Engineering, Heidelberg,Germany). Fundus examinations were performed by two experienced glaucoma specialists (Chen XM and Li N), OCT scanning and VF examinations were performed by one of the authors (Zhang Y) and all of the OCT examinations were performed within a timeframe of two weeks of the last VF testing[28-31].
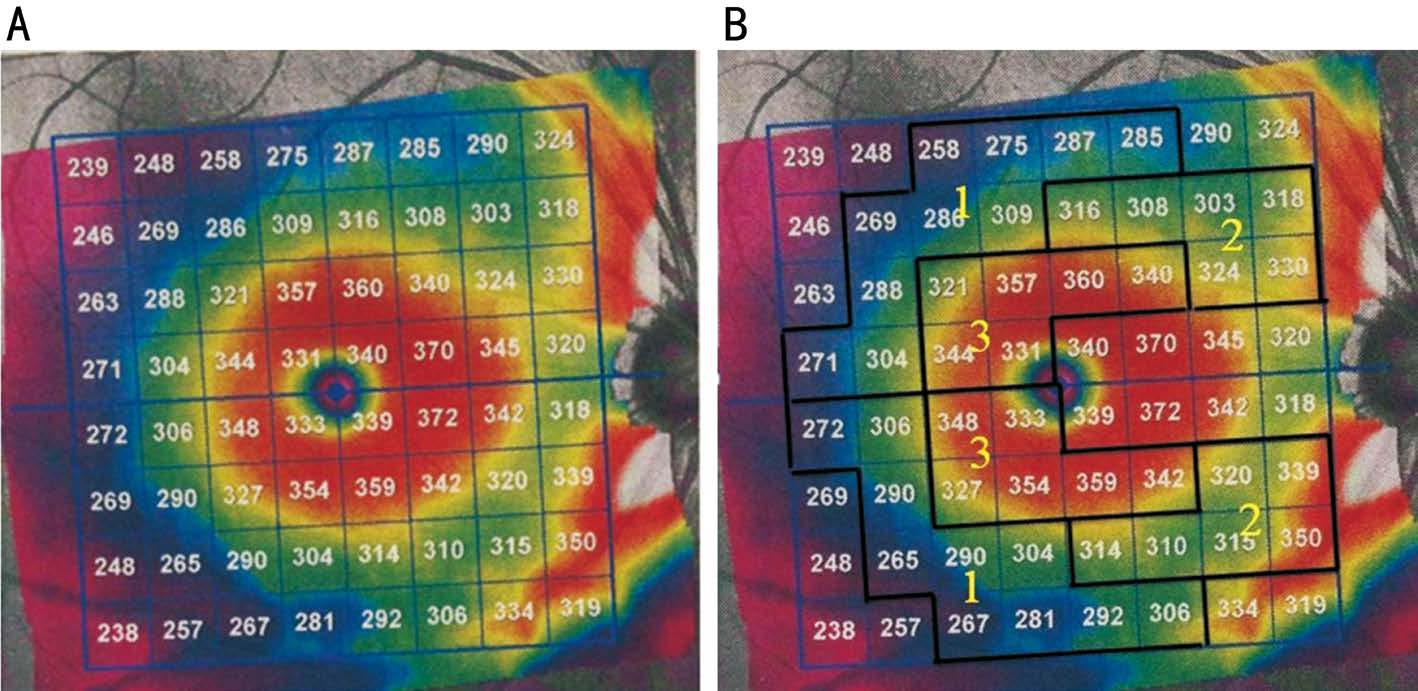
Figure 1 Posterior pole retinal thickness map of OCT A: The 64 grids used in PPAA; B: Three zones designed for RTA calculation and analysis.
Spectralis Optical Coherence Tomography All patients were scanned using the commercially available SD-OCT Spectralis HRA+OCT (Heidelberg Engineering). This instrument uses a wavelength of 820 nm in the near infrared spectrum in the SLO mode. The light source of the SD-OCT is a super luminescent diode with a wavelength of 870 nm.Infrared images and OCT scans (40 000 A-scans/s) of the dual laser scanning systems are acquired simultaneously. The macular thickness measurements were obtained using the posterior pole asymmetry scan protocol. This scan protocol was applied to targeted eyes in all subjects, providing 61 B-scans 120 μm apart for each scan, with an optical resolution of 7 μm axially and 14 μm laterally. Subjects were asked to fixate their eyesight on an internal blue fixation target in the Spectralis camera. The camera was centered on the fovea with even illumination within a 6×6 mm area. The operator manually realigned and centered the grid on the fovea when needed, and readjusted the central line of the grid to align with the foveal-optic disc axis. Any OCT image with a quality score below 25 was excluded. As shown in Figure 1A, the retinal thickness grid overlays a 24°×24° retinal region centered on the measured area of 30°×25°. This grid is composed of 64 cells; each cell represents the average measured retinal thickness of a 3°×3° area. Asymmetry analysis of the posterior pole was evaluated with the map which compares the superior to inferior hemispheres (hemisphere asymmetry) for each eye. One hemisphere includes 32 cells and each cell has an equivalent in the opposite hemisphere. The difference in retinal thickness between the two equivalent cells is indicated with colors changing from white to black. A black cell means that the difference in retinal thickness is ≥30 μm[15-18].
Statistical Analysis The retina thickness map yielded by posterior pole analysis is divided into 64 sectors centered on the fovea (Figure 1A). In the present study, we divided both the superior and inferior hemifields into three zones; each zone included reciprocal regions from either hemifield (Figure 1B).
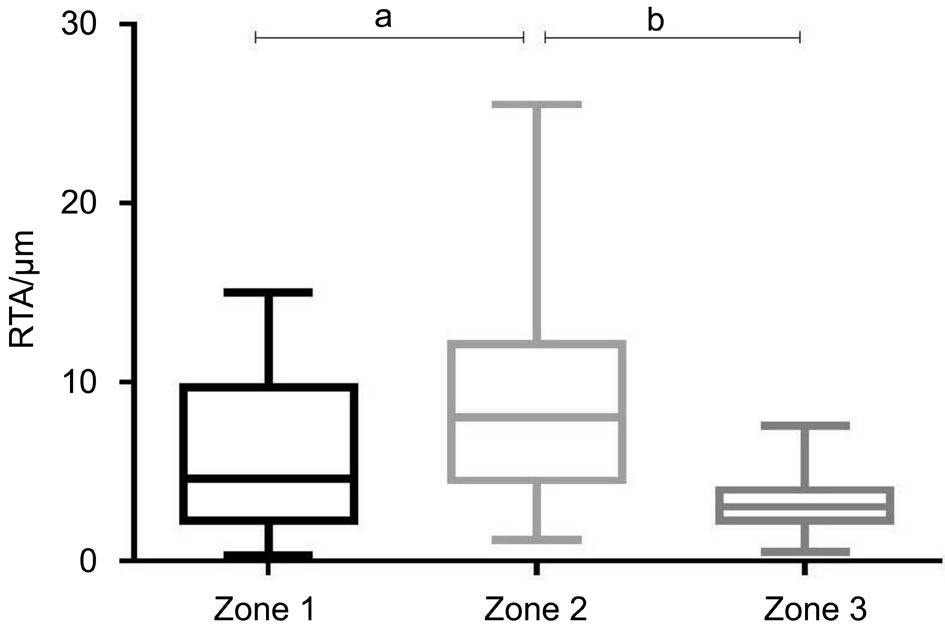
Figure 2 Characterization of RTA of zone 1, 2 and 3 in control group(n=39 eyes) aP<0.01, bP<0.0001. Mean±standard errors are shown.
The average retinal thickness of each of the three zones was measured in both the superior and inferior hemifields. Withineye asymmetries (i.e. RTAs) between corresponding pairs of locations were calculated.
To test whether RTA of Zone 3 shows the minimal variation in a normal population as the previous literature reported, we descriptively analyzed RTAs of the three zones in control group(Figure 2). Means, standard deviations (s) and 95% confidence intervals (CIs) of the RTAs were determined. To decide whether RTA of each zone alters as glaucoma develops, we summarized the RTAs of control, mild, moderate and severe glaucoma groups and made multiple comparisons among them(Figure 3). Then we used receiver operating characteristic(ROC) curves to test and compare the efficacy of strategies using different zones to discriminate glaucomatous eyes from the healthy ones (Figure 4). Last but not least, to test our hypothesis that interpreting the whole PPAA map (including the periphery region) would lead to low diagnostic efficiency,we calculated the absolute retina thickness difference between superior and inferior hemispheres with the data from the same participants and made a ROC curve (Figures 5, 6).
One-way ANOVA and Chi-square test were performed using commercial software (Prism 5; GraphPad Software, Inc.,La Jolla, CA, USA). Tukey’s adjustments were used as posthoc tests to correct the comparisons. ROC curves, the area under the ROC curve (AUROC) and the comparisons among AUROCs were accomplished using MedCalc statistical software. For all tests, statistical significance was considered to be P<0.05.
Table 1 Demographics and visual field data from healthy and glaucoma patients

Comparisons among the groups were performed using one-way ANOVA and Pearson Chi-square, Tukey’s adjustments were used as post hoc tests to correct the comparisons. aControl vs mild glaucomatous; bControl vs moderate glaucomatous; cControl vs severe glaucomatous. MD:Mean defects.
Table 2 Descriptive statistics summarizing RTAs of different zones in control group

RTA: Retinal thickness asymmetry.
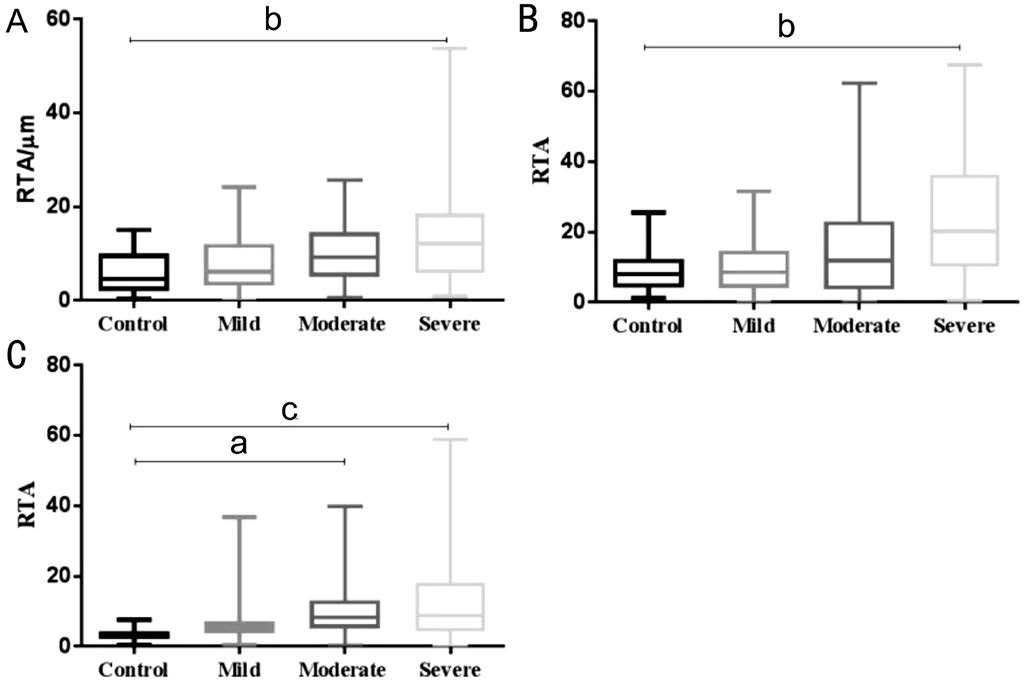
Figure 3 Influence of different stages of glaucoma on RTA of each zone A: Influence of different stages of glaucoma on RTA of zone 1; B: Influence of different stages of glaucoma on RTA of zone 2; C:Influence of different stages of glaucoma on RTA of zone 3. aP<0.01,bP<0.0001, cP<0.00001. Mean±standard errors are shown.
RESULTS
A total of 39 healthy, 40 mild, 33 moderate and 41 severe glaucomatous eyes were included in the present study. The average VF MD were -0.3±1.2 dB for the control group,0.6±0.9 dB for mild glaucoma group, 3.6±1.9 dB for moderate glaucoma group and 13.2±7.6 dB for severe glaucoma group.Our data showed that there was no MD difference between normal and mild glaucoma eyes, whereas the average MD in moderate and severe groups significantly increased. All study participants were Asian (Chinese), and glaucoma patients were age-matched with healthy controls (Table 1).
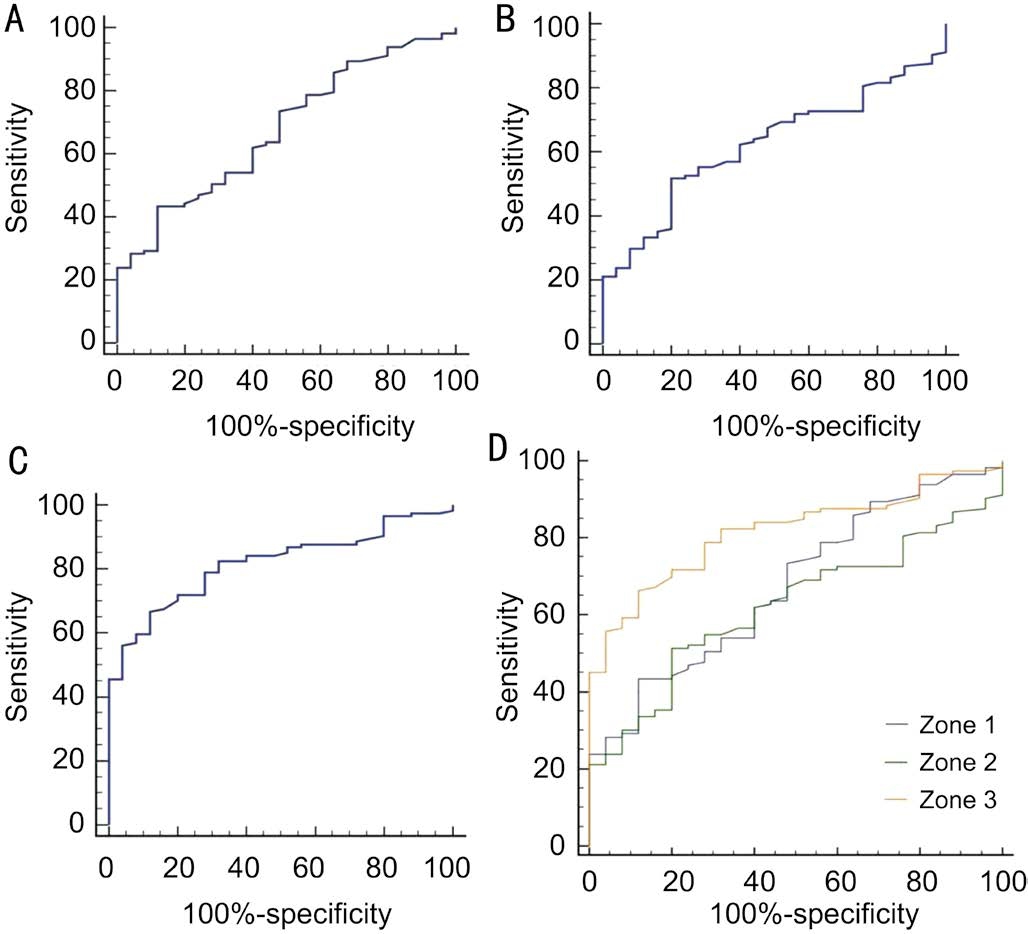
Figure 4 ROC curves of strategies using each zone A: ROC curve of strategy using zone 1; B: ROC curve of strategy using zone 2;C: ROC curve of strategy using zone 3; D: Figure A, B and C were merged in Figure D.
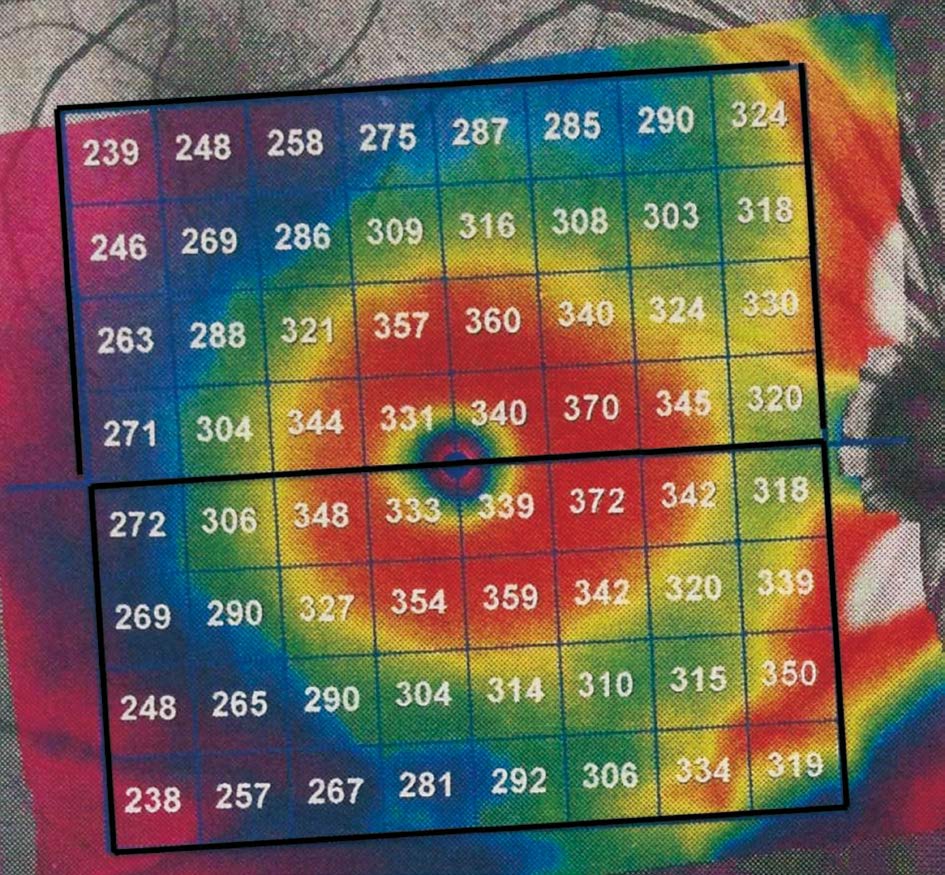
Figure 5 The strategy including both periphery and centre area of the posterior pole map. The whole posterior pole retinal thickness map is divided into superior and inferior zones and absolute retinal thickness difference between superior and inferior is obtained.

Figure 6 ROC curves of strategies excluding or including periphery area.
Table 3 AUROC of different zones
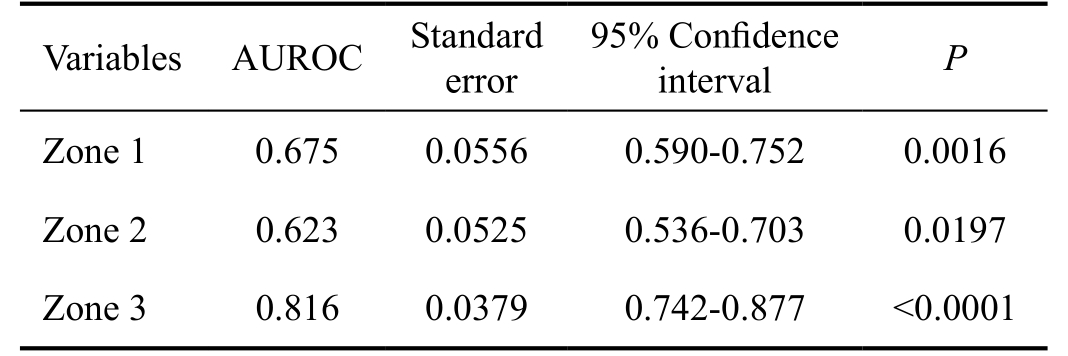
AUROC: Area under the receiver operating characteristic curve.
RTA distribution of each zone in the control group was shown in Figure 2. Among the three zones, zone 2 displayed the highest RTA in healthy population, while there was no significant RTA difference between zone 1 and zone 3. Zone 3 exhibited the lowest mean RTA (3.085 μm) and the minimal standard deviation (1.756), compared to zone 1 (5.988 μm,4.436 μm) and zone 2 (9.753 μm, 7.084 μm). Zone 3 also showed the narrowest 95% CI (from 2.360 to 3.810 μm). The 95% CI of zones 1 and 2 were 4.157 to 7.819 μm, 6.829 to 12.68 μm, respectively (Table 2).
In order to determine whether different stages of glaucoma have a diverse impact on RTA of each zone, we compared RTA of control, mild, moderate and severe glaucoma groups separately, for zones 1, 2 and 3 (Figure 3). The post hoc tests revealed significant RTA difference among control, moderate and severe glaucoma groups in zone 3, while there was no RTA difference between control and mild glaucoma group(Figure 3C). Whereas in zones 1 and 2, RTA values of control,mild and moderate glaucoma groups appeared similar, only severe glaucoma eyes showed distinction when compared to the healthy eyes (Figure 3A, 3B).
To evaluate the glaucoma detecting ability of strategies utilized in different zones, the AUROC were calculated for each zone related strategy (Figure 4A, 4B, 4C; Table 3).The AUROC of zone 3 (0.816) was meaningfully larger than the area of zone 1 (0.675) and 2 (0.623) (Table 4). The three AUROCs were displayed together in Figure 4D, theyellow, green and blue line represented zones 3, 2 and 1,respectively.
Table 4 Comparison of AUROC of strategies utilizing zone 1, 2 and 3

AUROC: Area under the receiver operating characteristic curve.
We finally calculated the absolute retina thickness difference between superior and inferior hemispheres with the data from the same participants and obtained the AUROC of this approach (Figures 5, 6). By comparing it (0.632) with the AUROC of zone 3 (0.8126), we concluded that including the periphery region of the posterior pole map would induce low diagnostic efficiency when interpreting PPAA results.
DISCUSSION
In this study we defined three zones in each hemifield of posterior pole asymmetry map based on previous literature.RTAs between reciprocal area in the superior and inferior hemifield were calculated. RTA in zone 3 showed the minimal mean value, standard deviation and the narrowest 95% CI in healthy population. In zone 3, there is significant RTA difference among control, moderate and severe glaucomatous groups, whereas no difference was found between control and mild glaucoma group. In contrast, significant RTA increases were found only in severe glaucoma eyes in zones 1 and 2.The diagnostic ability of the strategy using zone 3 was stronger than those using zones 1 or 2, and combining the three zones together would decrease the diagnostic efficiency of the PPAA results.
From Figure 2, we can conclude that in a healthy population,RTA of zone 2 seems to physiologically exist while in zones 1 and 3, hemispheric thickness asymmetry is not that apparent. However, it is in zone 3 that RTA appears to be in the narrowest range, according to CI values of different zones.Alluwimi et al[19] proved that in healthy controls, within-eye hemispheric asymmetry analysis could successfully reduce between-subject variability (compared to retina thickness), but only in the centre area (corresponding to our zone 3), rather than other zones (corresponding to zones 1 and 2 in our study).Our results were similar with previous studies. The vascular arches overlapping the periphery regions are believed to induce the wide RTA values distribution, the blood vessels may also have variable patterns and sizes among individuals that has a notable effect on between-subject variability in retinal thickness [19,27].
Figure 5 shows impacts of different stages of glaucoma on RTA in various zones. We can conclude that later-stage glaucoma causes higher RTA, and glaucomatous damage has a partiality for zone 3, rather than zones 1 and 2. It is because glaucoma specifically damages RGCs and RNFLs, and these cells and their nerve fibers distribute sparsely in zones 1 and 2[27]. In early or moderate glaucoma, the periphery damaged RGC number is too limited to bring about RTA changes, whereas in severe glaucoma, the obviously thinning retina caused by large amount of RGC loss would induce significantly altered RTA in these periphery zones. On the contrary, area 3°-9°(equal to zone 3) contains 50% of the RGCs[32], this dense RGC accumulation in zone 3 makes this area vulnerable to glaucomatous damage. Indeed, zone 3 has been believed to be affected by early glaucoma[33-34] and in our study, both moderate and severe glaucoma led to significantly higher RTA than the control group. One thing should be noticed is that detecting RTA of zone 3 is not useful enough for mild glaucoma diagnosis, since mild glaucoma fails to cause RTA changes. In other words, the ability of PPAA for very early glaucoma diagnosis is still limited.
Seo et al[21] reported that the AUROC of PPAA in their study was 0.958±0.013. Rolle et al[23] reported that their AUROC ranged from 0.70 to 0.82[24]. In our research, the largest AUROC is 0.817±0.04, which was similar to Rolle’s study. The instability among these results is most likely to be caused by the different participant inclusion criterion. In Seo et al’s[21] study, only glaucoma patients with localized RNFL defects shown in redfree RNFL photography, which were limited to one hemifield,were enrolled. In other words, the participants in patient group already contained apparent retinal thickness asymmetry.This may explain why investigators got such high AUROC.Another possibility is that our interpretation method, which focuses on the central part of the posterior pole map, shows inferior ability to detect glaucoma than the previous whole 64-grid map-based strategy. Our Figures 5, 6 toppled this guess. As described above, we compared the AUROC of two interpretation methods. One included periphery area (Figure 5),while the other one excluded the periphery area (corresponding to zone 3). Data showed that making use of the whole PPAA map could lead to decreased diagnostic ability (Figure 6).
We separately obtained the AUROC of zones 1, 2 and 3.By placing three ROCs in one figure, we simply found that interpreting PPAA with zone 3 appeared the most promising in glaucoma diagnosis. These results are predictable since only in zone 3, meaningful RTA difference existed among control,moderate and severe glaucoma groups. However, we have to keep in mind that the modified interpreting strategy is still unable to efficiently distinguish mild glaucoma patients.
Structural changes in patients with glaucoma have an essential role in clinical diagnosis. OCT has been widely used to image structural features of glaucoma with a variety of imaging options. RNFL thickness has been extensively investigated using OCT, but RNFL measurements have limitations that introduce substantial challenges in clinical decision-making[19].
Our study showed that strategy utilized in central PPAA had good diagnostic power and modified PPAA interpreting method may serve as an assessment tool in early glaucoma detection. Thus, PPAA of OCT is of value in clinical decisionmaking. Further investigation is needed to compare the diagnostic capability of center area RTA with other parameters,including RNFL thickness.
Jacobsen et al[26] reported physiological hemispheric asymmetries in retinal thickness, and his research showed that the highest local asymmetries were in the nasal corners of macula. Alluwimi et al[19] reported that RTA successfully reduced between-subject variability (compared to absolute retina thickness) in posterior pole central area, while combining all of the zones together (the whole posterior pole map) produced high between-subject RTA variability in normal populations. These investigators suggested serious consideration to PPAA periphery area. In our study, we did get the similar results. High variability was found in healthy periphery RTA, and including this area decreased the diagnostic power of PPAA. However, the central zone RTA shows low between-subject variability and satisfactory diagnostic capability. In other words, the strategy utilized in center zone could overcome the limitations of original PPAA results.
In conclusion, RTA in macular central area shows low between-subject variability and good diagnostic capability.Utilizing the whole map to interpret PPAA results would lead to low diagnostic efficiency. Our new strategies which exclude the periphery area are necessary for PPAA printouts interpretation.
ACKNOWLEDGEMENTS
We would like to thank the patients for their collaboration. We are grateful to the technical staff at Western China Hospital of Sichuan University for their assistance.
Foundations: Supported by National Natural Science Foundation of China (No.81270993); National Major Scientific Equipment Program (No.2012YQ12008005); the Specialized Research Fund for the Doctoral Program of Higher Education(No.20130181110079).
Conflicts of Interest: Zhang Y, None; Li N, None; Chen J,None; Wei H, None; Jiang SM, None; Chen XM, None.
REFERENCES
1 Ajtony C, Balla Z, Somoskeoy S, Kovacs B. Relationship between visual field sensitivity and retinal nerve fiber layer thickness as measured by optical coherence tomography. Invest Ophthalmol Vis Sci 2007;48(1):258-263.
2 Chien JL, Ghassibi MP, Patthanathamrongkasem T, Abumasmah R, Rosman MS, Skaat A, Tello C, Liebmann JM, Ritch R, Park SC.Glaucoma diagnostic capability of global and regional measurements of isolated ganglion cell layer and inner plexiform layer. J Glaucoma 2017;26(3):208-215.
3 Ghassibi MP, Chien JL, Patthanathamrongkasem T, Abumasmah RK, Rosman MS, Skaat A, Tello C, Liebmann JM, Ritch R, Park SC.Glaucoma diagnostic capability of circumpapillary retinal nerve fiber layer thickness in circle scans with different diameters. J Glaucoma 2017;26(4):335-342.
4 Fatehi N, Nowroozizadeh S, Henry S, Coleman AL, Caprioli J, Nouri-Mahdavi K. Association of structural and functional measures with contrast sensitivity in glaucoma. Am J Ophthalmol 2017;178:129-139.
5 Kita Y, Soutome N, Horie D, Kita R, Hollo G. Circumpapillary ganglion cell complex thickness to diagnose glaucoma: a pilot study. Indian J Ophthalmol 2017;65(1):41-47.
6 Yang H, Reynaud J, Lockwood H, Williams G, Hardin C, Reyes L,Stowell C, Gardiner SK, Burgoyne CF. The connective tissue phenotype of glaucomatous cupping in the monkey eye-clinical and research implications. Prog Retin Eye Res 2017;59:1-52.
7 Rao HL, Pradhan ZS, Weinreb RN, Riyazuddin M, Dasari S, Venugopal JP, Puttaiah NK, Rao DA, Devi S, Mansouri K, Webers CA. A comparison of the diagnostic ability of vessel density and structural measurements of optical coherence tomography in primary open angle glaucoma. PLoS One 2017;12(3):e0173930.
8 Sacconi R, Deotto N, Merz T, Morbio R, Casati S, Marchini G. SDOCT choroidal thickness in advanced primary open-angle glaucoma. J Glaucoma 2017;26(6):523-527.
9 Fan KC, Tsikata E, Khoueir Z, Simavli H, Guo R, de Luna RA, Pandit S, Que CJ, de Boer JF, Chen TC. Enhanced diagnostic capability for glaucoma of 3-dimensional versus 2-dimensional neuroretinal rim parameters using spectral domain optical coherence tomography. J Glaucoma 2017;26(5):450-458.
10 Yarmohammadi A, Zangwill LM, Diniz-Filho A, Saunders LJ,Suh MH, Wu Z, Manalastas PI, Akagi T, Medeiros FA, Weinreb RN.Peripapillary and macular vessel density in patients with glaucoma and single-hemifield visual field defect. Ophthalmology 2017;124(5):709-719.
11 Mari JM, Aung T, Cheng CY, Strouthidis NG, Girard MJ. A digital staining algorithm for optical coherence tomography images of the optic nerve head. Transl Vis Sci Technol 2017;6(1):8.
12 Brazerol J, Iliev ME, Hohn R, Frankl S, Grabe H, Abegg M. Retrograde maculopathy in patients with glaucoma. J Glaucoma 2017;26(5):423-429.
13 Chen Q, Huang S, Ma Q, Lin H, Pan M, Liu X, Lu F, Shen M. Ultrahigh resolution profiles of macular intra-retinal layer thicknesses and associations with visual field defects in primary open angle glaucoma. Sci Rep 2017;7:41100.
14 Shin JW, Seong M, Lee JW, Hong EH, Uhm KB. Diagnostic ability of retinal nerve fiber layer thickness deviation map for localized and diffuse retinal nerve fiber layer defects. J Ophthalmol 2017;2017:8365090.
15 Hua R, Gangwani R, Guo L, McGhee S, Ma X, Li J, Yao K. Detection of preperimetric glaucoma using Bruch membrane opening, neural canal and posterior pole asymmetry analysis of optical coherence tomography.Sci Rep 2016;6:21743.
16 Dave P, Shah J. Diagnostic accuracy of posterior pole asymmetry analysis parameters of spectralis optical coherence tomography in detecting early unilateral glaucoma. Indian J Ophthalmol 2015;63(11):837-842.
17 Khanal S, Davey PG, Racette L, Thapa M. Intraeye retinal nerve fiber layer and macular thickness asymmetry measurements for the discrimination of primary open-angle glaucoma and normal tension glaucoma. J Optom 2016;9(2):118-125.
18 Kim JM, Sung KR, Yoo YC, Kim CY. Point-wise relationships between visual field sensitivity and macular thickness determined by spectral-domain optical coherence tomography. Curr Eye Res 2013;38(8):894-901.
19 Alluwimi MS, Swanson WH, Malinovsky VE. Between-subject variability in asymmetry analysis of macular thickness. Optom Vision Sci 2014;91(5):484-490.
20 Asman P, Heijl A. Glaucoma hemifield test. Automated visual field evaluation. Arch Ophthalmol 1992;110(6):812-819.
21 Seo JH, Kim TW, Weinreb RN, Park KH, Kim SH, Kim DM.Detection of localized retinal nerve fiber layer defects with posterior pole asymmetry analysis of spectral domain optical coherence tomography.Invest Ophthalmol Vis Sci 2012;53(8):4347-4353.
22 Um TW, Sung KR, Wollstein G, Yun SC, Na JH, Schuman JS.Asymmetry in hemifield macular thickness as an early indicator of glaucomatous change. Invest Ophthalmol Vis Sci 2012;53(3):1139-1144.
23 Rolle T, Manerba L, Lanzafame P, Grignolo FM. Diagnostic power of macular retinal thickness analysis and structure-function relationship in glaucoma diagnosis using SPECTRALIS OCT. Curr Eye Res 2016;41(5):667-675.
24 Hood DC, Fortune B, Arthur SN, Xing D, Salant JA, Ritch R,Liebmann JM. Blood vessel contributions to retinal nerve fiber layer thickness profiles measured with optical coherence tomography. J Glaucoma 2008;17(7):519-528.
25 Greenfield DS, Bagga H, Knighton RW. Macular thickness changes in glaucomatous optic neuropathy detected using optical coherence tomography. Arch Ophthalmol 2003;121(1):41-46.
26 Jacobsen AG, Bendtsen MD, Vorum H, Bogsted M, Hargitai J. Normal value ranges for central retinal thickness asymmetry in healthy caucasian adults measured by SPECTRALIS SD-OCT posterior pole asymmetry analysis. Invest Ophthalmol Vis Sci 2015;56(6):3875-3882.
27 Hood DC, Raza AS, de Moraes CG, Liebmann JM, Ritch R.Glaucomatous damage of the macula. Prog Retin Eye Res 2013;32:1-21.28 Curcio CA, Allen KA. Topography of ganglion cells in human retina. J Comp Neurol 1990;300(1):5-25.
29 Jaffe GJ, Caprioli J. Optical coherence tomography to detect and manage retinal disease and glaucoma. Am J Ophthalmol 2004;137(1):156-169.
30 Morales J, Weitzman ML, Gonzalez de la Rosa M. Comparison between Tendency-Oriented Perimetry (TOP) and octopus threshold perimetry. Ophthalmology 2000;107(1):134-142.
31 Guedes V, Schuman JS, Hertzmark E, Wollstein G, Correnti A,Mancini R, Lederer D, Voskanian S, Velazquez L, Pakter HM, Pedut-Kloizman T, Fujimoto JG, Mattox C. Optical coherence tomography measurement of macular and nerve fiber layer thickness in normal and glaucomatous human eyes. Ophthalmology 2003;110(1):177-189.
32 Nicholas SP, Werner EB. Location of early glaucomatous visual field defects. Can J Ophthalmol 1980;15(3):131-133.
33 Anctil JL, Anderson DR. Early foveal involvement and generalized depression of the visual field in glaucoma. Arch Ophthalmol 1984;102(3):363-370.
34 Heijl A, Lundqvist L. The frequency distribution of earliest glaucomatous visual field defects documented by automatic perimetry.Acta Ophthalmol (Copenh) 1984;62(4):658-664.