INTRODUCTION
Graves’ ophthalmopathy (GO) is the most common orbital disorder affecting between 25%-50% of patients with Graves’ disease. It is clinically characterized, in its moderatesevere form, by enlargement of the extra-ocular muscles(EOM) and by an enlarged orbital fat compartment resulting from a complex interaction between orbital fibroblasts,autoantibodies, immune cells, genetics and environmental factors[1]. Orbital compression seems to be sustained by thyroid-stimulating auto-antibodies that mimic the effect of thyrotropin. The orbital fibroblasts, through the thyrotropin receptor autoantigen (TSHR), differentiate into adipocytes thereby increasing the amount of adipose tissue in the orbit,which, in turn, increases TSHR expression[2]. Approximately 28% of GO cases present limited EOM motility associated to diplopia, exposure keratopathy, and optic neuropathy[3].
Moreover, EOM involvement produces orbital congestion of the superior ophthalmic vein and a crowded orbital apex,which leads to optic nerve compression[4].
Optic nerve compression is a common finding in patients affected by GO[5-9]. Its diagnosis is based on reduced mean perimetric sensitivities, visual field defects, changes in transverse echographic optic nerve diameters, tomographic damage of the retinal nerve fiber layer (RNFL) and of the ganglion cell complex (GCC; RNFL+ganglion cell layer +inner plexiform layer), even without changes in visual acuity in the early stages of the disease[10]. The lamina cribrosa(LC) is considered the cause of retinal ganglion cell axon damage. The net of LC separates the subarachnoid space(SAS) from the intraocular space, and is exposed to the differential translaminar pressure that exists across the two compartments, which contain cerebrospinal fluid (CSF) and aqueous humor, respectively. Elevated trans-lamina cribrosa pressure is associated to functional and anatomical optic nerve damage[11]. Given the same level of intraocular pressure,patients with elevated CSF pressure are protected against optic nerve damage, unlike patients with a low CSF pressure[12]. Our hypothesis is that in GO, the orbital apex compression reduces the CSF pressure in the retrobulbar space, thereby increasing the trans-laminar pressure that may induce morphological changes of the lamina cribrosa and consequent damage of the RNFL and GCC.
The aims of this study were to determine the morphological changes of the LC in patients affected by GO, and the functional and anatomical changes in patients affect by optic nerve compression. We also compared the findings of these patients with those obtained from 20 age-matched controls in order to investigate the most precocious signs of optic nerve damage.
SUBJECTS AND METHODS
Study Design Prospective cross-sectional study of 35 consecutive eyes affected by GO. We selected 21 eyes with optic nerve compression and compared them with18 healthy age-matched eyes. All investigations and examinations conformed with the tenets of the Declaration of Helsinki 2013.The study was also approved by the Institutional Review Board Committee of the University of Naples “Federico II”.
Participants A consecutive series of 21 eyes with diagnosis of optic nerve compression secondary to Graves’ disease were enrolled in the study. The status of the disease was evaluated with a modified version of the clinical activity score (CAS)[13-14].To be enrolled in the study, patients had to be euthyroid for at least 3mo during methimazole therapy with inactive phase of ophthalmopathy (CAS <2).
Graves’ ophthalmology was confirmed by computerized tomography, magnetic resonance imaging, and by increased thickness of the 4 EOM (superior, inferior, medial and lateral rectus) in zone IV (thickening of the muscle belly) at A-scan measurement. The study was conducted at the Department of Neurosciences, Reproductive Sciences and Dentistry, of the University of Naples “Federico II”. After receiving a detailed explanation of the study, patients underwent a comprehensive ophthalmologic examination. Informed consent was obtained from all participants. Exclusion criteria included eyes with preexisting retinal or optic nerve disease, intraocular pressure above 18 mm Hg, media opacity, diabetes mellitus or intraocular surgery performed less than three months earlier.The following items were measured: best-corrected VA(BCVA), intraocular pressure, visual field, SD-OCT of macula area and optic nerve, A-scan measure of EOM and optic nerve.
Functional Measurements
Visual acuity The BCVA was measured with Early Treatment Diabetic Retinopathy Study charts, and analyzed by logarithm of the minimum angle of resolution (logMAR).
Visual field Static perimetry was performed with the Humphrey automated perimeter (Humphrey Instruments, Inc.,Zeiss Humphrey, San Leandro, CA, USA) using the SITA 30-2 protocol with stimulus size III. For statistical analysis we took into account the mean deviation (MD) and pattern standard deviation (PSD). Mean deviation is the average differences versus age-matched normal eyes; the more negative the MD,the worse the visual field loss. Pattern standard deviation(PSD) is a measure of non-uniformity of visual field; the more positive the PSD, the more irregular is the visual field.
Tomographic Measurements The SD-OCT images were acquired with the Heidelberg Spectralis tracking laser tomography (Heidelberg Engineering, Carlsbad, CA, USA)for imaging of LC thickness, the LC area with enhance depth image mode. Spectralis OCT works by emitting a diode light with a wavelength of 870 nm through a dual beam SD-OCT and confocal laser scanning ophthalmoscope, and an infrared scan to simultaneously provide retinal images. The SD-OCT RTVue-100 (Optovue Inc., Fremont, CA, USA) was used to measure the RNFL and GCC parameters. This instrument uses a superluminescent diode with a wavelength of 840 nm. It can collect 26 000 A-scans per second with an axial resolution of 5 μm.
Lamina Cribrosa Thickness and Area The EDI OCT B-scans of the optic nerve head was scanned for 20-degrees by a 6-mm line (512 A-scans) with an interval of 50 µm. Thirty-five scan-frames were produced for each cross-sectional B-scan.The edges of the LC were measured from the line where the highly reflective region started to the line where itended. We delimitated the anterior and posterior laminar border between 2 horizontal lines. Lamina cribrosa thickness was defined as the distance between two points on the vertical line going through the center of the optic nerve that perpendicularly crosses the 2 previously drawn horizontal lines[15]. The anterior surface of the LC was measured on confocal scanning laser ophthalmoscopy images of the anterior laminar surface with improved contrast. The area was measured when the confocal scanning laser ophthalmoscopy image of the optic nerve was located on the LC pores in order to better identify the edges of the anterior surface of the LC[16].
The optic nerve head map protocol was used to obtain RNFL and GCC data. The thickness map was measured around a 3.45-mm-diameter circle centered on the optic disc. The macular region contains more than 50% of all retinal ganglion cells, therefore it is an ideal region on which to identify early cell loss over time. We recorded the average RNFL and GCC thicknesses[17].
A-scan Measurements Echographic measurements were obtained with an A-scan standardized echograph (Cine Scan S, Quantel Medical SA, Le Brezet, France) and with an 8 mHz probe. The transverse optic nerve diameter (arachnoidarachnoid) was measured at its passage through the orbital apex. The 30-degree test was performed to differentiate between the dry and wet optic nerve[7-8]. In this test the optic nerve is measured by A-scan in primary gaze (wet optic nerve)and then re-measured after the patient abducts the eye about 30 degrees after 3min of exercise (dry optic nerve). This exercise forces the CSF out of the SAS, so that the optic nerve is “dry”(the diameter is reduced). Three minutes later, the optic nerve is measured under normal conditions with the gaze at 0°, and returns to being “wet” (same diameters as baseline, with the CSF in the SAS) whereas under optic nerve compression, the CSF slowly returns to the SAS due to the compression at the orbit apex, therefore the arachnoid-arachonid diameter remains reduced and the optic nerve is “dry”.
Statistical Analysis We performed the non-parametric Kruskal-Wallis 1-way test of variance for parameters not normally distributed for comparisons between the optic nerve compression group and control group. Student t test was used for normally distributed parameters. We performed regression analysis to compare functional measures [BCVA and visual field (VF)], tomographic findings (LC area, LC thickness, RNFL and the GCC), and ultrasound A-scan measures(optic nerve measurements) were performed to correlate functional and anatomical measures. P≤0.05 denoted statistical significance. All analyses were conducted using the SPSS software version 3.1 (SPSS Inc., Chicago, IL, USA).
RESULTS
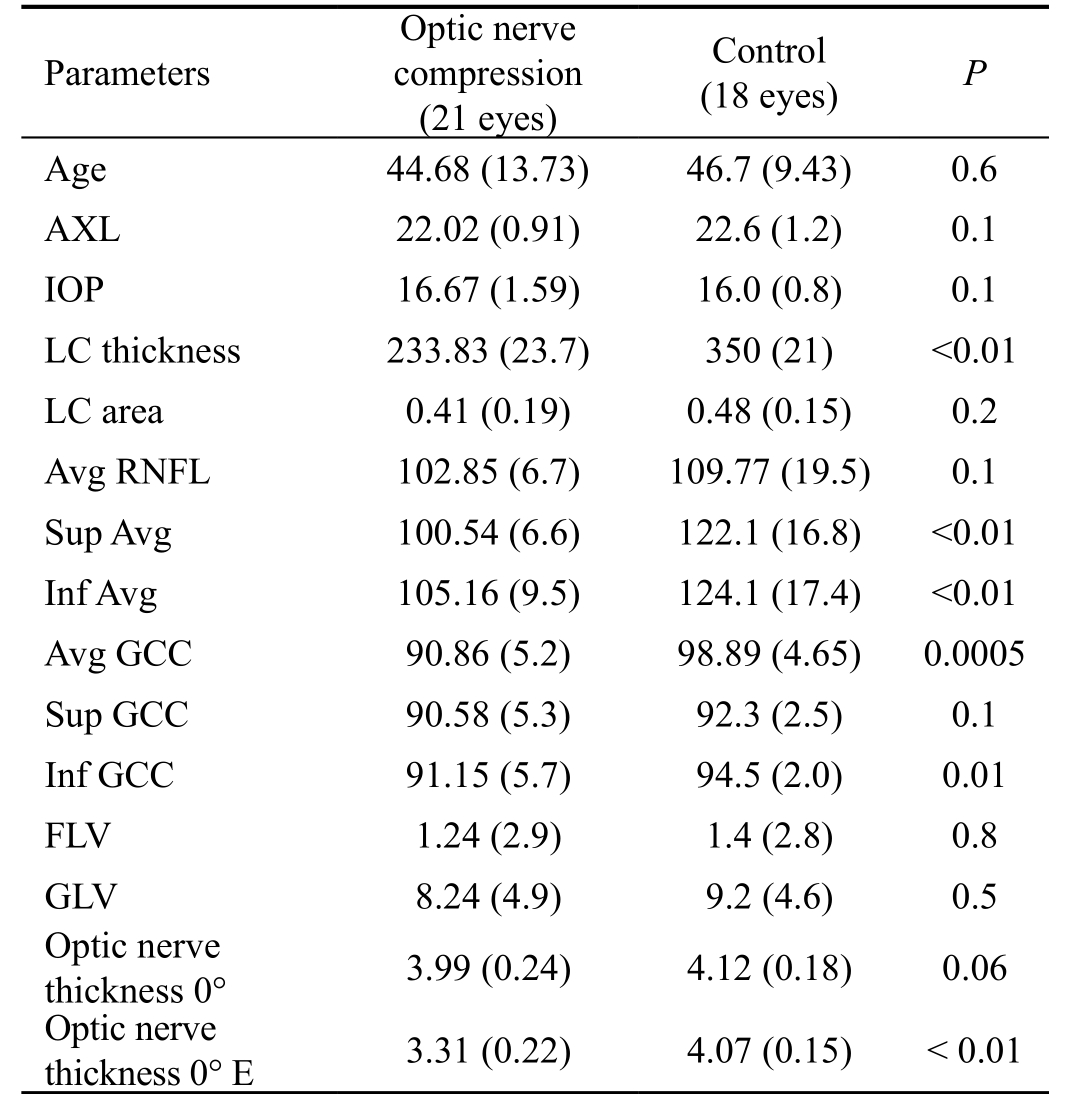
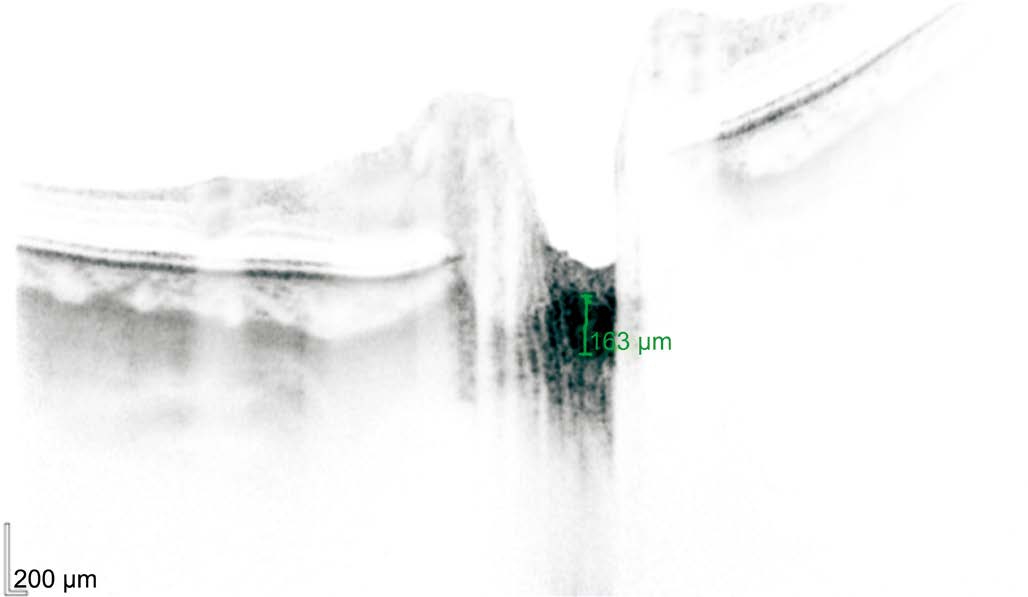
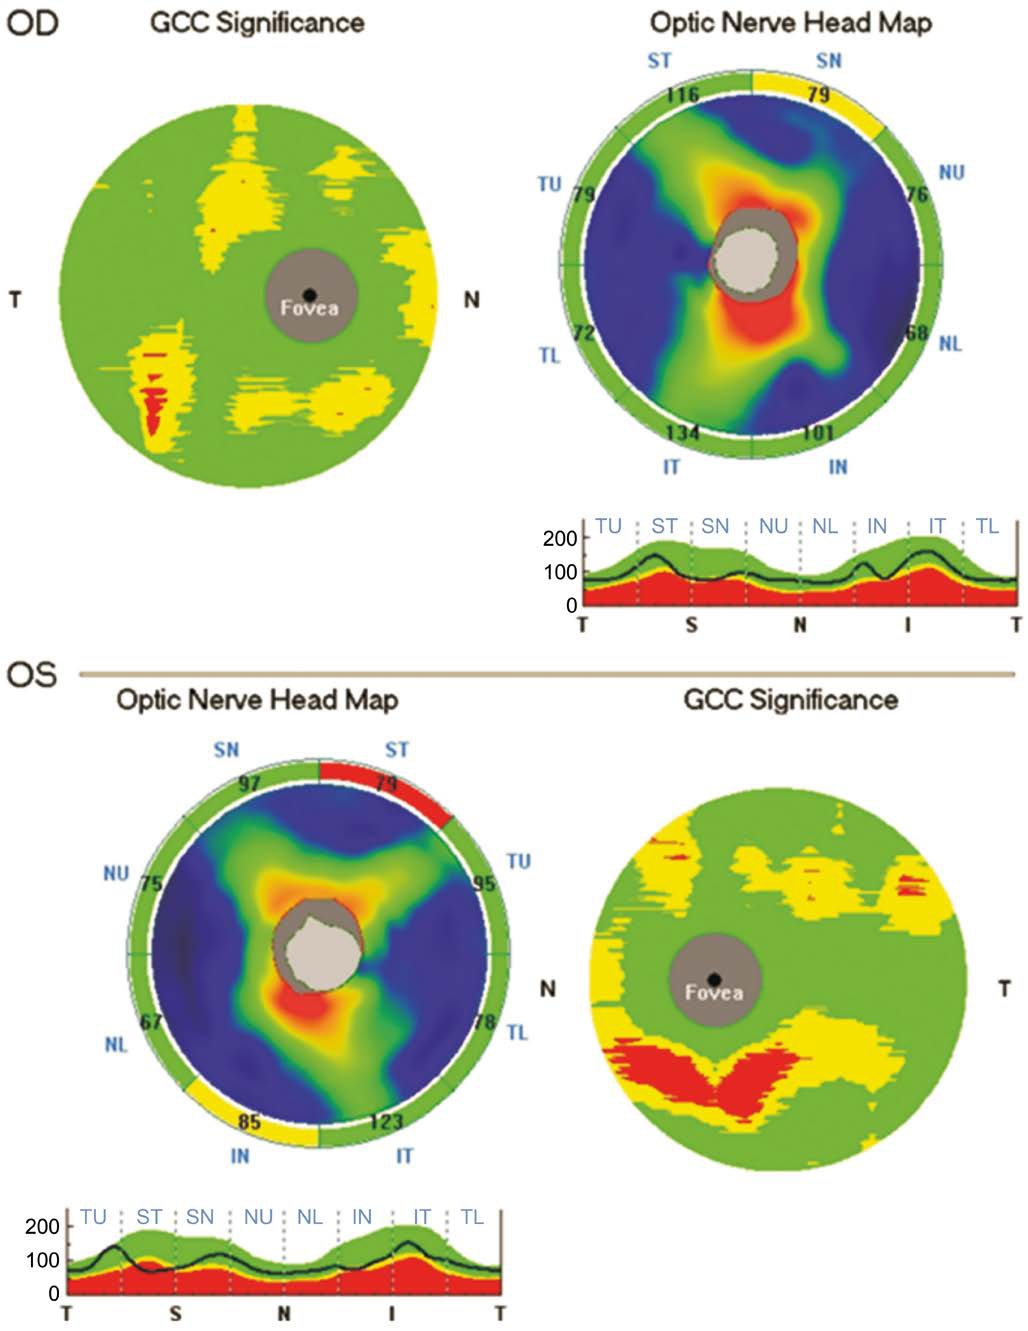
Tomographic Outcomes As shown in Table 1, the mean LC area did not differ significantly between the optic nerve compression group and the control group 0.41 mm2 (SD 0.19)and 0.48 mm2 (SD 0.15), respectively. The difference between the groups was not statistically different (P=0.2). The LC thickness was significantly lower (P≤0.01) in the optic nerve compression group, 233.83 µm (SD 23.7) than in the control,350 µm (SD 21) (Figure 1). The average of GCC (including the RNFL, ganglion cell layer and inner plexiform layer) was significant lower (P=0.0005) in the optic nerve compression group, 90.86 µm (SD 5.2) than in the control, 98.89 µm (SD 4.65), whereas neither the foveal loss volume (FLV) nor the global loss volume (GLV) differed between the optic nerve compression and control group: FVL [1.24 (2.9) vs 1.4 (2.8),P=0.8], and GLV [8.24 (4.9) vs 9.2 (4.6), P=0.5]. The average RNFL thickness was lower, albeit not significantly so, in the optic nerve compression group [102.85 µm (SD 6.7)] than in the control group [109.77 µm (SD 19.5)], and the difference was not statistically different (P=0.1) (Figure 2).
We also recorded the dynamics of SAS including the measure at 0° in primary position, and again at 0° in primary position after three minutes exercise at 30°.
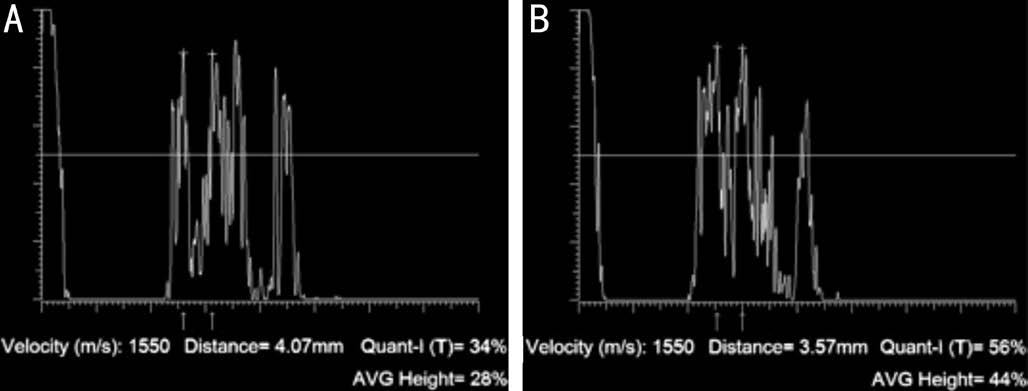
At baseline, the optic nerve diameters in primary gaze did not differ between the two groups, i.e. 3.99 mm (SD 0.24) vs 4.12 mm (SD 0.18), P=0.06, whereas it was significantly (P<0.01) reduced in the optic nerve compression group, namely 3.31 mm (SD 0.22) vs control 4.07 mm (SD 0.15) after the 30-degree test, showing optic nerve compression at the orbit apex (Figure 3).
Functional Outcomes The BCVA was respectively 0.85 (0.15)logMAR and 1.0 (0.1) logMAR in optic nerve compression group and controls group. The difference of MD was statistically different between the groups -1.60 (1.0) vs 0.08 (1.13);P=0.001. The PSD was statistically (P=0.001) higher in optic nerve compression group 2.2 (SD 0.8) compared with control group 1.42 (SD 0.6).
Table 1 Comparison of anatomical outcomes between patients of optic nerve compression group and control group

AXL: Axial length; IOP: Intraocular pressure; LC: Lamina cribrosa;RNFL: Retinal nerve fiber layer; GCC: Ganglion cell complex; FLV:Focal loss volume; GLV: Global loss volume.

Figure 1 An SD-OCT image, acquired with enhanced depth imaging, showing a reduction of thickness of LC in the optic nerve compression group The LC thickness in this patient was 163 microns.
As shown in Table 2, significant correlations were identified between BCVA and respectively the LC area (R=-0.6;P=0.025), LC thickness (R=0.49; P=0.09), and average GCC (R=0.6; P=0.03). Moreover, LC area was significantly correlated to LC thickness (R=-0.6; P=0.03).
DISCUSSION

Figure 2 The optic nerve head map protocol reported a reduction of the retinal nerve fiber layer and ganglion cell complex in a patient affected by optic nerve compression.

Figure 3 An optic nerve diameter (arachnoid-archnoid, 4.07 mm)in primary position at 0° gaze (A) and after the 30-degree test (B)Note the reduction of the subarachnoidal (3.57 mm) space caused by optic nerve compression at the orbital apex.
The lamina cribrosa, which lies at the base of the optic cup, a is a collagenous beam structure characterized by pores through which the ganglion cell axons and retinal blood vessels go beyond. It is the principal site of ganglion cell axon injury in patients affected by optic nerve damage secondary to glaucoma[18], as the macular ganglion cell analysis showed a good ability to detect early glaucoma changes[19]. Thanks to advances in imaging technology, it is now possible to examine the LC in vivo. In particular, EDI SD-OCT produces cross-sectional images of the LC including the posterior and anterior LC surface with laminar pores even below the neuroretinal rim. Lamina cribrosa imaging with EDI OCT was reported to be significantly more reliable and have a better interobserver and inter-visit reproducibility than standard imaging procedures[15]. Recently, LC defects have been associated with glaucomatous visual field progression; in fact, the visual field progression rate was significantly faster in eyes with focal LC defects that in eyes without focal LC defects (P=0.009)[20].
Table 2 Correlation between anatomical and functional findings in patients affected by optic nerve compression

BCVA: Best corrected visual acuity; AVG: Average; RNFL: Retinal nerve fiber layer; GCC: Ganglion cell complex; LC: Lamina cribrosa.
Although the LC imaging has been described as a useful diagnostic tool, even more than peripapillary RNFL thicknesses,for diagnosis of NTG, especially in early glaucomatous changes[21].The LC has become a landmark of interest consequent to the finding that CSF pressure is involved in the pathogenesis of various eye diseases. As a thin anatomical area, LC undergoes to a differential pressure (translaminar pressure gradient)separating two differentially pressurized compartments such the orbital SAS (where is present the CSF) and the intraocular space. The CSF pressure largely is responsible for retrolaminar tissue pressure acting on LC independently from IOP[22].The early morphological changes of glaucomatous cupping includes posterior migration of LC insertion into the sclera and collapse and thinning of LC[21]. Morphology changes of LC are described in primary open angle glaucoma (POAG)and in NTG showing that the structural changes of LC are not induced just by a mechanical stress of IOP[15]. Park et al[15]reported that LC thickness was significantly thinner in NTG and in POAG eyes than in the control group, and even thinner in presence of disc hemorrhage. It has been also reported that in pathologic myopia the LC is anatomically thinner than in ametropic eyes and therefore more susceptible to CSFP with increased translaminar pressure gradient. This finding may also explain the increased risk of optic nerve damage in highly myopic eyes.
In our GO patients, the average RNFL thickness was greater in the inferior quadrant (105.16 μm) than in the superior quadrant(100.54 μm). This finding is in accordance with a recent study by Danesh-Meyer et al[24], devoted to the differentiation between compressive and glaucomatous optic neuropathy; in fact they found that the inferior RNFL average thickness was thinner than the superior RNFL average thickness in the open-angle glaucoma group (77.2 vs 89.5 μm), whereas the opposite occurred in the compressive optic neuropathy group (81.5 vs 81.1). In our study, also the GCC were thicker in the inferior(91.15 μm) than in the superior quadrant (90.58 μm). In addition, in 5 out of 21 eyes (24%) the RNFL average thickness was thinner in the inferior than in the superior quadrant, as reported for glaucomatous eyes. Taken together, the above findings support the hypothesis that both compressive and glaucomatous damage is present in the early phases of GO. We suggest that swelling of the EOM belly induces optic nerve at the orbitapex. This compression exerts a “valve effect” on SAS. Ocular movements empty the SAS from the CSF thereby leading to a “dry” optic nerve, which, as shown by A-scan,results in smaller diameter. In the presence of compression,the CFS slowly flow back into the SAS leading to a reduced CSF pressure, which in turn, alters translaminar pressure.In this context, Jonas et al[23], based on population of 3468 individuals of the Beijing Eye Study 2011, found that the translaminar pressure gradient was better correlated than IOP with glaucoma markers[24], The authors calculated the CSF pressure as follows: CSF pressure=0.44×Body Mass Index(kg/m2)+0.16×Diastolic Blood Pressure (mm Hg) - 0.18×Age(y) - 1.91. The translaminar pressure was calculated as the difference between IOP and CSF pressure[25].
In our study the reduced CSF pressure was confirmed by the positive 30 degrees test, measuring the A-scan arachonoidarachnoid spikes. The reduction of CSF pressure was due to the orbital apex compression induced by EOM swelling. The EOMs of GO patients are the preferred target of inflammation that most often induces changes in reflectivity, structure, and thickness of orbital muscle. The consequences include apical compression on the SAS at the orbital apex that reduces the CSF pressure in the retrolaminar space[26].
In line with previous studies[7-8], we also found that, in patients affected by GO with optic nerve compression, the reduction of SAS and LC morphology were correlated with damage of GCC and RNFL. Such changes are detectable with EDI SDOCT. We believe that LC morphology and GCC and RNFL thicknesses could be useful diagnostic tools for the early detection of optic nerve damage induced by GO. Furthermore,morphologically detectable changes of LC may precede clinically significant functional damage.
ACKNOWLEDGEMENTS
We thank Jean Ann Gilder (Scientific Communication srl.,Naples, Italy) for editing this article.
Conflicts of Interest: Romano MR, None; Cennamo G,None; Breve MA, None; Piedepalumbo M, None; Iovino C,None; Velotti N, None; Cennamo G, None.
REFERENCES
1 Garrity JA, Bahn RS. Pathogenesis of graves ophthalmopathy:implications for prediction, prevention, and treatment. Am J Ophthalmol 2006;142(1):147-153.e2.
2 Smith TJ, Koumas L, Gagnon A, Bell A, Sempowski GD, Phipps RP,Sorisky A. Orbital fibroblast heterogeneity may determine the clinical presentation of thyroid-associated ophthalmopathy. J Clin Endocrinol Metab 2002;87(1):385-392.
3 Prummel MF, Bakker A, Wiersinga WM, Baldeschi L, Mourits MP,Kendall-Taylor P, Perros P, Neoh C, Dickinson AJ, Lazarus JH, Lane CM, Heufelder AE, Kahaly GJ, Pitz S, Orgiazzi J, Hullo A, Pinchera A, Marcocci C, Sartini MS, Rocchi R, Nardi M, Krassas GE, Halkias A. Multi-center study on the characteristics and treatment strategies of patients with Graves’ orbitopathy: the first European Group on Graves’Orbitopathy experience. Eur J Endocrinol 2003;148(5):491-495.
4 Kuriyan AE, Phipps RP, Feldon SE. The eye and thyroid disease. Curr Opin Ophthalmol 2008;19(6):499-506.
5 Haritoglou C, Herzum H, Ehrt O, Ossoinig KC, Kampik A. Echographic differential diagnosis of optic nerve widening. Ophthalmologe 2002;99(7):559-565.
6 Hershewe GL, Corbett JJ, Ossoinig KC, Thompson HS. Optic nerve compression from a basal encephalocele. J Neuroophthalmol 1995;15(3):161-165.
7 Ossoinig KC. The role of standardized echography in Graves’ disease.Acta Ophthalmologica 2009;70(S204):81-81.
8 Ossoinig KC. The role of standardized ophthalmic echography in the management of Graves’ ophthalmopathy. Dev Ophthalmol 1989;20:28-37.
9 Ossoinig KC. A new echographic sign for the reliable diagnosis of graves’disease (author’s transl). Klin Monbl Augenheilkd 1982;180(3):189-197.
10 Salgarello T, Tamburrelli C, Falsini B, Giudiceandrea A, Colotto A.Optic nerve diameters and perimetric thresholds in idiopathic intracranial hypertension. Br J Ophthalmol 1996;80(6):509-514.
11 Ren R, Wang N, Li B, Li L, Gao F, Xu X, Jonas JB. Lamina cribrosa and peripapillary sclera histomorphometry in normal and advanced glaucomatous Chinese eyes with various axial length. Invest Ophthalmol Vis Sci 2009;50(5):2175-2184.
12 Fleischman D, Allingham RR. The role of cerebrospinal fluid pressure in glaucoma and other ophthalmic diseases: A review. Saudi J Ophthalmol 2013;27(2):97-106.
13 Mourits MP, Prummel MF, Wiersinga WM, Koornneef L. Clinical activity score as a guide in the management of patients with Graves’ophthalmopathy. Clin Endocrinol(Oxf) 1997;47(1):9-14.
14 Bartalena L, Pinchera A, Marcocci C. Management of Graves’ophthalmopathy: reality and perspectives. Endocr Rev 2000;21(2):168-199.
15 Park HY, Jeon SH, Park CK. Enhanced depth imaging detects lamina cribrosa thickness differences in normal tension glaucoma and primary open-angle glaucoma. Ophthalmology 2012;119(1):10-20.
16 Park SC, Ritch R. High resolution in vivo imaging of the lamina cribrosa. Saudi J Ophthalmol 2011;25(4):363-372.
17 Leung CK. Diagnosing glaucoma progression with optical coherence tomography. Curr Opin Ophthalmol 2014;25(2):104-111.
18 Sigal IA, Grimm JL, Jan NJ, Reid K, Minckler DS, Brown DJ. Eyespecific IOP-induced displacements and deformations of human lamina cribrosa. Invest Ophthalmol Vis Sci 2014;55(1):1-15.
19 Hwang YH, Jeong YC, Kim HK, Sohn YH. Macular ganglion cell analysis for early detection of glaucoma. Ophthalmology 2014;121(8):1508-1515.
20 Faridi OS, Park SC, Kabadi R, Su D, De Moraes CG, Liebmann JM,Ritch R. Effect of focal lamina cribrosa defect on glaucomatous visual field progression. Ophthalmology 2014;121(8):1524-1530.
21 Park HY, Park CK. Diagnostic capability of lamina cribrosa thickness by enhanced depth imaging and factors affecting thickness in patients with glaucoma. Ophthalmology 2013;120(4):745-752.
22 Morgan WH, Yu DY, Cooper RL, Alder VA, Cringle SJ, Constable IJ.The influence of cerebrospinal fluid pressure on the lamina cribrosa tissue pressure gradient. Invest Ophthalmol Vis Sci 1995;36(6):1163-1172.
23 Jonas JB, Berenshtein E, Holbach L. Lamina cribrosa thickness and spatial relationships between intraocular space and cerebrospinal fluid space in highly myopic eyes. Invest Ophthalmol Vis Sci 2004;45(8):2660-2665.
24 Danesh-Meyer HV, Yap J, Frampton C, Savino PJ. Differentiation of compressive from glaucomatous optic neuropathy with spectral-domain optical coherence tomography. Ophthalmology 2014;121(8):1516-1523.
25 Jonas JB, Wang NL, Wang YX, You QS, Xie XB, Yang DY, Xu L.Estimated trans-lamina cribrosa pressure difference versus intraocular pressure as biomarker for open-angle glaucoma. The Beijing Eye Study 2011. Acta Ophthalmologica 2014;93(1):e7-e13.
26 Volpe NJ, Sbarbaro JA, Gendron Livingston K, Galetta SL, Liu GT, Balcer LJ. Occult thyroid eye disease in patients with unexplained ocular misalignment identified by standardized orbital echography. Am J Ophthalmol 2006;142(1):75-81.