INTRODUCTION
Glaucoma is a potentially blinding illness that gradually and progressively damages the retinal ganglion cells(RGC)[1]. It is known that the gold standard for diagnosing glaucoma is standard automated perimetry (SAP) which could detect the defects of peripheral visual field[2]. Unfortunately,by the time these defects are detected by SAP, there have already been permanent and extensive damage of visual system[3]. Therefore, it is of clinical importance to strive for new technologies which are sensitive in identifying visual dysfunction in early glaucomatous patients.
It is known that there are two different signal pathways of RGC in the visual system (the magnocellular pathway and the parvocellular pathway)[4-6]. One hypothesis, based on previous histological discoveries that RGCs with larger diameter (presumably these cells work in magnocellular pathway)are prior impaired in the process of glaucoma, is proposed that the magnocellular pathway is preferentially damaged in early glaucoma[7-8], although several studies have reported conflicting results that the parvocellular and koniocellular pathways might also be involved in the early-stage glaucoma[9-10].Based on this hypothesis, the assessment tools that are targeted to magnocellular pathway may achieve the discriminatory capacities between glaucomatous and healthy patients.Recently, a novel electrophysiological test called isolatedcheck visual evoked potential (icVEP), which could elicit cortical activity and preferentially examine the function of the magnocellular signal pathway[11], have been introduced to the fi eld to assess the glaucomatous damage. Some studies reported that the icVEP had a promising discriminatory capacity between glaucomatous and normal eyes[6,12]. However,how about the diagnostic performance of icVEP in the detection of early glaucoma is rarely reported.
In this article, we compared the diagnostic performance of icVEP with that of SAP in high-risk ocular hypertension or early glaucoma patients for the purpose of evaluating the application values of icVEP in the detection of early glaucoma.It should be noted that the diagnostic standard in this study was based on the structural characterizations of the optic disc, considering that the SAP is the object of this research.Therefore, two morphological assessments of the optic disc were used in this study. One was the stereoscopic optic disc photograph as judged by masked experts; another was the Moorfields regression analysis (MRA) from the Heidelberg retina tomograph (HRT).
SUBJECTS AND METHODS
Subjects This study was approved by the Ethics Committee of the Eye Hospital of Wenzhou Medical University. It also strictly adhered to the principles of the Declaration of Helsinki. All subjects signed informed consent forms prior to participation and were recruited from the Eye Hospital of Wenzhou Medical University.
All participants had been tested with central 24-2 threshold SAP, Goldmann applanation tonometer and ultrasonic pachymeter on one previous occasion. At the time of recruitment, all participants must be either early glaucoma or high-risk ocular hypertension patients. Therefore, the subjects participated in this study must have the adjusted untreated intraocular pressure >21 mm Hg in both eyes and meet at least one of the underlying risk factors: individual history of migraine or vasospasm; family history of glaucoma; vertical cup to disc ratio was ≥0.6; cup to disc ratio asymmetry was≥0.2 between two eyes; or over 70 years old. The definition of "high-risk" was based on the ocular hypertension treatment study[13]. In order to exclude possible false positive in the diagnosis of ocular hypertension, the intraocular pressure detected by Goldmann applanation tonometer was adjusted for central corneal thickness by Ehler' method[14].
In addition, subjects were excluded from this study if they met one of the following conditions: best corrected visual acuity was <0.6; spectacle refraction was >±6.00 D sphere or >±2.00 D cylinder; mean deviation of visual fi eld was <-6 dB (the early glaucoma was considered to have the mean deviation of visual field ≥-6 dB[15]); any other former or current eye disease; or former ocular surgery (uncomplicated cataract surgery was excepted).
According to the above criteria, 144 individuals (288 eyes)were enrolled in this study, including 167 women and 121 men. The range of age was from 35 to 81 (57.52±13.24)y.
Standard Automated Perimetry The test of SAP was performed with the Humphrey Field Analyzer I (model 750; Carl Zeiss Meditec, Inc.). The pattern of central 24-2 threshold test was taken for all subjects. Visual fi eld analysis was performed by the device and the visual fi eld was deemed as abnormality if it met at least one of the following criterions: glaucoma hemif i eld test with outside normal limits (ONL); pattern standard deviation with Ρ<0.05; cluster of three or more non-edge points on the pattern deviation plot in a single hemif i eld with Ρ<0.05, one of which must have a Ρ<0.01[16-17]. The results of visual field analysis were considered reliable when fixation losses were <20% and false positive and negative errors were<33%.
Isolated-check Visual Evoked Potential The test of icVEP was performed with the Neucodia visual electrophysiological diagnostic system (MKWH AMD, Huzhou Medconova Medical Technology, Inc.). The working principle of this device was based on the detection of transmissive dysfunction of RGC in glaucomatous eyes. As above mentioned, there are two signal pathways of RGCs in the visual system: the magnocellular pathway and the parvocellular pathway.However, these two signal pathways were specialised for transmitting different types of visual information[18]. For example, low spatial and high temporal frequency information was mainly conveyed by the magnocellular pathway, whereas high spatial and low temporal frequency information was principal delivered by the parvocellular pathway[19]. Studies had revealed that the magnocellular pathway was prior damaged during the processes of glaucoma[7-8]. Therefore, icVEP that are targeted to functional abnormalities of magnocellular pathway may have the discriminatory capacities between glaucomatous and healthy patients.
With the starting of icVEP test, electrodes was applies to the scalp of participants with a electrolytic paste. The cortical response of subjects was elicited by the spatial pattern and recorded by the instrument which presented the result as an electroencephalogram (EEG). The fundamental frequency component (FFC) which was an important intermediate parameter in the test was calculated by the device which performed a Fourier transform on the EEG date. Finally, this device obtained the mean FFC by calculating eight separate runs and determined the radius of a 95% conf i dence circle.
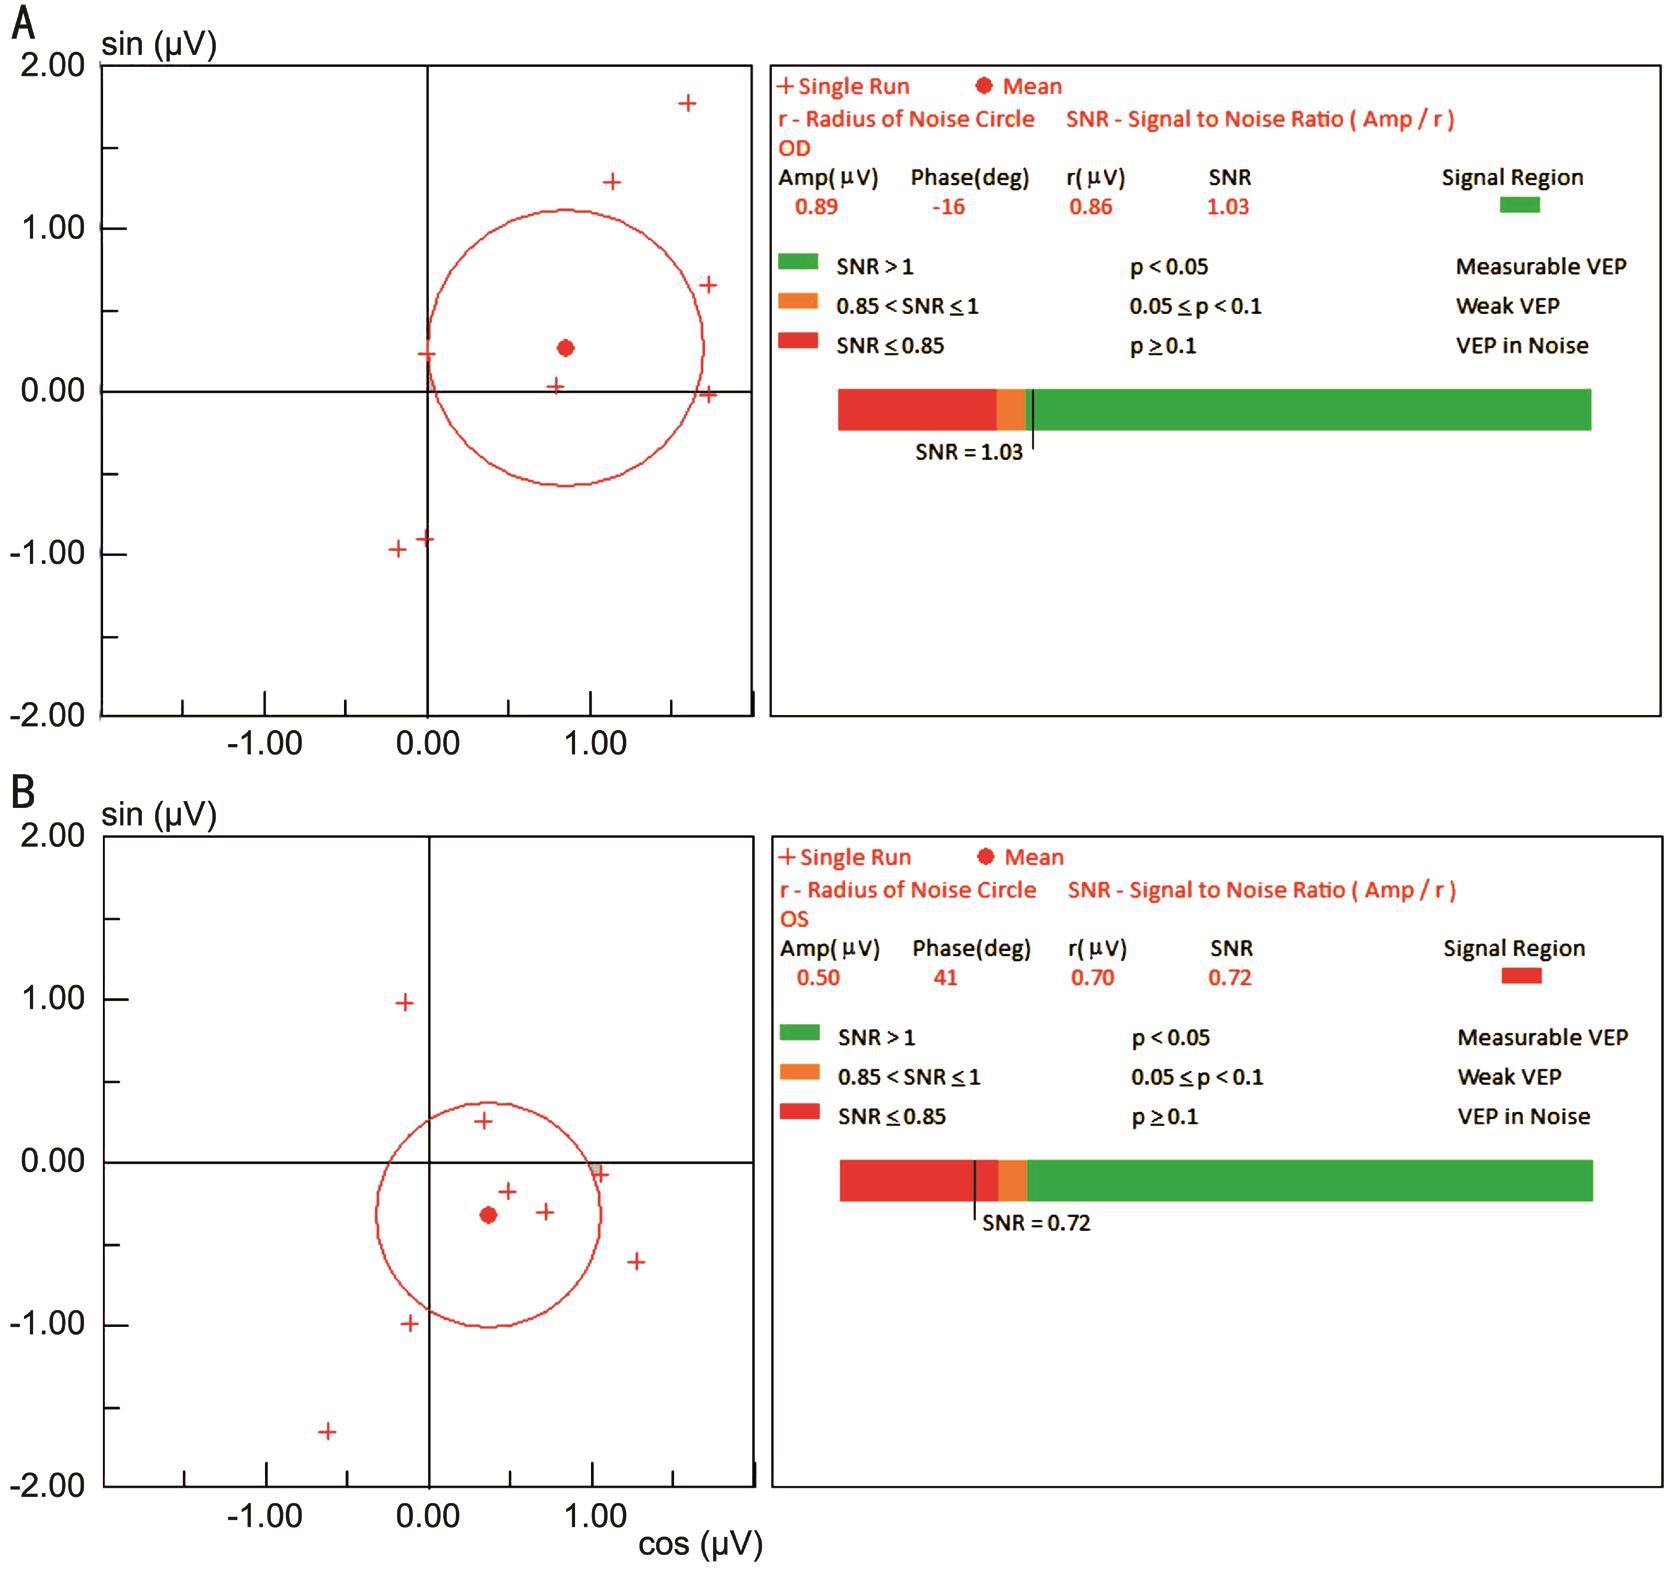
The signal-to-noise ratio (SNR) which was defined as the ratio of the mean amplitude of FFC to the radius of the 95% confidence circle was presented as the final result and applied to identify the presence of glaucomatous damage[6].A SNR≤1.0 was deemed as an abnormal result, whereas a SNR>1.0 was deemed as a normal result (Figure 1). In our study, 15% positive-contrast (bright) condition pattern was used to differentiate between healthy control subjects and glaucoma patients.

Figure 1 Eight separate FFCs of the icVEP under the 15% bright-check condition A: Normal; B: Abnormal.
Optic Disc Photograph Grader The optic disc photographs of all participants after maximum pupil dilation were obtained from a stereoscopic camera (3-Dx; Nidek Co., Inc.). All patient information except optic disc photographs was masked to two glaucoma experts who separately identified each fundus photograph as either “normality” or “glaucomatous optic neuropathy” (GON). The grading criteria obeyed by both glaucoma experts were summarized in the following points:thinning of neuroretinal rim, defects of retinal nerve fiber layer, excavation, ratio of cup-to-disc, and contravention of the “ISNT” rule. A third masked specialist would re-judge the disagreements between the two experts.
Moorfields Regression Analysis Classifier MRA was performed with the Confocal Scanning Laser Ophthalmoscopy(HRT 3; Heidelberg Engineering GmbH, Inc.). This analysis differentiates between healthy and glaucomatous optic nerve heads by detecting general and local changes of the neuroretinal rim area. The MRA results are indicated as color-coded symbols: a green checkmark stands for “inside normal limits (INL)”; a yellow exclamation mark stands for“borderline”; and a red cross stands for “ONL”. The eyes judged as “borderline” in this study were assigned to the category of “INL”, this is consistent with the way of Ford et al[20] who reported that the specif i city of MRA classif i er would be relatively higher when “borderline” cases were included in normal category.
Statistical Analysis The sensitivity of icVEP/SAP was represented by the percentage of GON eyes that were abnormal in the functional test. The specif i city of icVEP/SAP was represented by the percentage of normal optic disc eyes that were normal in the functional test. The comparison of sensitivity/specif i city between icVEP and SAP was performed by using McNemar test.
RESULTS
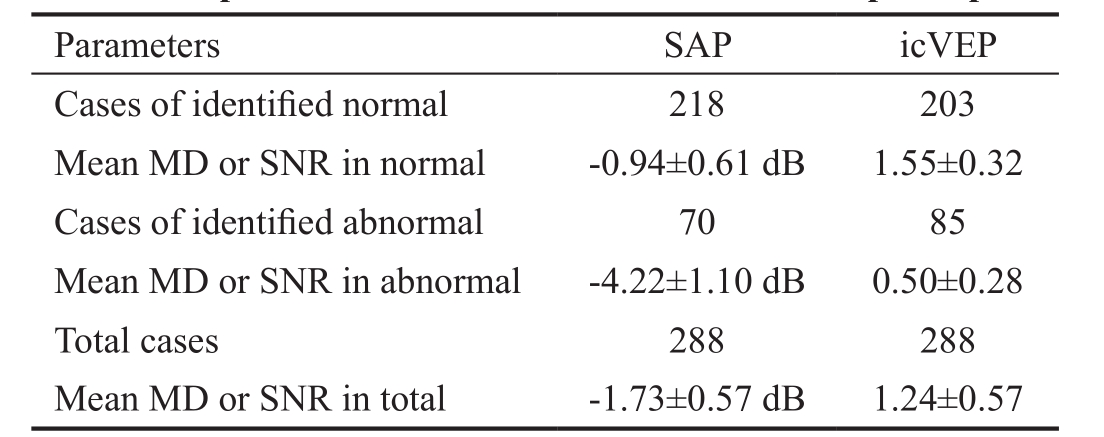
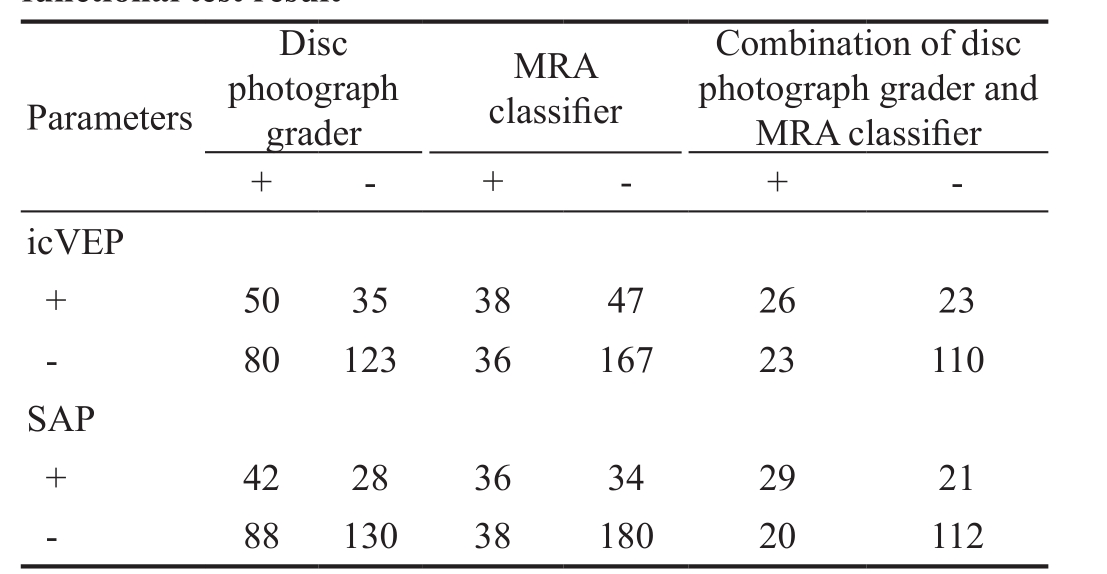
Diagnostic Standard on Optic Disc Photographs Grader There are 130 eyes (45.1%) classif i ed as GON and 158 eyes(54.9%) classif i ed as normal when the disc photograph grader was used for diagnostic standard. Seventy eyes (24.3%) were abnormal and two hundred and eighteen eyes (75.7%) were normal on the SAP test (Table 1). Eighty-five eyes (29.5%)were abnormal and two hundred and three eyes (70.5%) were normal on the icVEP test (Table 1). The agreement between disc photograph grader and SAP was 172 eyes (42 eyes that
disc photograph grader and SAP were both abnormal and 130 eyes were both normal). The disagreement between disc photographs grader and SAP was 116 eyes (28 eyes that disc photograph grader was normal whereas SAP was abnormal and 88 eyes that disc photograph grader was abnormal whereas SAP was normal). The agreement between disc photograph grader and icVEP was 173 eyes (50 eyes that disc photograph grader and icVEP were both abnormal and 123 eyes were both normal). The disagreement between disc photographs grader and icVEP was 115 eyes (35 eyes that disc photograph grader was normal whereas icVEP was abnormal and 80 eyes that disc photograph grader was abnormal whereas icVEP was normal). These results are shown in Table 2.
Thus, sensitivity for SAP and icVEP was 32.3% and 38.5%respectively and specif i city was 82.3% and 77.8% respectively,when disc photograph grader was used for diagnostic standard.McNemar test was performed to compare the sensitivity/specificity of SAP and icVEP. The test results revealed that there was no statistical significance between the sensitivity or specif i city of SAP and icVEP (Ρ value of McNemar test in sensitivities =0.243; Ρ value of McNemar test in specif i cities=0.281), when the disc photograph was used as diagnostic standard.
Table 1 The parameter results of SAP and icVEP in all participants

MD: Mean deviation; SNR: Signal-to-noise ratio.
Table 2 Contingency table of diagnostic standard result versus functional test result

+: Abnormality; -: Normality. The value of each intersection represents a summary of results that satisfy both the row and the column condition.
Diagnostic Standard on Moorfields Regression Analysis Classif i er There are 74 eyes (25.7%) identif i ed as ONL and 214 eyes (74.3%) identif i ed as INL when MRA classif i er was used for diagnostic standard. The agreement between MRA classif i er and SAP was 216 eyes (36 eyes that MRA classif i er and SAP were both abnormal and 180 eyes were both normal).The disagreement between MRA classifier and SAP was 72 eyes (34 eyes that MRA classifier was normal whereas SAP was abnormal and 38 eyes that MRA classif i er was abnormal whereas SAP was normal). The agreement between MRA classif i er and icVEP was 205 eyes (38 eyes that MRA classif i er and icVEP were both abnormal and 167 eyes were both normal). The disagreement between MRA classif i er and icVEP was 83 eyes (47 eyes that MRA classif i er was normal whereas icVEP was abnormal and 36 eyes that MRA classifier was abnormal whereas icVEP was normal). These results are also shown in Table 2.
Thus, sensitivity for SAP and icVEP was 48.6% and 51.4%respectively. The specif i city was 84.1% and 78.0% respectively,when MRA classifier was used for diagnostic standard.McNemar test revealed that there was no statistical signif i cance between the sensitivity or specificity of SAP and icVEP (Ρ value of McNemar test in sensitivities =0.845; Ρ value of McNemar test in specif i cities =0.06), when the MRA classif i er was used as diagnostic standard.
Diagnostic Standard on Combination of Optic Disc Photograph Grader and the Moorf i elds Regression Analysis Classif i er There are 49 eyes (26.9%) judged as abnormal and 133 eyes(73.1%) judged as normal when the combined structural assessment (combination of disc photograph grader and MRA classifier) was used for diagnostic. The agreement between combined structural assessment and SAP was 141 eyes (29 eyes that combined structural assessment and SAP were both abnormal and 112 eyes were both normal). The disagreement between combined structural assessment and SAP was 41 eyes (21 eyes that combined structural assessment was normal whereas SAP was abnormal and 20 eyes that combined structural assessment was abnormal whereas SAP was normal). The agreement between combined structural assessment and icVEP was 136 eyes (26 eyes that combined structural assessment and icVEP were both abnormal and 110 eyes were both normal). The disagreement between combined structural assessment and icVEP was 46 eyes (23 eyes that combined structural assessment was normal whereas icVEP was abnormal and 23 eyes that combined structural assessment was abnormal whereas icVEP was normal). These results are shown in Table 2.
Thus, sensitivity for SAP and icVEP was 59.2% and 53.1%respectively and specif i city was 84.2% and 84.6% respectively,when combined structural assessment was used for diagnostic standard. The results of McNemar test revealed that there was no statistical significance between the sensitivity or specificity of SAP and icVEP (Ρ value of McNemar test in sensitivities =0.607; Ρ value of McNemar test in specif i cities =0.824), when the combined structural assessment was used as diagnostic standard.
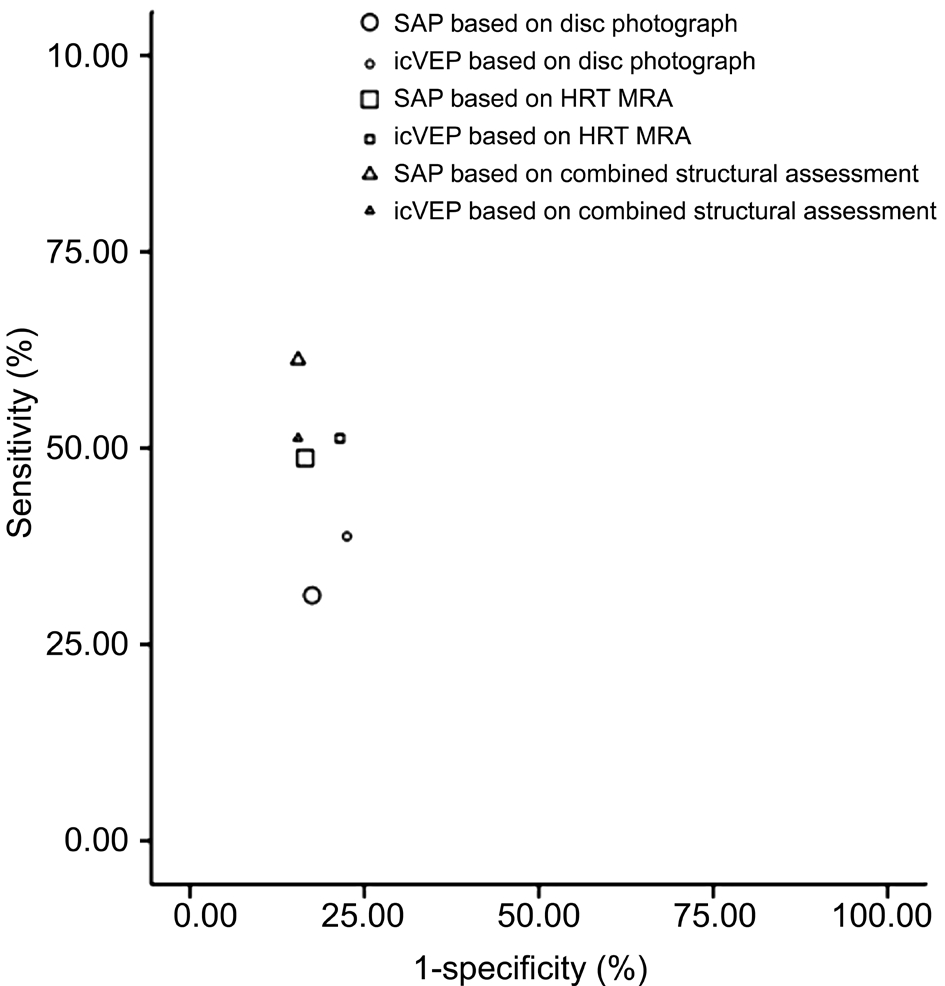
From the Figure 2, the (1-specif i cities) were close regardless of on which diagnostic standard was based. However, the sensitivity was relatively higher when the combined structural assessment and HRT MRA were used as diagnostic standard as compared to that when the disc photograph was used as diagnostic standard.
Furthermore, there were 67 eyes (23.3%) (26 eyes that SAP was abnormal whereas icVEP was normal and 41 eyes that SAP was normal whereas icVEP was abnormal) in which the two functional tests disagreed, although the overall diagnostic performance of icVEP and SAP was similar.
DISCUSSION
In this study, we discovered that there was no significant difference between the sensitivities of icVEP and SAP,regardless of on which diagnostic standard was based. However,it should be noted that the sensitivities were relatively higher when the MRA classif i er were used for the diagnostic standard,compared with when the optic disc photograph grader was used for the diagnostic standard. Furthermore, the number of eyes classif i ed as ONL by MRA classif i er was signif i cant less (74 eyes) than that of eyes classif i ed as GON by disc photograph grader (130 eyes). These above results could be explained by the fact that the MRA classif i er was more conservative than the disc photograph grader.
In addition, there was also no significant difference between the specificities of these two functional tests, regardless of which diagnostic standard was based on. Differing from the sensitivities, the specificities were always similar when the diagnostic standard was changed. It is interesting to find out that the specif i cities remained stable whereas the sensitivities slightly raised (as mentioned above) when the diagnostic standard changed from the disc photograph grader to the MRA classifier, indicating that both of the functional tests were better agreement with the MRA classifier than with the disc photograph grader.
In summary, the overall performance of icVEP was close to that of SAP in the early diagnosis of glaucoma. However, it is important to point out that the disagreements between SAP and icVEP was up to 67 eyes (23.3%) (26 eyes that SAP was abnormal whereas icVEP was normal and 41 eyes that SAP was normal whereas icVEP was abnormal). It means that the SAP detects some real abnormalities which the icVEP is missing, and vice versa. There are several reasons for these disagreements. Firstly, variability of both functional tests partly explains for the disagreements[5]. Secondly, according to the fact that the icVEP is tend to identify central vision abnormalities whereas SAP is tend to assess peripheral visual function, it is speculated that the differential targeted detection of these two functional tests may partly account for the disagreements. Thirdly, compared with SAP which relies on the behavioral responses to detect visual function, the icVEP is a direct assessment of physiological activity in the visual system, indicating that SAP and icVEP may detect different functional deficits. Therefore, combination of these two functional tests which effectively complement with each other may greatly improve the ability to detect early glaucoma.

Figure 2 Sensitivity versus 1-specificity of each test based on different diagnostic standards The 1-specificity were close regardless of which diagnostic standard was used. The sensitivity was relatively higher when the combined structural assessment was used as diagnostic standard. The sensitivity was relatively lower when the disc photograph was used as diagnostic standard.
In the past few years, many articles had discussed the diagnostic performance of icVEP and SAP in glaucoma patients[6,16,21-22].However, it is odd to find out that the sensitivities in the former articles were greatly higher than the sensitivities in this study[6,16,21-22]. This phenomenon may be explained by the following points. Firstly, the selection bias of the study populations may partly account for this result. Secondly, the functional abnormalities detected by icVEP and SAP may not well synchronize with structural abnormalities which were used as diagnostic standard in this study. This viewpoint is consistent with what Higginbotham et al[13] had reported.Thirdly, the diagnostic standard based on single criterion used in present study was more likely than diagnostic standard based on combined criteria used in some former articles to raise the misdiagnosis of early glaucoma. This would lead to the declination of sensitivity in this study. This explaination is supported by the results in this study that the sensitivities(SAP was 59.2% and icVEP was 53.1%) when the combined structural assessment was used as diagnostic standard were slightly higher than that when the optic disc photograph grader (SAP was 32.3% and icVEP was 38.5%) or the MRA classifier (SAP was 48.6% and icVEP was 51.4%) was used as the diagnostic standard. Thus, the total values of sensitivity obtained from the current article must be interpreted with caution.
This study revealed that the diagnostic performance of icVEP was not better than that of SAP in the detection of early glaucoma regardless of whether the diagnostic standard was based on disc photograph, the MRA classifier, or the combination of both structural assessments. However, the combination of these two functional tests may improve the ability to detect early glaucoma.
ACKNOWLEDGEMENTS
Ying-Xi Zhao suggested concept of study and performed to conduct study. Collection, analysis and interpretation of data were performed by Xiang-Wu Chen. Xiang-Wu Chen wrote the manuscript. Both authors approved the manuscript for submission.
Foundation: Supported by the Plan of Wenzhou Science and Technology (No.Y20160439).
Conflicts of Interest: Chen XW, None; Zhao YX, None.
REFERENCES
1 Quaranta L, Riva I, Gerardi C, Oddone F, Floriano I, Konstas AG. Quality of life in glaucoma: a review of the literature. Adv Ther 2016;33(6):959-981.
2 Odden JL, Mihailovic A, Boland MV, Friedman DS, West SK, Ramulu PY. Evaluation of central and peripheral visual field concordance in glaucoma. Invest Ophthalmol Vis Sci 2016;57(6):2797-2804.
3 Quigley HA, Dunkelberger GR, Green WR. Retinal ganglion cell atrophy correlated with automated perimetry in human eyes with glaucoma. Am J Ophthalmol 1989;107(5):453-464.
4 Zele AJ, Wood JM, Girgenti CC. Magnocellular and parvocellular pathway mediated luminance contrast discrimination in amblyopia. Vision Res 2010;50(10):969-976.
5 Soto I, Pease ME, Son JL, Shi X, Quigley HA, Marsh-Armstrong N.Retinal ganglion cell loss in a rat ocular hypertension model is sectorial and involves early optic nerve axon loss. Invest Ophthalmol Vis Sci 2011;52(1):434-441.
6 Zemon V, Tsai JC, Forbes M, Al-Aswad LA, Chen CM, Gordon J,Greenstein VC, Hu G, Strugstad EC, Dhrami-Gavazi E, Jindra LF. Novel electrophysiological instrument for rapid and objective assessment of magnocellular deficits associated with glaucoma. Doc Ophthalmol 2008;117(3):233-243.
7 Greenstein VC, Seliger S, Zemon V, Ritch R. Visual evoked potential assessment of the effects of glaucoma on visual subsystems. Vision Res 1998;38(12):1901-1911.
8 Nickells RW. Ganglion cell death in glaucoma: from mice to men. Vet Ophthalmol 2007;10 Suppl 1:88-94.
9 Yücel YH, Zhang Q, Weinreb RN, Kaufman PL, Gupta N. Effects of retinal ganglion cell loss on magno-, parvo-, koniocellular pathways in the lateral geniculate nucleus and visual cortex in glaucoma. Ρrog Retin Eye Res 2003;22(4):465-481.
10 Sample PA, Medeiros FA, Racette L, Pascual JP, Boden C, Zangwill LM, Bowd C, Weinreb RN. Identifying glaucomatous vision loss with visual-function-specific perimetry in the diagnostic innovations in glaucoma study. Invest Ophthalmol Vis Sci 2006;47(8):3381-3389.
11 Murav'eva SV, Deshkovich AA, Shelepin YE. The human magno and parvo systems and selective impairments of their functions. Neurosci Behav Ρhysiol 2009;39(6):535-543.
12 Salim S, Childers K, Lupinacci AP, Hu GZ, Zemon V, Netland PA. Influence of pupil size and other test variables on visual function assessment using visual evoked potentials in normal subjects. Doc Ophthalmol 2010;121(1):1-7.
13 Higginbotham EJ, Gordon MO, Beiser JA, Drake MV, Bennett GR,Wilson MR, Kass MA; Ocular Hypertension Treatment Study Group.The ocular hypertension treatment study: topical medication delays or prevents primary open-angle glaucoma in African American individuals.Arch Ophthalmol 2004;122(6):813-820.
14 Ehlers N, Bramsen T, Sperling S. Applanation tonometry and central corneal thickness. Acta Ophthalmol (Copenh) 1975;53(1):34-43.
15 El-Danaf RN, Huberman AD. Characteristic patterns of dendritic remodeling in early-stage glaucoma: evidence from genetically identif i ed retinal ganglion cell types. J Neurosci 2015;35(6):2329-2343.
16 Rolle T, Manerba L, Lanzafame P, Grignolo FM. Diagnostic power of macular retinal thickness analysis and structure-function relationship in glaucoma diagnosis using SPECTRALIS OCT. Curr Eye Res 2016;41(5):667-675.
17 De Moraes CG, Demirel S, Gardiner SK, Liebmann JM, Cioff i GA,Ritch R, Gordon MO, Kass MA; Ocular Hypertension Treatment Study Group. Effect of treatment on the rate of visual fi eld change in the ocular hypertension treatment study observation group. Invest Ophthalmol Vis Sci 2012;53(4):1704-1709.
18 Zhuang X, Pokorny J, Cao D. Flicker adaptation desensitizes the magnocellular but not the parvocellular pathway. Invest Ophthalmol Vis Sci 2015;56(5):2901-2908.
19 Al-Hashmi AM, Kramer DJ, Mullen KT. Human vision with a lesion of the parvocellular pathway: an optic neuritis model for selective contrast sensitivity def i cits with severe loss of midget ganglion cell function. Exp Brain Res 2011;215(3-4):293-305.
20 Ford BA, Artes PH, McCormick TA, Nicolela MT, LeBlanc RP,Chauhan BC. Comparison of data analysis tools for detection of glaucoma with the Heidelberg retina tomograph. Ophthalmology 2003;110(6):1145-1150.
21 Patel DE, Cumberland PM, Walters BC, Russell-Eggitt I, Cortina-Borja M, Rahi JS; OPTIC Study Group. Study of optimal perimetric testing in children (OPTIC): normative visual field values in children.Ophthalmology 2015;122(8):1711-1717.
22 Sponsel WE, Ritch R, Stamper R, Higginbotham EJ, Anderson DR,Wilson MR, Zimmerman TJ. Prevent blindness America visual field screening study. The prevent blindness America glaucoma advisory committee. Am J Ophthalmol 1995;120(6):699-708.