
・Basic
Research・Current
Issue・ ・Achieve・ ・Search Articles・ ・Online Submission・ ・About IJO・ PMC
Proteomic profiling of early
degenerative retina of RCS rats
Zhi-Hong Zhu1,2, Yan Fu1,2, Chuan-Huang Weng1,2
, Cong-Jian Zhao1,2, Zheng-Qin Yin1,2
1Southwest
Hospital/Southwest Eye Hospital, Third Military Medical University, Chongqing 400038,
China
2Key Lab of Visual Damage
and Regeneration & Restoration of Chongqing, Chongqing 400038, China
Correspondence
to:
Cong-Jian Zhao and Zheng-Qin Yin. NO. 30, Gaotanyan Street, Shapingba district,
Chongqing 400038, China. cj.zhao@yahoo.com; qinzyin@aliyun.com
Received:
2017-02-16
Accepted: 2017-04-06
Abstract
AIM: To identify the
underlying cellular and molecular changes in retinitis pigmentosa (RP).
METHODS: Label-free
quantification-based proteomics analysis, with its advantages of being more
economic and consisting of simpler procedures, has been used with increasing
frequency in modern biological research. Dystrophic RCS rats, the first
laboratory animal model for the study of RP, possess a similar pathological
course as human beings with the diseases. Thus, we employed a comparative
proteomics analysis approach for in-depth proteome profiling of retinas from
dystrophic RCS rats and non-dystrophic congenic controls through Linear Trap
Quadrupole - orbitrap MS/MS, to identify the significant differentially
expressed proteins (DEPs). Bioinformatics analyses, including Gene ontology
(GO) and Kyoto Encyclopedia of Genes and Genomes (KEGG) pathway annotation and
upstream regulatory analysis, were then performed on these retina proteins. Finally,
a Western blotting experiment was carried out to verify the difference in the
abundance of transcript factor E2F1.
RESULTS: In this study,
we identified a total of 2375 protein groups from the retinal protein samples
of RCS rats and non-dystrophic congenic controls. Four hundred thirty-four
significantly DEPs were selected by Student’s t-test. Based on the
results of the bioinformatics analysis, we identified mitochondrial dysfunction
and transcription factor E2F1 as the key initiation factors in early retinal
degenerative process.
CONCLUSION: We showed that
the mitochondrial dysfunction and the transcription factor E2F1 substantially
contribute to the disease etiology of RP. The results provide a new potential
therapeutic approach for this retinal degenerative disease.
KEYWORDS: retinal degeneration;
proteomics; mitochondrion; E2F1; MaxQuant; RCS rat
DOI:10.18240/ijo.2017.06.08
Citation: Zhu ZH, Fu
Y, Weng CH, Zhao CJ, Yin ZQ. Proteomic profiling of early degenerative retina
of RCS rats. Int J Ophthalmol 2017;10(6): 878-889
Article Outline
INTRODUCTION
Retinitis
pigmentosa (RP) is a group of genetically mediated degenerative diseases, to
which more than 80 genes related have been identified to date[1-3]. Even though various genes contribute to retinal
degeneration in different ways, they result in similar pathological features:
progressive loss of rod and cone photoreceptors with progressive night
blindness, and the gradual loss of the peripheral visual field, followed by the
eventual loss of full field vision[4]. Yet despite
many mechanisms have been proposed to underlie this inherited neurodegenerative
disease, there is still no satisfactory explanation for this phenomenon. Years
ago, a mutation in HK1 gene encoding the hexokinase 1 was reported in several
autosomal dominant RP families[5]. Hexokinase 1 is
an enzyme that believed to catalyze the phosphorylation of glucose to
glucose-6-phosphate, the first step of glycolysis. Thus, we wondered if the
abnormality of the glycolysis pathway may be involved in the development and
occurrence of retinal degenerative. Alternatively, the role of mitochondria in
inherited neurodegenerative diseases, such as Parkinson’s disease, Alzheimer’s
disease and Huntington’s disease, has been noted increasingly often recently.
This prompted us to also assess the potential contribution of mitochondria in
RP. Mitochondria are the driving force of life, as they provide the major
energy source in cells through oxidative phosphorylation. Moreover,
mitochondria also play an important role in mediating cell apoptosis, for
example, by releasing pro-apoptotic factors such as cytochrome C, Smac/DIABLO,
and endonuclease G into the cytosol[6-8].
Consequently, mitochondrial dysfunction is a prime suspect for neuronal death.
However, the precise role of mitochondria in photoreceptor cell death and the
exact mechanism by which they exert their effects are still unknown.
Dystrophic RCS
(RCS-rdy-p+) rats, which were established by the Royal College of Surgeons, are
the first laboratory animal model for the study of RP. These rats possess a
similar pathological course as human beings with the diseases. The mertk
gene mutation in the retinal pigment epithelium (RPE) causes a failure of
phagocytosis in the deserted segment of photoreceptors, which leads to the
death of photoreceptors[9-10].
In dystrophic RCS rats, the first changes in the morphology of the retina can
be observed at postnatal 14d, and the rod photoreceptor outer segments appear
irregular in structure and contain some pyknotic nuclei. Next, an obvious
reduction in the number of rod photoreceptors begins at postnatal 18d. This
reduction is followed by a reduction in the number of cone photoreceptors,
until they are all lost[11]. In this study, we
aimed to analyze retinal proteins obtained from this RP model rat, and compare
it with that from normal congenic controls, to determine the potential
significant factors molecular pathways involved in disease aetiology of RP.
To explore the
potential molecular pathways involved in the early stages of RP, we took
advantage of the label-free Orbitrap MS/MS-based proteomic approach[12-15]. More specifically, we
systematically analysed retinal proteins obtained from RCS rats and compared
the data with that from normal congenic controls to screen changes in protein
regulation. Considering that the retinal cells are still refining their
synaptic wiring after the rat eye opens at postnatal 14d, late development
process and RP-related degeneration may be occurring simultaneously. Therefore,
we chose four different age groups (postnatal 18, 24, 30, and 36d) of RCS rats
to explore the candidate biomarkers or molecular pathways involved in this
disease.
MATERIALS AND METHODS
Materials Tris, Thiourea, Urea, DTT, DNase I
and RNase A were all products of Sigma Company, USA. Cell lysis buffer, protein
loading buffer, and the SDS-polyacrylamide gel preparing kit were obtained from
Beyotime Biotechnology Company, China. Polyvinylidene fluoride membrane was
purchased from Solarbio Science & Technology Corporation, USA. Trypsin was
purchased from PROMEGA Corporation, China. All reagents and solvents were used
without further purification.
Animals The study was approved by
Institutional Animal Care and Use Committee of the Southwest Hospital, the
Third Military Medical University, Chongqing, China. All procedures were
performed in accordance with the Association for Research in Vision and
Ophthalmology Statement for the Use of Animals in Ophthalmic and Vision
Research. According to the “3Rs” principles of animal research (replacement,
reduction and refinement), a minimum number of rats needed to obtain reliable
results and least invasive procedures to minimize pain and distress were used
in this study. All participants are trained with the latest techniques to most
effectively and humanely manage and care for rats. The dystrophic RCS
(RCS-rdy-p+) rats and non-dystrophic congenic controls used in this study were
bred in the animal facility of the Southwest Eye Hospital, the Third Military
Medicine University, Chongqing, China. These rats were kept in the rooms with
regular light-dark cycles (12:12h) that were controlled by a light timer.
A total of 32
rats were used in this study. Sixteen were dystrophic RCS rats, while the rest
were non-dystrophic congenic controls. We divided them into four experimental
cohorts according to postnatal days, 18, 24, 30 and 36d. All of the rats used
in the study were asphyxiated in a CO2 inhalation chamber and killed
by cervical dislocation. The retinas were obtained from fresh eyeballs of the
rats and immediately transferred into ice-cold phosphate buffered saline (PBS)
(Table 1).
Table 1
Retinal protein sample collection details
|
Sample IDs |
Genotype |
Age (postnatal days) |
Retinas |
Biological replicates |
Technical replicates |
|
RCS 18d |
RCS |
18 |
8 |
2 |
4 |
|
RCS 24d |
RCS |
24 |
8 |
2 |
4 |
|
RCS 30d |
RCS |
30 |
8 |
2 |
4 |
|
RCS 36d |
RCS |
36 |
8 |
2 |
4 |
|
CON 18d |
rdy |
18 |
8 |
2 |
4 |
|
CON 24d |
rdy |
24 |
8 |
2 |
4 |
|
CON 30d |
rdy |
30 |
8 |
2 |
4 |
|
CON 36d |
rdy |
36 |
8 |
2 |
4 |
Protein
Extraction and SDS-PAGE Retinal proteins were
extracted from RCS rats and normal congenic controls at given time points.
Considering that our interest is not on the individual but rather on the common
changes in retinal degenerative process, pooled protein lysates from sets of 4
retinas per genotype at each age cohort were collected[16].
Four protein lysate samples per age cohort were generated: two from RCS rat
retina tissue (RCS, n=8), and two from normal congenic control (CON, n=8).
Freshly
isolated rat retinas were suspended in hypotonic lysis buffer containing cell
lysis buffer [20 mmol/L Tris, pH 7.5, 150 mmol/L NaCl, 1% Triton X-100, 2.5
mmol/L sodium pyrophosphate, 1 mmol/L EDTA, 1% Na3VO4,
0.5 μg/mL leupeptin, 1 mmol/L phenylmethanesulfonyl fluoride (PMSF)], 5 mol/L
urea, 2 mol/L thiourea, 100 mmol/L DTT, 40 mmol/L Tris, 20 μg/mL DNase I, and 5
μg/mL RNase A. The samples were freeze-thawed three times in liquid nitrogen.
The tissue lysates were homogenized by ultracentrifugation for 30min at 10
000×g, 4℃, followed by incubation at 4℃ for 2h. After incubation, the protein
concentration of each individual tissue lysate was measured using the BCA
protein assay (Beyotime Biotechnology Company, China) and bovine serum albumin
as a protein standard. Then, tissue proteins (35 μg) were loaded on a 10%
SDS-polyacrylamide gel for electrophoresis. The samples were stored at -20℃
until proteomics analysis.
Mass
Spectrometry Analysis To generate peptides
suitable for mass spectrometry analysis, the samples were in-gel digested by
adding trypsin, and digestion was carried out at 37℃ overnight. The EASY-nLC
1000 liquid chromatograph (LC) system (Thermo Fisher scientific, USA) was
applied to acquire satisfying MS raw data using a two-column setup. The setup
consisted of a 75-μm i.d. ×2-cm trap column and a 75-μm i.d.×15-cmanalytical
nano-column. The sample injection volume was set to 5 μL. The LC system
gradient was 5%-40% solvent B (A=99.9% water, 0.1% formicacid; B=99.9%
acetonitrile, 0.1% formic acid) over 70min, 40%-80% solvent B over 5min, 80%
solvent B for 5min and a reduction from 80% to 5% solvent B in 5min at a
flow-rate of 250 nL/min.
Liquid
chromatography was coupled with an LTQ-orbitrap Velos Pro mass spectrometer
(Thermo Fisher scientific, USA), which is located at the Third Military
Medicine University, Chongqing, China. Each peptide sample was measured four
times. Nanospray ionization (NSI) was used with a spray voltage of 2.20 kV and
a spray current of 0.65 µA. The Sheath Gas Flow Rate was set to -0.02, while
the Aux Gas Flow Rate was -0.07, and the Sweep Gas Flow Rate was 0.20. The
capillary temperature was set to 275.03℃. The LTQ-orbitrap Velos Pro mass
spectrometer was used in data-dependent MS acquisition mode. Acquisition was
performed in the Orbitrap portion of the instrument for MS in the mass scan
range of 350 to 2000 m/z at are solution of 30 000 and in the linear ion trap
portion of the instrument for MS/MS. The activate type was set to CID, with
default charge state 2, isolation width 2 m/z, activation Q value of 0.25 and
activation time of 15ms. The dynamic exclusion time was set to 60s.
Peptide
Identification The raw files obtained
from orbitrap MS/MS were imported into the Label-free Quantification
(LFQ)-MaxQuant search engine (Ver. 1.5.3.8, http://www.maxquant.org)[17-18] and MASCOT (Ver. 2.2) for
identification and Label-free quantification of proteins.
For MASCOT
configures, carbamidomethylation on cysteine was set as the fixed modification,
while oxidation on methionine was set as the variable modification. Trypsin/P
was set as the enzyme and, one trypsin missed cleavage was allowed. The false
discovery rate (FDR) was set at lower than 1%.
For protein
identification in MaxQuant, the database search engine Andromeda was used to
search MS/MS spectra against the Rattus norvegicus database (updated at
2/08/2015, 29887 proteins) downloaded from the Uniprot database
(http://www.uniprot.org/proteomes/UP000002494), with a tolerance level of 6 ppm
for MS and 20 ppm for MS/MS. Trypsin/P was set as the enzyme, and two
Max.missed cleavages were allowed. Protein N-terminal acetylation and oxidation
of Methionines were set as variable modifications and carbamidomethylation of
cysteines was set as a fixed modification. The Max.number of modifications per
peptide was set as five, and contaminants were included. The “match between
runs” feature was checked, with a match time window of 0.7min and an alignment
time window of 20min. The FDR for protein level and peptide spectrum match
(PSM) level were both set as 1%, and every peptide would be used only once in
the protein identification process, in a razor peptide fashion. The minimum
ratio count for protein quantification was set as two. Protein quantification
was based on the MaxLFQ algorithm, using both unique and razor peptides for
protein quantification, with the minimum ratio count for protein quantification
setting as two. The default setting was used for all other configurations.
Finally, the result was obtained from the proteinGroups.txt file in the column
called “LFQ Intensity etc.”. This was calculated for each protein
according to the MaxLFQ algorithm based on the (raw) intensities and normalized
on multiple levels to ensure that the profiles of LFQ intensities across
samples accurately reflected the relative amounts of the proteins[18].
The mass
spectrometry proteomics data have been deposited to the ProteomeXchange
Consortium[19] via the PRIDE[20] partner repository with the dataset identifier
PXD004094.
Statistical
Analysis To assess the technical
and biological variability of each retinal protein sample from each
experimental group, we have calculated the Pearson correlation coefficients
based on the LFQ intensities of each sample. ANOVA was performed using IBM SPSS
statistics (version 19), and the LSD (least-significant-difference) method and
the Boniferroni method were used as the correction method for multiple
comparisons. To determine the statistically significantly differentially
expressed proteins (DEPs) between RCS rats and normal controls at each
experimental cohort, independent-samples Student’s two-tailed t-test was
used to compare the intensities of each protein. A P<0.05 was
considered to be statistically significant. All of the statistics were
calculated using IBM SPSS statistics (version 19). The data are shown as a
heatmap, which was created by Hemi software[21].
Bioinformatics
Analysis The retinal proteins
identified in RCS rats were categorized by protein class with PANTHER (Protein
Analysis THrough Evolutionary Relationships) gene analysis tools (Ver. 9.0,
http://www.pantherdb.org/)[22-23].
The population distribution of the identified retinal proteins and
statistically significant DEPs in cellular components (CC) was analyzed with
PANTHER gene analysis tools.
To categorize
the CC, biological processes (BP) and molecular functions (MF) of the
identified statistically significantly DEPs in our data set, we imported the
DEPs into STRING search engine (Ver. 10., http://string-db.org), a database of
known and predicted protein interactions that provides biological information
regarding protein interactions, Gene ontology (GO), and the Kyoto Encyclopedia
of Genes and Genomes (KEGG) pathway[24]. The
enriched KEGG pathway mapping was perform on the KEGG (2.0,
http://www.genome.jp/kegg/), a database resource with large-scale datasets
obtained from high-throughput experimental technologies designed for understanding
high-level functions and utilities of the biological system[25].
Upstream
regulatory analysis of significantly DEPs was performed to identify the key
transcription factors involved in their regulation. A transcription factor and
kinase search engine, Expression 2Kinases (X2K) (Ver. 1.6.1207.
http://www.maayanlab.net/X2K/), which is based on a database of chromatin
immune precipitation (ChIP)-seq/chip Enrichment Analysis (ChEA) and position
weight Matrices (PWMs), was used[26-27].
The graphic file obtained from Expression 2Kinases was edited by yEd Graph
Editor (Ver. 3.14.4, http://www.yworks.com/en/).
Western
Blot Analysis Proteins extraction and
electrophoresis were performed as described in Section 2.3. In the following
step, 10% SDS-polyacrylamide gel (Beyotime) was electrophoretically transferred
to a polyvinylidene fluoride membrane (Solarbio, Beijing, China). After
blocking in 5% nonfat dry milk in Tris-buffered saline (TBS) for 2h at room
temperature, membranes were incubated overnight at 4℃ with primary rabbit
polyclonal antibodies for E2F1 (1:500), and β-actin (1:1000) as internal
control. All the primary rabbit polyclonal antibodies were diluted with primary
antibody dilution buffer (Beyotime, China). After three washes with TBS for 10
min each, membranes were incubated with horseradish peroxidase (HRP)-conjugated
goat anti-rabbit IgG (1:1 000) for 1h at room temperature. Antibody was diluted
with secondary antibody dilution buffer (Beyotime, China). Protein bands were
visualized using an enhanced chemiluminescence kit (BeyoECL Plus, Beyotime,
China), and protein expression levels were analyzed using the Image J software[28].
RESULTS
Protein Identification
To
explore the proteins related to early onset of retinal degeneration,
comparative proteomic analysis was performed on retinal protein samples from
dystrophic RCS rats (RCS) and non-dystrophic congenic controls (CON) at
postnatal days 18, 24, 30 and 36d. The experimental workflow is illustrated in
Figure 1A. Each genotype per age cohort contains two retinal protein samples
(Sample #1, Sample #2) and each retinal protein sample contains tissues from
two individual animals (4 retinas). Proteomic analysis using LTQ-Orbitrap MS/MS
is of high sensitivity, high resolution and high-mass accuracy but low
repeatability. To increase the peptide coverage and experimental reliability,
we carried out four independent experiments on each retinal protein sample. To
evaluate the MaxLFQ algorithm integrated in the MaxQuant search engine, we also
applied the MASCOT search engine, which is also frequently used to process MS
spectral raw data. In contrast to MaxLFQ, MASCOT tends to calculate the
significant threshold of ions score for every assigned peptide and only
peptides that are higher than a significant threshold are considered as highly
reliable. The relevant parameters and configurations are described in the
Experimental Procedures.
The total
numbers of RCS rat retinal proteins identified in sample #1 by MaxLFQ and
MASCOT were 841 and 4518, respectively. Specifically, the numbers of proteins
identified by MaxLFQ were 669, 552, 672 and 647, while that identified by
MASCOT were 1489, 1153, 1283 and 1431, for each age cohort, respectively.
However, although a greater number of proteins can be discovered by MASCOT, it
appears to be less reliable compared with MaxLFQ, as low percentages (19.07%,
25.33%, 15.98% and 23.95%, respectively) of proteins were observed in four
independent experiments, while high percentages (50.50%, 49.18%, 36.24% and
51.43%, respectively) of proteins were observed in only one experiment. In
contrast, the percentages of proteins identified by MaxLFQ observed in four
independent experiments were far higher (49.33%, 51.45%, 59.52% and 60.43%,
respectively), while the percentages of that observed in only one experiment
were far lower (10.76%, 19.20%, 15.77% and 15.46%, respectively) than MASCOT.
Furthermore, the number of proteins observed in four independent experiments
identified by MaxLFQ was slightly greater than that obtained by MASCOT (Figure
1B). Hence the proteome datasets outputted by MaxQuant search engine would be
used for further analysis in this study.
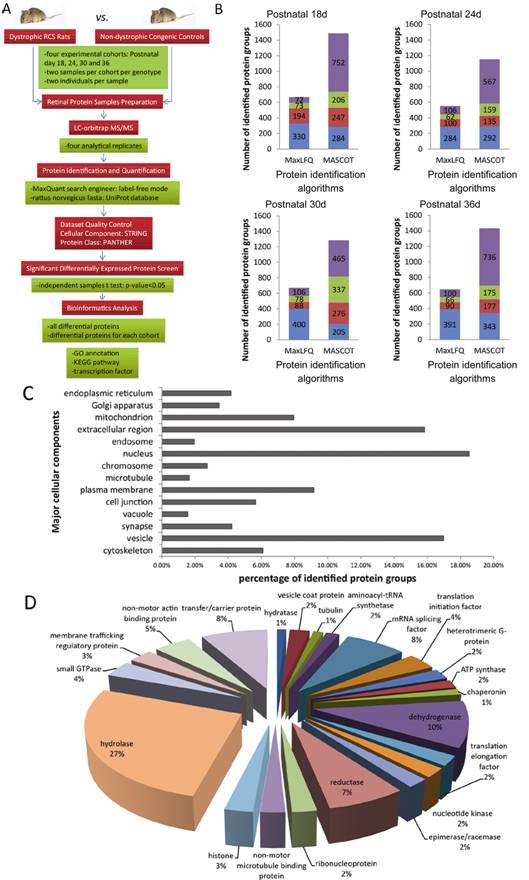
Figure 1
Protein identification of retina samples from model rats using LC-orbitrap
MS/MS The process of sample preparation,
data acquisition, and data analysis is shown in the flowchart (A). Proteins
from RCS rat retina in sample #1 identified by MaxLFQ and MASCOT yield 841
(669, 552, 672 and 647 in each age cohort) and 4518 (1489, 1153, 1283 and 1431
in each age cohort) protein groups, respectively (FDR<1%). Blue column
represents the number of protein groups observed in every experiment, while red
column in three and olive column in two, and violet column in only one (B). The
percentage of major cellular components is presented as a bar chart and shows
the population distributions of all identified protein groups in various
subcellular compartments (C). All of the retinal proteins of RCS rats
identified by MaxLFQ were categorized by Protein Class with PANTHER database,
ranking hydrolase proteins to the top with the largest proportion (D).
The proteome
datasets identified by MaxQuant consisted of 2523 protein groups, of which 37
protein groups were classified as “potential contaminant” and 24 protein groups
as “reverse”, and 35 protein groups only identified in site. These so-called
“potential contaminant” are common laboratory contaminant such as trypsin and
human epidermal keratins, which may or may not be true contaminant but still
should be ruled out in the following analysis. Finally, we have identified 2375
valid protein groups. To assess the reproducibility of the technical and
biological replicates, Pearson correlation coefficient analysis was carried out
based on the LFQ intensities with each experimental group. Pearson correlation
coefficients were represented in Table 2. The result revealed Pearson
correlation coefficients between 0.64 and 0.99, and indicated that biological
replicates and analytical replicates had a relatively high degree of
reproducibility.
Table 2 Pearson
correlation coefficients between the LFQ (label-free quantification)
intensities from the biological and technical replicates in all experimental
groups
|
Experimental groups |
Correlation coefficients in biological replicates |
Correlation coefficients in technical replicates |
|
RCS 18d |
0.7668-0.8721 |
0.9040-0.9976 |
|
RCS 24d |
0.7081-0.8536 |
0.9018-0.9893 |
|
RCS 30d |
0.7802-0.8930 |
0.9195-0.9933 |
|
RCS 36d |
0.6465-0.8468 |
0.9036-0.9931 |
|
CON 18d |
0.6891-0.8902 |
0.8549-0.9951 |
|
CON 24d |
0.7953-0.9169 |
0.9113-0.9957 |
|
CON 30d |
0.8004-0.9116 |
0.9497-0.9966 |
|
CON 36d |
0.7154-0.8777 |
0.9425-0.9937 |
To evaluate
the population distribution of the identified retinal proteins, we imported the
total 2375 protein groups into PANTHER gene analysis tools. As shown in Figure
1C, nucleus, vesicle and extracellular region accounted for the largest
proportion of annotation proteins. All the protein groups were categorized by
protein class through PANTHER gene analysis tools, ranking hydrolase protein
(27%) to the top. In addition, dehydrogenase (10%), transfer/carrier protein
(8%), mRNA splicing factor (8%) and reductase (7%) were also identified as
major protein classes. Other than these protein classes, a small percentage
(1%) of proteins were also determined to be chaperonin, tubulin and hydratase
(Figure 1D).
Significantly
Differentially Expressed Protein Analysis Between RCS and Controls The proteome datasets consisted of
1746, 1658, 1704 and 2006 protein groups for the 18, 24, 30 and 36d cohorts,
respectively. Data were represented as heatmap in Figure 2A.
ANOVA was
performed on each four independent experimental proteome datasets to confirm
the homogeneity of the four independent experimental datasets. All of the P-values
obtained were greater than 0.05, indicating that there was a good agreement
between all of the datasets derived from one same sample. Thus, we were able to
use independent-samples Student’s t-test to analyze the differences
between RCS and controls from each age cohort based on these datasets. Two
separate comparisons between RCS and CON were performed based on pooled
proteome datasets sample #1 and sample #2. Only proteins with a P<0.05
in both samples were considered to be statistically significant. Four hundred
thirty-four significant DEPs were identified in this study. Specifically, the
numbers of DEPs were 201, 115, 104 and 109 for 18, 24, 30 and 36d cohorts,
respectively.
To check the
housekeeping proteins, 304 housekeeping proteins have been identified,
including the ribosomal proteins, histones, translation factors, tRNA
synthetases, heat shock proteins, cell cycle proteins, and citric acid cycle
enzymes. Despite a few proteins (less than 7%) having a slight significant
differential regulation at each age cohort, most of the housekeeping proteins
have relatively steady abundance levels, e.g. Tpi1, Sdha, H2afz/H2afv,
Rpsa, Atp1b2/Atp2b1/Atp5o/Atp6v1a, etc. (Figure 2B). These results
further demonstrated the quality of MS data and convinced us that the proteome
datasets from RCS rat are indeed controlled with the properly timed normal
congenic controls at every given time point.
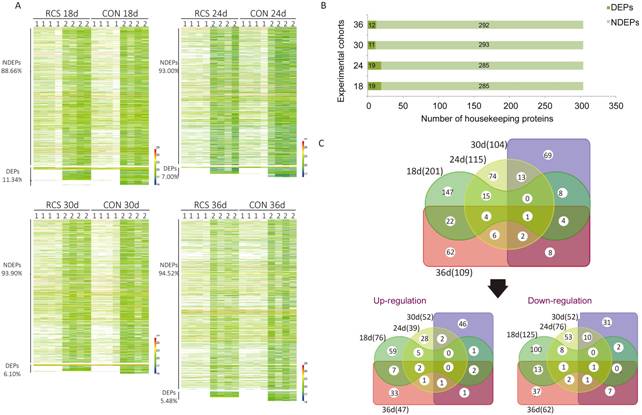
Figure 2
Significantly differentially expressed proteins identified by MaxLFQ A total of 2375 protein groups were
discovered by MaxLFQ. Specifically, 1746, 1658, 1704 and 2006 protein groups
were discovered in the 18, 24, 30 and 36d age cohorts, respectively. Student’s t-test
was performed using IBM SPSS statistics, and proteins with a P-value
<0.05 in both samples were considered as statistically significant. There
were 201, 115, 104 and 109 significantly differentially expressed proteins
(DEPs) in the 18, 24, 30 and 36d age cohorts, respectively(A). 304 housekeeping
proteins were observed in this study. Fewer of them showed differential
abundance (B). The Venn diagram shows the number of DEPs in each age cohort,
and the overlap among the four age cohorts is also shown (C).
Of the total
434 protein groups, up regulation was observed in the abundance of 76, 39, 52
and 47 proteins (18, 24, 30 and 36d cohort, respectively), while down
regulation was observed in 125, 76, 52 and 62 proteins (Figure 2C). One protein
groups (Clic 6, a member of chloride intracellular channel family which is best
known for interaction with D -like receptors) displayed statistically
significantly down-regulation in abundance levels (P<0.05) through
all four age cohorts. One protein groups (Sugt1, protein SGT1 homolog which may
play a role in ubiquitination and subsequent proteasomal degradation of target
proteins) displayed statistically significantly down-regulation and one protein
(Hp1bp3, Heterochromatin protein 1-binding protein 3which is component of
heterochromatin and may play a role in hypoxia-induced oncogenesis) displayed
statistically significantly up-regulation in abundance levels (P<0.05)
in the last three age cohorts (24, 30 and 36d).
Enrichment
Analysis of GO Annotation and KEGG Pathway
Using
the PANTHER gene analysis tools, these DEPs were parsed into six major
subcellular components, composed of the cell projection, cytoplasm, nucleus,
organelle, plasma membrane and extracellular region. Subsequently, their
location in detailed cytoplasmic structures was also determined (Figure 3A).
The cytosol (132 proteins), mitochondrion (98 proteins) and cytoskeleton (72
proteins) occupy the highest proportion of total DEPs. Specifically, 37
proteins were localized on the mitochondrial membrane (25 proteins on the inner
membrane and 10 proteins on the outer membrane), five proteins were localized
in the mitochondrial intermembrane space and 16 proteins localized in the mitochondrial
matrix.
To obtain
biological information on their cellular component (CC), molecular function
(MF) and biological process (BP) of the DEPs between RCS and control, we
subjected the total 434 DEPs to GO enrichment analysis with STRING search engine.
The enriched GO CC annotation also suggested that extracellular exosome,
cytosol, membrane, cytoplasm and mitochondrion were identified as the top five
enriched categories (P<0.001) (Figure 3B). However, we were not
surprised to find that photoreceptor outer segment and photoreceptor inner
segment, locations where retinal degenerative changes primarily occur at early
stage, were also demonstrated as significantly over-represented subcellular
locations.
Furthermore,
we have carried out GO BP and MF enrichment analyses. Intracellular protein
transport, glycolytic process and glutathione metabolic process were ranked as
the top 3 GO BP categories (P<0.001), suggesting the prominent
biological meaning of cytosol and mitochondrion in the disease (Figure 3C). Glycolytic
process is a chemical reaction of converting a carbohydrate into pyruvate and
generating concomitant production of small amounts of ATP and NADH, and the
central pathway that produces important precursor metabolites such as
six-carbon compounds, three-carbon compounds and Acetyl-CoA. Dysfunction of
glycolytic process may be the reason inducing cellular metabolic disorders and
eventually cell apoptosis. Glutathione, the tripeptide
glutamylcysteinylglycine, has a specific role in the reduction of hydrogen
peroxide (H2O2) and oxidized ascorbate. Dysfunction of
glutathione metabolic process implied the content change of reactive oxygen
species (ROS).
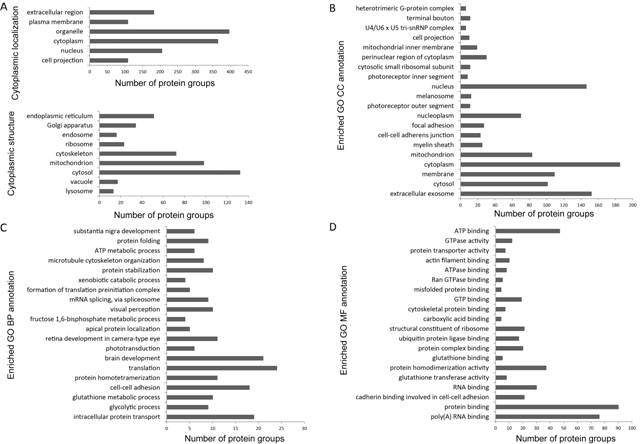
Figure 3
Functional enrichment analysis of GO annotation The data are presented as bar charts
showing the distribution patterns of proteins in six major subcellular
components (search in PANTHER database), including the cell projection,
cytoplasm, nucleus, organelle, plasma membrane and extracellular region, and
more specifically, the distribution patterns of proteins in detailed
cytoplasmic structures (A). The top 20 significantly enriched GO cellular
component (CC) categories (B), biological process (BP) categories (C) and
molecular function (MF) categories (D) are shown (search in STRING database). Data
was ranked by P-value corrected with the Boniferroni method.
Enrichment
analysis of GO MF indicated that poly (A) RNA binding, protein binding and
cadherin binding involved in cell-cell adhesion (P<0.001) were ranked
as the top three molecular function categories (Figure 3D). What should be
noteworthy is that glutathione transferase activity and glutathione binding
were also detected as over-represented categories, which may be activated as an
antioxidant.
Moreover, to
explore the metabolic pathways of DEPs, enriched KEGG pathway analysis on the
total 434 DEPs has been performed. Top 20 enriched KEGG pathways are shown in
Figure 4A. As expected, phototransduction was ranked to the top with highest
enrichment significance (P=2.40e-7). The progressively loss of rod and
cone photoreceptors surely led to dysfunction of photo transduction pathway
which is accomplished by photoreceptor. Several proteins that participated in
phototransduction process, such as Gngt1, Rcvrn, Guca1a, Gnat1, Rgs9 and
Guca1b, have a significant down-regulation in 30d and 36d cohort, while other
proteins, such as Pde6a, Gucy2f, Gucy2e/Gucy2d, Rho, Sag, Grk1, Cnga1, Cngb1
and Slc24a1, were identified as significant down-regulation only in sample #2
with a non-significant down-regulation in sample #1.
In addition,
carbon metabolism, especially glycolysis/gluconeogenesis, was also detected as
over-represented category with high enrichment significance (P<0.001).The
enrichment analysis of KEGG pathways for each age cohort indicated that at early
stages (18d and 24d cohort), glycolysis/gluconeogenesis was identified as the
most prominent pathway, suggesting the important role of
glycolysis/gluconeogenesis in the initiation and occurrence of retinal
dystrophy. In addition, subsequently in the 30d and 36d cohort,
phototransduction becomes the major significantly abnormal pathway, indicating
the progressively loss of rod and cone photoreceptors with the development of
retina degenerative (Figure 4B). Specifically, enzymes involved in glycolysis/gluconeogenesis
pathway, including Hk1/Hk2, Pfkl/Pfkp, Aldoc, Gaphd, Eno2 and Dld, have a
significant up-regulation in protein abundance level in 18d cohort (Figure 4C).
What is more, the conversion of three-carbon compounds from glyceraldehyde-3P
to pyruvate is the core part of biosynthesis of amino acid, which is also
detected as an over-represented pathway with high enrichment significance (P<0.001).
However, the abundance of these significant up-regulated proteins was nearly
normal in subsequent age cohorts. Enriched GO CC and BP analysis on DEPs in 18d
cohort are shown in Figure 4D. Extracellular exosome, cytosol, membrane,
mitochondrion and cytoplasm were identified as top five enriched CC, while
glycolytic process, glutathione metabolic process, cell-cell adhesion,
translation and ATP metabolic process were identified as top five enriched BP.

Figure 4
Enriched KEGG pathway analysis of significantly differentially expressed
proteins and mapping of the glycolysis/gluconeogenesis pathway Enriched KEGG pathways categories
were presented as a bar chart of 20 over-represented pathways. Carbohydrate
metabolism pathways (16 DEPs), especially glycolysis/gluconeogenesis (13 DEPs),
has drawn great attention with a high enrichment significance (A). The top five
enriched KEGG pathways annotation for each age cohort show that the protein
groups involved in glycolysis/gluconeogenesis pathway may play an important
role at early stage of retinitis pigmentosa (B). In 18d cohort, the DEPs
involved in glycolysis/ gluconeogenesis were significantly up-regulated (C).
Enrichment analysis of GO CC and BP annotation in 18d cohort were presented as
a bar chart (D). Data were ranked by P-value corrected with the
Boniferroni method.
Upstream
Regulatory Analysis To predict the upstream
transcription factors of the identified DEPs, DEP data were input into the X2K
software. We obtained a set of enriched upstream regulators, including
transcription factor MYC, E2F1 and CCND1 (Figure 5A). MYC, E2F1 and CCND1
regulate the abundance level of a large amount of DEPs. E2F1, a transcription
factor which mediates cell proliferation and TP53/p53-dependent apoptosis, is
mainly responsible for regulation of enzymes participated in carbon metabolism
and biosynthesis of amino acid in this study (Figure 5B). Given that carbon
metabolism and biosynthesis of amino acid were the major over-represented
pathways in 18d and 24d cohorts, we supposed that E2F1 is the key regulator in
rod and cone photoreceptors apoptosis at early stage of RP. The difference in
the expression of E2F1 was further verified by Western blotting analysis
(Figure 5C). As predicted, E2F1 were significantly up-regulated in RCS.
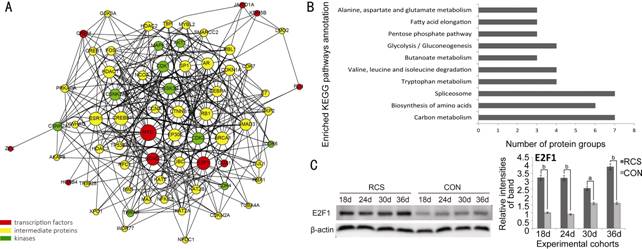
Figure 5
Upstream regulatory analysis of significantly differentially expressed proteins
and verification by Western blot Of all of
the candidate transcription factors, MYC, E2F1 and CCND1 occupied the highest
proportion of the upstream regions of the differentially expressed proteins
(A). Enriched KEGG pathway analysis on DEPs regulated by E2F1 is presented as a
bar chart (B). Western blot analysis with E2F1 antibody was performed. Data are
shown as mean±SD from three densitometry evaluation; aP<0.05;
bP<0.005. β-actin was used for internal control (C).
DISCUSSION
RCS rat is an
animal model of RP that share similar pathological processes observed in RP
patients, thereby providing a unique model to study the early biochemical
changes in this disease. In this study, we are the first performing a
systematic comparative proteomics analysis based on orbitrap MS/MS label-free
quantification approach on dystrophic RCS rats and non-dystrophic congenic
controls, with the aim of finding out the candidate initiation factors and
regulators that are involved in early disease aetiology. To overcome error from
biological variance and technical variance, two separate protein lysate samples
consisting of four retinas each (obtained from two individual rats) per
genotype were analyzed at four different age cohorts. This strategy of sample
subpooling preparation could not only reduce biological variance by averaging
discrepancies from each individual, but also conduct the appropriate
comparative analysis on retina proteome from RCS rats and normal congenic
controls[29-32].
In this study,
we identified a total of 2375 retinal protein groups from RCS rats by MaxLFQ
algorithm integrated in MaxQuant search engine. 434 protein groups were
identified as significantly difference in abundance from the normal controls,
and about half of them were discovered in the 18 d cohort, suggesting that many
complicated biochemical reactions primarily occurred at the early stage of
disease, with the result of relevant pathological processes such as rod and
cone photoreceptors cell death. Approximately 1/4 of DEPs were localized in the
mitochondrion, and in detail, approximately 1/4 of them were located on the
inner membrane, which is the site for oxidative phosphorylation. On the other
hand, cytosol and membrane proteins were also occupy over 1/4 of DEPs. In the
enrichment analysis of KEGG pathway, phototransduction was identified as the
most enriched pathway with significantly down-regulation, as no surprise. In
addition, glycolysis/gluconeogenesis was also identified as over-represented
pathway. This metabolic pathway was also detected as the most prominent pathway
in 18d and 24d cohort. Certain cytosolic proteins that participated in the
glycolysis/gluconeogenesis pathway were significantly up-regulated in the 18d
cohort. Glycolytic process and glutathione metabolic process were also detected
as enriched BP in 18d cohort. Combination of the above enriched GO annotation
and KEGG pathway analysis result suggested that mitochondrial dysfunction and
abnormalities in glycolytic metabolism and biological oxidation are likely to
play an important role in retinal remodeling and degeneration, especially in
the early stages of the disease.
In addition to
their critical role in life support, mitochondria are also involved in
apoptosis and have been implicated in neurodegenerative diseases, including
Parkinson’s disease, Huntington’s disease, Alzheimer’s disease and neuropathy
ataxia RP[33]. Several studies on the role of
mitochondria in neurodegenerative diseases have already been reported. For
example, Sanges et al[34] identified two
apoptotic pathways involving the mitochondria and endoplasmic reticulum in
degenerating neurons in Rd1, another model animal of RP. In our study, abnormal
expressed proteins in mitochondria were pretty significant. Thus, we
hypothesize that mitochondrial dysfunction is the key initiation factor in RP.
In RCS rat retina, mertk gene mutation in the RPE causes a failure to
phagocytosis the outer rod segment discs that have been shed, which leads to an
accumulation of outer rod segment debris. As a result, rod photoreceptor
stopped developing and started degenerating before cellular maturation
completes. During rod photoreceptor degeneration, damage may presented in
mitochondria, leading to increased generation of ROS, which can aggravate
cellular inflammation and injury[35]. With the
increasing generation of ROS, rod and cone photoreceptors underwent apoptosis
or programmed cell death[36-37].
Moreover, mitochondrial dysfunction could also cause an imbalance of calcium
homeostasis, or the release of cytochrome C into the cytosol, which can bind to
Apaf1 and pro-caspase 9 to form the apoptosome and give rise to a downstream
caspase cascade, ultimately resulting in cell apoptosis[38].
Mitochondrial
dysfunction can also impact the energy metabolism. As is well known, the
mitochondrion is the most prominent site of energy production for cell.
Impairment of mitochondria would lead to decreased generation of energy
currency of the cell, i.e. ATP, resulting in compensatory hyperactive of
glycolytic process. Glycolysis pathway is another crucial energy metabolic
pathway taking place in cytoplasm, and generating small amounts of ATP and
NADH. It is the process of converting glucose into pyruvate, an important
precursor metabolite for Acetyl-CoA, which is produced by the oxidative
decarboxylation of pyruvate in the TCA cycle[39-40]. In this study, we observed a significant
up-regulation in enzymes involved in glycolysis pathways at 18d cohort. We
supposed that it might be the result of mitochondrial dysfunction. However,
with the progressive loss of rod and cone photoreceptor, the compensatory
effect of glycolysis decreased, and finally became decompensatory. In addition, photo transduction later began
to reach dysfunction. Furthermore, rod and cone photoreceptor cell death would
lead to decreased rod oxygen consumption and hyperoxia within the retina,
resulting in more increased generation of ROS.
Upstream
regulatory analysis on total DEPs indicated that E2F1 plays a potential role in
the retinal degenerative process in RCS rats. The up-regulation of E2F1 in RCS
rat at 18d cohort has been verified by Western blot analysis. Thus, we wonder
if abnormal hyperactivity of E2F1 was the key regulator in occurrence of retina
degenerative. A recent study by Zencak et al[41]
seems to confirm our conjecture. His research demonstrated that deletion of
E2F1 transiently prevented photoreceptor loss in the Rd1 mouse model.
Furthermore, E2F1 has been shown to contribute to neuronal death in Parkinson’s
disease[42]. Given that E2F1 plays a central role
in regulating the cell cycle, it may participate in neuronal death in various
neurodegenerative diseases, including RP. E2F1 may be a potential therapeutic
molecular target in RP.
Since great
progress has been made in new instrumentation developments, fragmentation
methods and retrieval strategies, mass spectrometry-based label-free
quantification proteomics has become an indispensable technology for insights
into complex BP such as physiological/pathological metabolism in disease. With
the high sensitivity, high mass accuracy, good dynamic range, and the ability
to perform large-scale analyses, we could profile the comparative proteomics in
retina between dystrophic RCS rats and non-dystrophic congenic controls for
in-depth analysis of underlying disease mechanism. However, qualitatively and
quantitatively of label free proteomics remains an enormous challenge. Other
than labelling methods such as iTRAQ, Label-free quantitation strategies
required that sample must be analysed repeatedly for a high level of
reproducibility and reliability. In this study, low detection rate and
repetition rate of many low abundance proteins was often confused. It is very
important to increase the number of biological and technical replicates to
generate robust results.
In conclusion,
comparative proteomic analysis can enable the identification of protein
differences between two samples, especially with the help of rapidly growing
bioinformatics technologies. Further development of these technologies will
undoubtedly increase the analytic depth and width of scientific research. Our
study demonstrates the critical abnormality of mitochondria and transcription
factor E2F1 in the initiation of RP. Additional studies are required to
validate these results and elucidate the molecular mechanism underlying RP.
ACKNOWLEDGEMENTS
We would like
to thank Dr. Huang Y and Kuang YS for their help with MS analysis.
Foundations:
Supported
by the National Nature Science
Foundation of China (No.81130017); National Basic Research Program of
China (973 Program, No.2013CB967002).
Conflicts
of Interest: Zhu ZH, None; Fu Y, None; Weng CH, None; Zhao CJ,
None; Yin ZQ, None.
REFERENCES
1 Liu MM, Zack DJ. Alternative splicing and retinal
degeneration. <ii>Clin Genet</ii> 2013;84(2):142-149. [PMC free article] [PubMed]
2 Daiger SP, Sullivan LS, Bowne SJ. Genes and
mutations causing retinitis pigmentosa. <ii>Clin Genet</ii>
2013;84(2):132-141. [PMC free article] [PubMed]
3 Ripps H. Cell death in retinitis pigmentosa: gap
junctions and the 'bystander' effect. <ii>Exp Eye Res</ii>
2002;74(3):327-336. [PubMed]
<no>4 Hartong DT, Berson EL, Dryja TP. Retinitis
pigmentosa. <ii>Lancet</ii> 2006;368(9549):1795-1809.[CrossRef]
5 Sullivan LS, Koboldt DC, Bowne SJ, Lang S, Blanton
SH, Cadena E, Avery CE, Lewis RA, Webb-Jones K, Wheaton DH, Birch DG, Coussa R,
Ren H, Lopez I, Chakarova C, Koenekoop RK, Garcia CA, Fulton RS,Wilson RK,
Weinstock GM, Daiger SP. A dominant mutation in hexokinase 1 (HK1) causes
retinitis pigmentosa. <ii>Invest Ophthalmol Vis Sci</ii>
2014;55(11):7147-7158. [PMC free article] [PubMed]
6 Comitato A, Sanges D, Rossi A, Humphries MM, Marigo
V. Activation of Bax in three models of retinitispigmentosa. <ii>Invest
Ophthalmol Vis Sci</ii> 2014;55(6):3555-3562. [PubMed]
7 Ikeda HO, Sasaoka N, Koike M, Nakano N, Muraoka Y,
Toda Y, Fuchigami T, Shudo T, Iwata A, Hori S,Yoshimura N, Kakizuka A. Novel
VCP modulators mitigate major pathologies of rd10, a mouse model of retinitis
pigmentosa. <ii>Sci Rep</ii> 2014;4:5970. [PMC free article] [PubMed]
8 Hartong DT, Dange M, McGee TL, Berson EL, Dryja TP,
Colman RF. Insights from retinitis pigmentosa into the roles of isocitrate
dehydrogenases in the Krebs cycle. <ii>Nat Genet</ii>
2008;40(10):1230-1234. [PMC free article] [PubMed]
9 Tso MO, Zhang C, Abler AS, Chang CJ, Wong F, Chang
GQ, Lam TT. Apoptosis leads to photoreceptor degeneration in inherited retinal
dystrophy of RCS rats. <ii>Invest Ophthalmol Vis Sci</ii>
1994;35(6):2693-2699. [PubMed]
<no>10 D'Cruz PM, Yasumura D, Weir J, Matthes
MT, Abderrahim H, LaVail MM, Vollrath D. Mutation of the receptor tyrosine
kinase gene Mertk in the retinal dystrophic RCS rat. <ii>Hum Mol
Genet</ii> 2000;9(4):645-651.[CrossRef]
<no>11 Strauss O, Stumpff F, Mergler S, Wienrich
M, Wiederholt M. The Royal College of Surgeons rat: an animalmodel for
inherited retinal degeneration with a still unknown genetic defect.
<ii>Acta Anat (Basel)</ii> 1998;162(2-3):101-111.[CrossRef]
12 Ning K, Fermin D, Nesvizhskii AI. Comparative
analysis of different label-free mass spectrometry based protein abundance
estimates and their correlation with RNA-Seq gene expression data. <ii>J
Proteome Res</ii> 2012;11(4):2261-2271. [PMC free article] [PubMed]
13 Hu Q, Noll RJ, Li H, Makarov A, Hardman M, Graham
Cooks R. The Orbitrap: a new mass spectrometer. <ii>J Mass
Spectrom</ii> 2005;40(4):430-443. [PubMed]
14 Cheng FY, Blackburn K, Lin YM, Goshe MB, Williamson
JD. Absolute protein quantification by LC/MS(E) forglobal analysis of salicylic
acid-induced plant protein secretion responses. <ii>J Proteome
Res</ii> 2009;8(1):82-93. [PubMed]
15 Polpitiya AD, Qian WJ, Jaitly N, Petyuk VA, Adkins
JN, Camp DG 2nd, Anderson GA, Smith RD. DAnTE: a statistical tool for
quantitative analysis of -omics data. <ii>Bioinformatics</ii>
2008;24(13):1556-1558. [PMC free article] [PubMed]
16 Kikuchi T, Hassanein M, Amann JM, Liu Q, Slebos RJ,
Rahman SM, Kaufman JM, Zhang X, Hoeksema MD,Harris BK, Li M, Shyr Y, Gonzalez
AL, Zimmerman LJ, Liebler DC, Massion PP, Carbone DP. In-depth
proteomicanalysis of nonsmall cell lung cancer to discover molecular targets
and candidate biomarkers. <ii>Mol Cell Proteomics</ii>
2012;11(10):916-932. [PMC free article] [PubMed]
17 Cox J, Mann M. MaxQuant enables high peptide
identification rates, individualized p.p.b.-range mass accuracies and
proteome-wide protein quantification. <ii>Nat Biotechnol</ii>
2008;26(12):1367-1372. [PubMed]
18 Cox J, Hein MY, Luber CA, Paron I, Nagaraj N, Mann
M. Accurate proteome-wide label-free quantification bydelayed normalization and
maximal peptide ratio extraction, termed MaxLFQ. <ii>Mol Cell
Proteomics</ii> 2014;13(9):2513-2526. [PMC free article] [PubMed]
19 Vizcaíno JA, Deutsch EW, Wang R, Csordas A,
Reisinger F, Ríos D, Dianes JA, Sun Z, Farrah T, Bandeira N, Binz PA, Xenarios
I, Eisenacher M, Mayer G, Gatto L, Campos A, Chalkley RJ, Kraus HJ, Albar JP,
Martinez-Bartolomé S, Apweiler R, Omenn GS, Martens L, Jones AR, Hermjakob H.
ProteomeXchange provides globally coordinated proteomics data submission and
dissemination. <ii>Nat Biotechnol</ii> 2014; 32(3):223-226. [PMC free article] [PubMed]
20 Vizcaíno JA, Csordas A, del-Toro N, Dianes JA,
Griss J, Lavidas I, Mayer G, Perez-Riverol Y, Reisinger F, Ternent T, Xu QW,
Wang R, Hermjakob H. 2016 update of the PRIDE database and its related tools.
<ii>Nucleic Acids Res </ii>2015;44(1):D447-D456. [PMC free article] [PubMed]
21 Deng W, Wang Y, Liu Z, Cheng H, Xue Y. HemI: a
toolkit for illustrating heatmaps. <ii>PLoS One</ii>
2014;9(11):e111988. [PMC free article] [PubMed]
22 Mi H, Muruganujan A, Casagrande JT, Thomas PD.
Large-scale gene function analysis with the PANTHER classification system.
<ii>Nat Protoc</ii> 2013;8(8):1551-1566. [PubMed]
23 Mi H, Muruganujan A, Thomas PD. PANTHER in 2013:
modeling the evolution of gene function, and other gene attributes, in the
context of phylogenetic trees. <ii>Nucleic Acids Res</ii>
2013;41(Database issue):D377-D386. [PMC free article] [PubMed]
24 Szklarczyk D, Franceschini A, Wyder S, Forslund K,
Heller D, Huerta-Cepas J, Simonovic M, Roth A, SantosA, Tsafou KP, Kuhn M, Bork
P, Jensen LJ, von Mering C. STRING v10: protein-protein interaction networks,
integrated over the tree of life. <ii>Nucleic Acids Res</ii>
2015;43(Database issue):D447-D452. [PMC free article] [PubMed]
25 Kanehisa M, Sato Y, Kawashima M, Furumichi M,
Tanabe M. KEGG as a reference resource for gene and protein annotation.
<ii>Nucleic Acids Res</ii> 2016;44(D1):D457-D462. [PMC free article] [PubMed]
26 Lachmann A, Xu H, Krishnan J, Berger SI, Mazloom
AR, Ma'ayan A. ChEA: transcription factor regulation inferred from integrating
genome-wide ChIP-X experiments. <ii>Bioinformatics</ii>
2010;26(19):2438-2444. [PMC free article] [PubMed]
27 Chen EY, Xu H, Gordonov S, Lim MP, Perkins MH,
Ma'ayan A. Expression2Kinases: mRNA profiling linked to multiple upstream
regulatory layers. <ii>Bioinformatics</ii> 2012;28(1):105-111. [PMC free article] [PubMed]
<no>28 Schneider CA, Rasband WS, Eliceiri KW.
NIH Image to ImageJ: 25y of image analysis. <ii>Nat Methods</ii>
2012;9(7):671-675.[CrossRef]
29 Karp NA, Lilley KS. Investigating sample pooling
strategies for DIGE experiments to address biological variability.
<ii>Proteomics</ii> 2009;9(2):388-397. [PubMed]
30 Molloy MP, Brzezinski EE, Hang J, McDowell MT,
VanBogelen RA. Overcoming technical variation and biological variation in
quantitative proteomics. <ii>Proteomics</ii> 2003;3(10):1912-1919.
[PubMed]
31 Castaño EM, Roher AE, Esh CL, Kokjohn TA, Beach T.
Comparative proteomics of cerebrospinal fluid in neuropathologically-confirmed
Alzheimer's disease and non-demented elderly subjects. <ii>Neurol
Res</ii> 2006;28(2):155-163. [PubMed]
32 Weinkauf M, Hiddemann W, Dreyling M. Sample pooling
in 2-D gel electrophoresis: a new approach to reduce nonspecific expression
background.<ii> Electrophoresis</ii> 2006;27(22):4555-4558. [PubMed]
33 Kwong JQ, Beal MF, Manfredi G. The role of
mitochondria in inherited neurodegenerative diseases. <ii>J
Neurochem</ii> 2006;97(6):1659-1675. [PubMed]
34 Sanges D, Comitato A, Tammaro R, Marigo V.
Apoptosis in retinal degeneration involves cross-talk between
apoptosis-inducing factor (AIF) and caspase-12 and is blocked by calpain
inhibitors. <ii>Proc Natl Acad Sci</ii> <ii>U S A</ii>
2006;103(46):17366-17371. [PMC free article] [PubMed]
35 Sedeek M, Nasrallah R, Touyz RM, Hébert RL. NADPH
oxidases, reactive oxygen species, and the kidney: friend and foe. <ii>J
Am Soc Nephrol</ii> 2013;24(10):1512-1518. [PMC free article] [PubMed]
36 Komeima K, Rogers BS, Lu L, Campochiaro PA.
Antioxidants reduce cone cell death in a model of retinitis pigmentosa.
<ii>Proc Natl Acad Sci U S A</ii> 2006;103(30):11300-11305. [PMC free article] [PubMed]
37 Shen J, Yang X, Dong A, Petters RM, Peng YW, Wong
F, Campochiaro PA. Oxidative damage is a potential cause of cone cell death in
retinitis pigmentosa. <ii>J Cell Physiol</ii> 2005;203(3):457-464.
[PubMed]
<no>38 Danial NN, Korsmeyer SJ. Cell death:
critical control points. <ii>Cell</ii> 2004;116(2):205-219.[CrossRef]
39 Krebs HA. The citric acid cycle: a reply to the
criticisms of F. L. Breusch and of J. Thomas. <ii>Biochem J</ii>
1940;34(3):460-463. [PMC free article] [PubMed]
<no>40 Kay J, Weitzman PDJ. Krebs' citric acid
cycle: half a century and still turning. <ii>Biochemical
Society</ii> 1987.</no>
41 Zencak D, Schouwey K, Chen D, Ekstrom P, Tanger E,
Bremner R, van Lohuizen M, Arsenijevic Y. Retinal degeneration depends on Bmi1
function and reactivation of cell cycle proteins. <ii>Proc Nat Acad Sci U
S A</ii> 2013;110(7):E593-E601. [PMC free article] [PubMed]
42 Höglinger GU, Breunig JJ, Depboylu C, Rouaux C,
Michel PP, Alvarez-Fischer D, Boutillier AL, Degregori J, Oertel WH, Rakic P,
Hirsch EC, Hunot S. The pRb/E2F cell-cycle pathway mediates cell death in
Parkinson's disease. <ii>Proc Natl Acad Sci U S A</ii>
2007;104(9):3585-3590. [PMC free article] [PubMed]