
・Clinical
Research・Current
Issue・ ・Achieve・ ・Search Articles・ ・Online Submission・ ・About IJO・ PMC
Peptidome profiling of human serum
of uveal melanoma patients based on magnetic bead fractionation and mass
spectrometry
Xiang-Yu Shi1,2, Qing Li 2, Wen-Bin Wei2,
Li-Ming Tao1
1Department of
Ophthalmology, the Second Hospital Affiliated to Anhui Medical University,
Hefei 230601, Anhui Province, China
2Beijing Tongren Eye
Center, Beijing Tongren Hospital, Capital Medical University, Beijing
Ophthalmology & Visual Science Key Laboratory, Beijing 100730, China
Correspondence
to: Li-Ming
Tao. Department of Ophthalmology, the Second Hospital Affiliated to Anhui
Medical University, Hefei 230601, Anhui Province, China. taolimingchina@126.com
Received:
2016-08-06
Accepted: 2017-02-14
Abstract
AIM: To find new
biomarkers for uveal melanoma (UM) by analyzing the serum peptidome profile.
METHODS: Proteomic
spectra in patients with UM before and after operation were analyzed and
compared with those of healthy controls. Magnetic affinity beads were used to
capture serum peptides and matrix-assisted laser desorption/ionization
time-of-flight (MALDI-TOF) mass spectrometer were used to compile serum peptide
profiles.
RESULTS: A panel of 49
peptides were differentially expressed between UM patients and controls, of
which 33 peptides were of higher intensities in patient group and 16 peptides
were of higher intensities in control group. Based on combined use of these
potential markers, peptides with mean molecular masses of 1467 and 9289.0 Da
provide high sensitivity (83.3%), specificity (100%) and accuracy rate (93.0%)
together to differentiate melanoma patients from healthy controls. At the time
point of 6mo postoperatively, the levels of many peptides differentially
expressed before surgery showed no more statistical difference between the patients
and the control group. Fibrinogen α-chain precursors were identified
as potential UM markers.
CONCLUSION: We have shown
that a convenient and fast proteomic technique, affinity bead separation and
MALDI-TOF analysis combined with bioinformatic software, facilitates the
identification of novel biomarkers for UM.
KEYWORDS: uveal melanoma; protein
biomarker; peptidome profile; magnetic bead fractionation; mass spectrometry
DOI:10.18240/ijo.2017.06.17
Citation: Shi XY, Li
Q, Wei WB, Tao LM. Peptidome profiling of human serum of uveal melanoma
patients based on magnetic bead fractionation and mass spectrometry. Int J
Ophthalmol 2017;10(6):939-947
Article
Outline
INTRODUCTION
Uveal melanoma
(UM) is the most common malignant intraocular tumor in adult humans, with an
annual incidence of 0.31 (Black), 0.38 (Asian), 1.67 (Hispanic) and 6.02
(non-Hispanic white) per million population[1].
Despite the high accuracy of clinical diagnosis and advances in local
treatment, more than 50% of UM patients develop metastasis within 10-year of
initial diagnosis[2]. The prognosis for these
metastatic patients is very poor; thus, it is clinically important to find
clinical and molecular biomarkers for early disease detection and evaluation of
metastatic potential of UM.
With the
advancement of profiling methodologies in the past decades, gene expression and
protein levels in tissues and body fluids can be monitored closely and globally
during the course of human diseases. Recently, proteometric technologies
identified many UM-related proteins and peptides[3].
Early in 2001, on the basis of two proteins with molecular weights (MW) of
4543.43 and 6853.30 Da, Missotten et al[4]
could distinguish aqueous humor of melanoma eyes from control eyes in 89% of
cases. Pardo et al’s[5] research team
conducted the first proteomic analysis of UM cells by using two-dimensional
electrophoresis (2-DE) and mass spectrometry (MS), representing the first step
towards the establishment of a UM protein database as a valuable resource for
the study of this malignancy. Later research into the proteomics of primary UM
cell cultures and cell lines had suggested the involvement of cell adhesion
protein MUC18 and HMG-1 in the invasion potential of UM cells[6].
Overexpression of the oncogene DJ-1 was also noted to be an indicator of this
malignancy. However, the in vitro environment created by standard
cell-culture procedures does not properly replicate in vivo conditions[7].
In proteomics,
it is well accepted that plasma or serum is the ultimate diagnostic fluid. A
blood sample represents the summation of metabolic events in a wide variety of
fluids and tissues and thus offers the opportunity to assess the status of an
individual’s health. Cancer cells release protein biomarkers into the
extracellular environment and some of these products can end up in the
bloodstream and serve as potential serum biomarkers. Therefore, we conduct the
current study to analyze the proteomics of serum samples of UM patients before
and after tumor removal surgery and compare to healthy controls.
SUBJECTS AND METHODS
The
institutional review board of the Second Hospital Affiliated to Anhui Medical
University and the Beijing Tongren Hospital approved the study, and the
protocol adheres to the tenets of the Declaration of Helsinki. Written informed
consent was obtained for each patient prior to enrollment into the study.
Patients
and Blood Sample Preparation A total of 18 patients (10
men and 8 women) with a clinical diagnosis of UM (17 of choroidal melanoma and
1 of ciliary melanoma) at the Tongren Eye Center of Beijing Tongren Hospital
(Beijing, China) were recruited for this study. The mean age was 39.4y (range
21-67y). All of the patients underwent transscleral or transretinal local
resection (11 cases) or enucleation (7 cases) of the affected eyes. Systemic
evaluation to screen out contraindications for operation and metastatic lesions
were also performed. Tissues or eyeballs acquired from the surgery were sent
for immunohistochemical examinations and all confirmed UM of which 17 cases
were of spindle cell type and 1 case of epithelioid cell type.
Venous blood
samples were drawn after patients’ fasting for at least 6h in pre-surgery
mornings and obtained in a 5 mL BD vacutainer®, glass red-top tubes.
After sample collection, the tubes are then allowed to clot at room temperature
for no more than 4h (2-3h mostly) and centrifuged at 3000 rpm for 20min at room
temperature. Sera (the upper phase) were transferred to five 0.5 mL Eppendorf
tubes with approximately 200 μL serum in each and frozen at -80℃ for future
use.
Blood samples
from 25 healthy individuals (13 men; mean age 33.8y) with no known malignancies
were also collected, prepared and stored at Beijing Tongren Hospital following
the same collection procedures.
After surgery,
the patients were followed for ocular and systemic checkup at regular
intervals. Fasting blood samples were collected at one month (15 cases; mean
interval after surgery, 39.5d) and six months (10 cases; mean interval after
surgery, 182.5d) post-operatively.
Magnetic
Bead Fractionation For proteome
fractionation, serum samples were thawed at room temperature for 15min and
processed with ClinProt purification reagent sets from Bruker Daltonics
immediately. Three types of functionalized magnetic beads (MB) including
MB-hydrophobic interaction chromatography (MB-HIC C8), MB-weak-cation-exchange
chromatography (MB-WCX) and MB-immobilized metal ion affinity chromatography
containing copper ions (MB-IMAC Cu) beads were chosen initially to test their
affinity capabilities on two randomly selected serum samples of a UM patient.
MB-IMAC Cu beads managed to capture the largest number of peptide peaks
compared with the other two functionalized beads and hence were utilized for
the proteome fractionation in this study.
MB facilitated
proteome fractionation was carried out as per the manufacturer’s instructions.
We diluted 5 μL of sample with 10 μL of a binding solution added to the bead
slurry (5 μL) in a 0.2 mL polypropylene tube, mixed thoroughly by pipetting up
and down several times, and incubated the tube for 1min. To separate the
unbound solution, the tube was placed in a MB separator and the supernatant was
removed carefully with a pipette. MBs were then washed three times with 100 μL
wash buffer. Following binding and washing, the bound proteins/peptides were
eluted from the MB with 5 μL of an acetonitrile-water (1:1 by volume). A
portion of the eluted sample was diluted 1:10 in matrix solution comprised of
α-cyano-4-hydroxycinnamic acid (HCCA, 0.6 g/L in 2:1 ethanol:acetone). Then 0.5
μL of the resulting mixture was spotted on the AnchorChipTM target
(Bruker Daltonics, Germany) and allowed to air dry for approximately 5min at
room temperature.
Matrix-assisted
Laser Desorption/Ionization Time-of-flight Mass Spectrometry For the proteome analysis, a linear
matrix-assisted laser desorption/ionization time-of-flight (MALDI-TOF) MS
(Autoflex, Bruker Daltonics) was used with the following settings: ion source
1, 20.00 kV; ion source 2, 18.80 kV; lens, 6.60 kV; pulsed ion extraction,
100ns. Ionization was achieved by irradiation with a nitrogen laser operating
at 20 Hz. For matrix suppression, we used a high gating factor with signal
suppression up to 600 Da. Mass spectra were detected in linear positive mode.
Mass calibration was performed with the calibration mixture of peptides and proteins
in a mass range of 800-20 000 Da. All signals with a signal-to-noise (S/N)
ratio >3 in a mass range of 1000-10 000 Da were recorded. AutoXecute
acquisition control, a software tool, was applied for automatic data
acquisition. We used the ClinProtTools (CPT) bioinformatics software (Ver. 2.0;
Bruker Daltonics) for proteome pattern recognition which allowed
differentiation between the cancer and control samples. A ±5 Da mass accuracy
for each spectrum was observed and was probably due to varied sample position
on the sample plate.
To optimize
the MALDI-TOF MS analysis, we tested three different beads of varying
functionalities: MB-HIC C8, MB-WCX and MB-IMAC Cu beads. Two serum samples,
pre-operative and one-month post-operative, of a randomly selected UM patient,
underwent three proteome assays each, with three types of functionalized MB and
subsequent MALDI-TOF MS (Microflex, Bruker Daltonics). Most of the protein
peaks were <10 kDa. Comparison of proteomic mass spectra in this range is
sufficient for analysis.
Evaluation
of Assay Precision and Diagnostic Efficacy
To
evaluate the precision of the assay, we determined within-run and between-run
variations by use of multiple analyses of bead fractionation and MS for 3 serum
samples. For within-run and between-run variations, we examined 5-7 peaks with
various intensities. Within-run imprecision was determined by evaluating the
coefficients of variance (CV) for two samples, each with 3 assays within a run;
between-run imprecision was determined by evaluating the CVs of 5 different
assays for a sample over a period of 9d.
To assess the
diagnostic efficacy, we calculated the means and standard deviation (SD) of the
peaks of interest in the UM and control groups. After selecting the smaller SD
of the two groups, the cutoff value was determined either as the corresponding
mean plus 2 SD if this mean value is lower than that of the other group or as
the corresponding mean minus 2 SD if this mean value is higher than that of the
other group. The sensitivity (ratio of the cancer samples correctly designated
with the cutoff value to all samples in the cancer group) and specificity
(ratio of control samples correctly designated with the cutoff value to all
samples in the control group) were analyzed accordingly. The 2 sided t-tests
were used to evaluate the statistical significance of a potential marker
between two groups.
Comparison of
the spectral profiles of UM patients’ serum samples collected pre- and
post-operatively with normal groups was also performed to screen peptide of
interest.
Bioinformatics
and Identification of Protein Markers
Selected
peptides were further purified by use of MB-IMAC Cu bead and directly
identified by MALDI TOF/TOF analysis to obtain the peptide sequence. Peptide
mass fingerprinting was performed with the Mascot search engine (Matrix
Science) and a search of the National Cancer for Biotechnology Information
(NCBI) protein-protein BLAST database (http://www.ncbi.nlm.nih.gov/BLAST/).
RESULTS
Reproducibility
of Serum Proteome Profiling Using Copper Beads and Mass Spectrometry Reproducibility was determined by
calculating the mean CV of the normalized peak amplitudes for each of the 5 or
7 peptides with the highest average amplitudes in the mass spectra. These
peptides were widely distributed in the range of 1000-10 000 Da. Table 1
summarized the within- and between-run CVs of the selected peptides. Within-run
CVs of two serum samples and between-run CVs of a serum sample are all below
20%.
Table 1
Reproducibility of mass spectra profiled by copper beads and MALDI-TOF analysis
|
Sample No. |
Mean mass (Da) |
MI |
CV (%) |
MCV (%) |
|
Within-run
reproducibility |
|
|
|
|
|
PO 6-2 (n=3) |
5906 |
937.9 |
8.5 |
14.8 |
|
|
1467 |
263.5 |
32.6 |
|
|
|
4211 |
225.9 |
8.7 |
|
|
|
7767 |
222.3 |
7.8 |
|
|
|
9292 |
214.8 |
16.2 |
|
|
C2 (n=3) |
5906 |
775.1 |
27.1 |
18.5 |
|
|
9294 |
290.2 |
21.8 |
|
|
|
4211 |
288.9 |
22.8 |
|
|
|
1467 |
257.9 |
16.2 |
|
|
|
2661 |
180.1 |
4.6 |
|
|
Between-run
reproducibility |
|
|
|
|
|
PO 1-10 |
5906 |
905.51 |
11.1 |
19.3 |
|
|
9290 |
634.33 |
23.4 |
|
|
|
4211 |
435.08 |
12.5 |
|
|
|
7766 |
419.97 |
26.6 |
|
|
|
2662 |
230.69 |
37.5 |
|
|
|
3264 |
198.70 |
13.1 |
|
|
|
5338 |
165.89 |
10.8 |
|
Reproducibility
was determined by calculating the mean CV of the normalized peak amplitudes for
each of the five or seven peptides with the highest average amplitudes. MI:
Mean intensity; CV: Coefficient of variance; ICV: Individual coefficient of variance;
MCV: Mean coefficient of variance of the runs.
Screen for
Differentially Expressed Peptides/Proteins
No
patients were found to have metastasis related to the intraocular tumor.
Sixty-eight serum samples from 18 UM patients before and after surgery and 25
healthy controls were manually fractionated using the MB-IMAC Cu beads kit.
Eluted samples are mixed with the matrix solution at a fixed proportion and
later spotted on the AnchorChipTM targets as described above. Mass
spectra were generated with MALDI-TOF MS (Autoflex, Bruker Daltonics).
A subset of 43
spectra from 18 pre-surgery UM patients and 25 controls were processed with CPT
software to interrogate the dataset for the discovery of disease-specific
biomarkers. This capability is contributable to visually inspect and
distinguish peptide/protein peaks of significantly different intensities.
Approximately 100 peaks were detected and calibrated by the CPT software and 49
peaks that differed significantly between the two groups were screened out.
To better
characterize the pool of differentially expressed peptides/proteins, receiver
operating characteristic curve (ROC curve) was used to assess the
discriminatory efficacy of each peptide/protein. All of the 49 differentially
expressed peptides demonstrated area under curve (AUC) between 0.70 and 0.90,
which is suggestive of medium diagnostic accuracy for each peak. Among them, 14
peaks showed AUC higher than 0.85. Their mean MW were 1467, 1207.56, 1741.61,
2024.2, 4054.88, 4117.41, 4173.61, 4964.57, 1351.66, 1897.62, 3263.52, 1264.62,
1520.56 and 3192.64 Da. They were designated as the UM markers A to N
respectively for subsequent characterization. All the P values of these
markers were <0.001. For markers C, D, E, F, G, H and J, mean peak
intensities in the UM patients group were stronger than those in the control
samples. For markers A, B, I, K, L, M and N, mean peak intensities in the UM
patients group were lower than those in the control samples.
The means and
SD of the 14 peaks in the cancer and normal control groups were calculated.
After selecting the smaller SD of the two groups, the cutoff value was
determined either as the corresponding mean plus 2 SD if this mean value is
lower than that of the other group or as the corresponding mean minus 2 SD if
this mean value is higher than that of the other group. As shown in Table 2,
the sensitivities of these UM markers A to N were 66.7%, 61.1%, 61.1%, 55.6%,
55.6%, 50.0%, 50.0%, 50.0%, 38.9%, 50.0%, 16.6%, 94.4%, 94.4% and 94.4%. The
specificities of these UM markers were mostly over 90%, only with markers L, M
and N around 30.0%. The accuracy rates ranged from 55.8% to 86.0%.
Table 2
Determination of the sensitivity and specificity for the 14 selected markers
with ROC over 0.85
|
UM potential
markers |
A |
B |
C |
D |
E |
F |
G |
|||||
|
MW (Da) |
1467 |
1207.56 |
1741.61 |
2024.2 |
4054.88 |
4117.41 |
4173.61 |
|||||
|
Cancer mean
intensity |
181.5 |
112.6 |
32.0 |
27.6 |
72.6 |
52.6 |
26.1 |
|||||
|
Cancer SD |
168.2 |
82.1 |
20.3 |
13.1 |
33.8 |
16.8 |
7.4 |
|||||
|
Cut-off
value |
210.2 |
39.8 |
20.0 |
23.4 |
56.5 |
52.1 |
25.8 |
|||||
|
Normal mean
intensity |
455.2 |
232.6 |
12.2 |
12.7 |
34.2 |
33.2 |
17.2 |
|||||
|
Normal SD |
122.5 |
64.7 |
3.9 |
5.4 |
11.1 |
9.5 |
4.3 |
|||||
|
Sensitivity
(%) |
66.7 |
61.1 |
61.1 |
55.6 |
55.6 |
50.0 |
50.0 |
|||||
|
Specificity
(%) |
100 |
96.0 |
92.0 |
96.0 |
96.0 |
100 |
100 |
|||||
|
Accuracy
rate (%) |
86.0 |
81.4 |
81.4 |
79.1 |
79.1 |
79.1 |
79.1 |
|||||
|
UM potential
markers |
H |
I |
J |
K |
L |
M |
N |
|||||
|
MW (Da) |
4964.57 |
1351.66 |
1897.62 |
3263.5 |
1264.62 |
1520.6 |
3192.67 |
|||||
|
Cancer mean
intensity |
62.1 |
43.2 |
55.6 |
193.8 |
36.5 |
21.8 |
98.5 |
|||||
|
Cancer SD |
34.6 |
28.2 |
48.9 |
95.4 |
18.7 |
6.5 |
42.4 |
|||||
|
Cut-off
value |
56.1 |
30.4 |
35.5 |
132.8 |
74.0 |
34.8 |
183.3 |
|||||
|
Normal mean
intensity |
25.8 |
81.6 |
17.7 |
296.9 |
66.3 |
32.0 |
160.7 |
|||||
|
Normal SD |
15.2 |
25.6 |
8.9 |
82.0 |
19.3 |
7.2 |
45.7 |
|||||
|
Sensitivity
(%) |
50.0 |
38.9 |
50.0 |
16.6 |
94.4 |
94.4 |
94.4 |
|||||
|
Specificity
(%) |
96.0 |
100 |
92.0 |
100 |
32.0 |
32.0 |
28.0 |
|||||
|
Accuracy
rate (%) |
76.7 |
74.4 |
74.4 |
65.1 |
58.1 |
58.1 |
55.8 |
|||||
The means and
SD of the peaks of interest in the cancer and normal control groups were
calculated. After selecting the smaller SD of the two groups, the cutoff value
was determined either as the corresponding mean plus 2 SD if this mean value is
lower than that of the other group or as the corresponding mean minus 2 SD if
this mean value is higher than that of the other group. The sensitivity (ratio
of the cancer samples correctly designated with the cutoff value to all samples
in the cancer group) and specificity (ratio of control samples correctly
designated with the cutoff value to all samples in the control group) were
analyzed accordingly. The accuracy rate (i.e. total consistent rate) was
determined as the ratio of cancer and normal control samples correctly
designated to the total number of samples tested. MW: Molecular weight; Cancer
mean: Mean intensity in the UM patients group; Cancer SD: Standard deviation of
all the peak intensities in the UM patients group; Normal mean: Mean intensity
in the normal control group; Normal SD: Standard deviation of all the peak
intensities in the normal control group.
Since not all
of these markers manifested satisfactory sensitivity or specificity rate, we
selected marker A (with a MW of 1467 Da) to combine with other markers and other
differentially expressed peptides to discriminate between UM and normal control
groups. The accuracy rate was calculated as the ratio of cancer and normal
control samples correctly designated to the total number of samples tested. As
summarized in Table 3, the sensitivities of each combination were between 65.0%
and 80.0%. The specificities were all over 90.0%. The accuracy rates ranged
from 83.7% to 90.7%. In which, AG combined markers (1467 Da and 4173.61 Da)
manifested the highest accuracy rate (90.7%) with sensitivity (77.8%) and
specificity (100%) better than any individual marker.
Table 3
Diagnostic efficacy of combined markers in detection of UM
|
Combination |
AG |
AD |
AF |
AI |
AJ |
AK |
AE |
AB |
AC |
AH |
|
Cancer
discriminated |
14 |
14 |
13 |
12 |
14 |
12 |
13 |
12 |
13 |
12 |
|
Normal
discriminated |
25 |
24 |
25 |
25 |
23 |
25 |
24 |
24 |
23 |
24 |
|
Sensitivity
(%) |
77.8 |
77.8 |
72.2 |
66.7 |
77.8 |
66.7 |
72.2 |
66.7 |
72.2 |
66.7 |
|
Specificity
(%) |
100.0 |
96.0 |
100.0 |
100.0 |
92.0 |
100.0 |
96.0 |
96.0 |
92 |
96.0 |
|
Accuracy (%) |
90.7 |
88.4 |
88.4 |
86.0 |
86.0 |
86.0 |
86.0 |
83.7 |
83.7 |
83.7 |
Among the 49
differentially expressed peptides between the UM and normal groups, peptides
with an AUC lower than 0.85 were also included as discriminators to combine
with marker A. On the basis of two peptides (1467 and 9289.0 Da; Figure 1), the
serum samples of UM patients and normal groups could be distinguished in 93.0%
of cases with high sensitivity (83.3%) and specificity (100%).
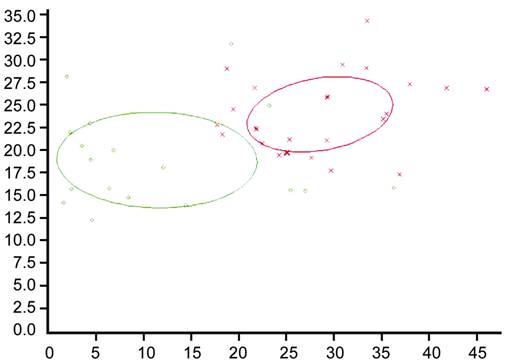
Figure 1
Dot graph depicting combined use of two peptides (1467 and 9289.0 Da) to
discriminate samples between UM and normal groups.
In addition,
CPT bioinformatics software (Version 2.0; Bruker Daltonics) provides many
algorithms for the generation of diagnostic panels. With genetic algorithm and
K-nearest neighbor algorithm (K=3), a panel of four peaks 2024 (marker D), 3194
(marker N), 4396 and 4645 Da managed to achieve an accuracy rate of 95.0%.
Comparison
of Spectral Profiles of Uveal Melanoma Patients Before and After Surgery At the time point of post-operative
1mo (average, 39.5d after surgery) and post-operative 6mo (average, 182.5d
after surgery), serum samples of UM patients were collected and analyzed.
Altogether 47
peptides were differentially expressed between the post-operative 1mo UM
patients group (15 cases) and the normal group. All the P values of
these peptides were <0.05. With a close comparison of these 47 peptides with
those 49 peptides differentially expressed between pre-operative UM patients
and the normal group, we found that 41 peptides were overlapped, including all
the previously denoted markers A-N. Four peptides (MW: 2093, 6691, 2864 and
8204 Da), all of very low mean intensities, were not detected in pre-operative
UM patients and another 2 peptides (MW: 3884 and 2990 Da) differed between
post-operative 1mo UM patients and the normal group but did not differ between
pre-operative UM patients and the normal group.
Nine peaks
differed significantly (P<0.05) between post-operative 6mo UM
patients (10 cases) and the normal group. Of which, three peaks (MW: 2724, 1867
and 4645 Da) were also found in the dataset of 49 peptides differentially
expressed between pre-operative UM patients and the normal group. The other 6
peaks (MW: 5966, 3303, 6029, 7635, 7564 and 3883 Da) differed between
post-operative 6mo UM patients and the normal group but did not differ between
pre-operative UM patients and the normal group. It is noted that there were no
statistically significant differences in peak intensities of previously denoted
markers A-N observed between post-operative 6mo UM patients and the normal
group.
Univariate
analysis of variance was employed to specifically analyze the differences in
peak intensities of previously denoted markers A-N in 10 UM patients with
complete pre-operative, post-operative 1mo and post-operative 6mo sera tested.
Multiple comparisons were performed between each two of the time points. The
mean intensities of each marker at the three time points, F and P
values were summarized in Table 4. As shown in Figure 2, the dynamic variances
in peak intensities of some markers in the 10 UM patients along the time before
and after surgery and the corresponding peak intensities in normal group were
visually depicted.

Figure 2
The variances in peak intensities of markers A-E in the 10 UM patients along
the time before and after surgery and comparison with corresponding peaks in
the normal group Groups 1, 2 and 3 refer to
the three subgroups of UM patients at three different time points respectively.
1: Pre-operative; 2: Post-operative 1mo; 3: Post-operative 6mo. The mean
intensities at different time points of a UM patient were demonstrated with
bars of the same color. Group 4 refers to the normal group, each shown in a
different color bar.
Table 4
Multiple comparisons between each of two subgroups of UM patients
|
Markers1 |
A |
B |
C |
D |
E |
F |
||||||
|
MW (Da) |
1467 |
1207.56 |
1741.61 |
2024.2 |
4054.88 |
4117.41 |
||||||
|
Normal mean |
455.61 |
232.38 |
12.00 |
12.77 |
34.13 |
33.17 |
||||||
|
Mean
intensity of UM I |
87.8 |
67.3 |
43.4 |
32.6 |
87.1 |
61 |
||||||
|
Mean
intensity of UM II |
45.4 |
46.4 |
36.5 |
30.5 |
113.1 |
72.6 |
||||||
|
Mean
intensity of UM III |
433 |
178.4 |
17 |
14.4 |
29.7 |
30.1 |
||||||
|
F value |
33.775 |
27.529 |
13.919 |
6.052 |
24.934 |
27.615 |
||||||
|
P value |
<0.001 |
<0.001 |
<0.001 |
0.007 |
<0.001 |
<0.001 |
||||||
|
P value of I vs II |
0.419 |
0.284 |
0.199 |
0.721 |
0.04 |
0.059 |
||||||
|
P value of II vs
III |
<0.001 |
<0.001 |
0.001 |
0.009 |
<0.001 |
<0.001 |
||||||
|
P value of I vs
III |
<0.001 |
<0.001 |
<0.001 |
0.004 |
<0.001 |
<0.001 |
||||||
|
Marker1 |
H |
I |
J |
K |
L |
M |
N |
|||||
|
MW (Da) |
4964.57 |
1351.66 |
1897.62 |
3263.52 |
1264.62 |
1520.56 |
3192.67 |
|||||
|
Normal mean |
25.8 |
81.6 |
17.6 |
296.9 |
66.2 |
30.8 |
160.9 |
|||||
|
Mean
intensity of UM I |
75.3 |
29.6 |
77 |
161.4 |
28 |
18.3 |
82.6 |
|||||
|
Mean
intensity of UM II |
70 |
17.5 |
62.6 |
161 |
23.5 |
16.2 |
92.2 |
|||||
|
Mean
intensity of UM III |
20.1 |
94.9 |
24.1 |
243 |
69.1 |
31.1 |
126.6 |
|||||
|
F value |
10.994 |
14.718 |
7.001 |
7.901 |
20.113 |
14.897 |
5.821 |
|||||
|
P value |
<0.001 |
<0.001 |
0.006 |
0.002 |
<0.001 |
<0.001 |
0.008 |
|||||
|
P value of I vs II |
0.682 |
0.436 |
0.337 |
0.988 |
0.573 |
0.484 |
0.488 |
|||||
|
P value of II vs
III |
0.001 |
<0.001 |
0.017 |
0.002 |
<0.001 |
<0.001 |
0.017 |
|||||
|
P value of I vs
III |
<0.001 |
<0.001 |
0.002 |
0.002 |
<0.001 |
<0.001 |
0.003 |
|||||
UM I, II and
III mean refer to the three subgroups of UM patients at three different time
points respectively. I: Pre-operative; II: Post-operative 1mo; III:
Post-operative 6mo. F value corresponds to the fixed factor of the
grouping in univariate analysis of variance. P value below 0.05 was
regarded as significant. The following three P values were generated by
multiple comparisons between each of two subgroups of UM patients and were
regarded as significant if <0.05. 1Peptide peaks of marker G (MW
4173.61 Da) was not detected in sera of UM II patients and multiple camparisons
were not performed.
Identification
of Uveal Melanoma Markers With this bead-based
proteomic technology, we found several potential UM markers. Markers A-N and
another three peptides with molecular mass 9288.95, 4396 and 4645 Da were
selected for further identification based on the highest peak intensities of
these peptides. After fractionation with the same MB-IMAC copper beads kit,
samples were subjected to MALDI TOF/TOF MS analysis and analyzed by
FlexAnalysis software. The MS fingerprint was subjected to Mascot searching for
protein identification.
In the same
sample, markers A and B (Figures 3, 4) were identified to be fibrinogen alpha
chain (fibrinopeptide A) precursors with a Mascot score of 187. The Mascot
scores were 130 and 76 for markers A and B respectively. The mass accuracy was
approximately 10 ppm. The sequence of marker A was determined to be
G.EGDFLAEGGGVR.G and the sequence of marker B was A.DSGEGDFLAEGGGVR.G.
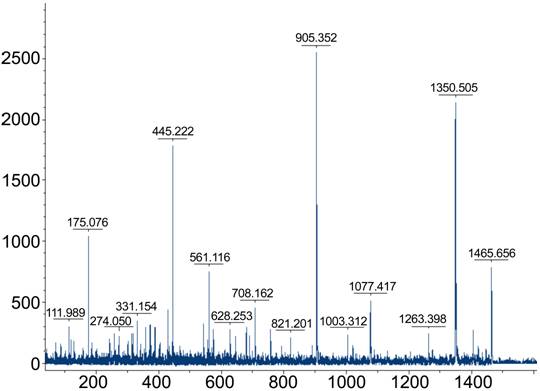
Figure 3
Serum protein profile of a sample from the normal group with highest intensity
of marker A (MW: 1467 Da).
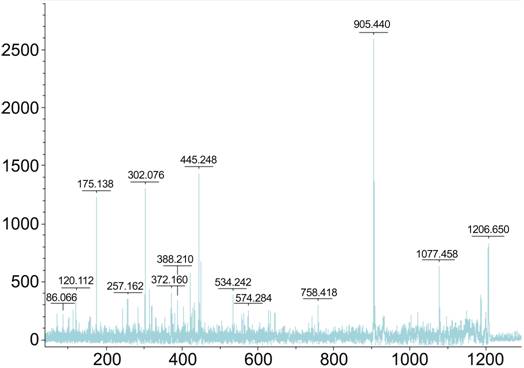
Figure 4
Serum protein profile of a sample from the normal group with highest intensity
of marker B (MW: 1207.56 Da).
The sample
labeled C20 was used for peptide identification of both markers (MW: 1467 D and
1207.56 Da). After fractionation with Cu-bead, this sample was subjected to
MALDI-TOF/TOF MS and analyzed by FlexAnalysis softwares. The mass spectrum is
shown with MW calculation (m/z values) along the x-axis and relative intensity
along the y-axis on the top.
DISCUSSION
In current
research, we utilized the affinity MB (ClinProt purification reagent sets from
Bruker Daltonics) to fractionate the serum proteome of blood samples from UM
patients and healthy controls. Chemically coated MB (particle size <1 μm;
mean pore size 40 nm; specific surface area 100 cm2/g) are with
various defined surface functionalities. The vast area provided by these MB
facilitates selective affinity distillation of low MW protein/peptides (mainly
from 800 Da to 20 000 Da). This platform of proteomics has been used to explore
the proteome of oral cancers[8], nasopharyngeal
cancer[9], head and neck carcinoma[10], cerebral glial carcinoma[11],
prostate, bladder and breast cancer[12] as well
as pneumonia and leukemia in recent years. We directly profiled protein/peptide
patterns from affinity bead-purified serum samples with MALDI-TOF MS and
determined a set of differentially expressed protein/peptides. To better
characterize this dataset, we further selected several potential markers that
discriminated UM patients’ sera from healthy control samples.
Statistically,
these potential markers are of various degrees of sensitivity, specificity and
accuracy rates and no single marker is suitable for effective screening alone.
However, there are combined markers (for example, marker A and G) that yield
better efficiency of discrimination than any individual marker. Another two
peptides (1207 Da and 9289 Da) together can distinguish two groups with even
higher accuracy rate. Given that oncogenesis is often heterogeneous and
complicated, a single biomarker is hard to find to easily distinguish different
groups. Combined use of multiple blood markers has been shown to be an
advisable approach to improve diagnostic strength[9,13-14].
The design of
our study was also based on a well-accepted hypothesis that tumor cells
synthesize, secrete and might eventually release a set of specific
protein/peptides into the microenvironment around the tumor. Some of these
protein/peptides (those of low MW especially) might end up in the blood
circulation through tissue fluid or lymph. Detection of such protein/peptides
might reveal tumor relevant information. By accomplishing surgical procedures
to completely remove the tumor burden of these UM patients, we postulated that
after a period of time, these tumor-related proteins/peptides could show
possible patterns of approaching the normal levels. Our results that after 6mo
the levels of most differentially expressed protein/peptides above mentioned
returned to normal levels is in favor of this hypothesis. Besides, after
comparison of differentially expressed proteins/peptides over a period of 6mo
after the surgery, we discovered that some potential markers showed continual
trend of increasing (e.g. markers A and B) or declining (e.g.
markers C, D and E) and showed no statistical difference from that of the
healthy controls.
Markers A and
B were both identified to be fibrinogen alpha chain (fibrinopeptide A)
precursors. Fibrinogen is a plasma glycoprotein synthesized in the liver and is
composed of 3 structurally different subunits: 2 alpha chains, 2 beta chains
and 2 gamma chains. The association of fibrinogen with regulation of tumor
growth has been studied over decades. Local tumor cells may induce
fibrinolysis, which may stimulate cell proliferation and self-regulated
progression of the tumor[15-16].
A series of mechanisms regulating the level of fibrinogen in blood was reported
to previously[15,17].
Fibrinogen might play a role in tumor growth regulation. Abundant fibrinogen
was discovered in the connective tissue of breast cancer while the adjacent
normal tissue was not[18]. Zacharski et al[16] also reported increased amount of alpha and beta
chains of fibrinogen around active tumor cells of small cell carcinoma of the
lung. Increased levels of plasma fibrinogen were also reported in breast
carcinoma and skin malignant melanoma patients[19].
A recent comparative proteomic research of oral cancer plasma found that the
level of alpha chain of fibrinogen increased significantly compared to that of
normal controls[8]. Our results showed decreased
level of alpha chain precursor peptides of fibrinogen, indicating there might
be different mechanism of fibrinolysis involved in the oncogenesis of UM.
Further studies are needed to validate this finding.
Ideally, blood
samples for biomarker measurement are collected centrally and processed
immediately to avoid any unwanted changes in concentrations that could affect
validity. In large-scale epidemiologic and clinical studies, however, this
theoretical goal must give way to a more pragmatic approach. In our research,
the reproducibility is evaluated with respect to CV, which were around 14%-20%.
In a proteometric research on oral cancer plasma biomarkers, Cheng et al[20] reported CV being lower than 8%. We noticed that they
used the ultraflex MALDI-TOF MS for proteomic profiling. In addition to the
sensitivity of individual mass spectrometer (because true changes over time can
be established only if measurement error is small), it should also be noted
that serum sample storage time, thawing rounds, manual or automatic handling
all could intervene with the reproducibility of proteomic profiling. Besides
these, reliability and validity coefficients were influenced by variability in
concentration, possibly because of the small magnitude of the individual
protein/peptides
The
limitations should be mentioned here. One limitation is that we did not measure
in duplicate or triplicate to adjust intra-assay variations. In addition, serum
samples were not analyzed within one run due to our pre-set limitations on
storage time to achieve sample quality control. In consequence, interassay
variability cannot be avoided or ignored. Another limitation is that serum
samples were stored in small volume (200 μL each). They were not randomized
before analysis. Possible bias from order of draw, although unlikely, therefore
cannot be ruled out. Among the many differentially expressed protein/peptides
and selected potential markers, only two of them were identified. The nature of
other differentially expressed proteins remains unknown, most likely because of
extremely low amount of materials in the samples. Another limitation arised
from the doubts in whether it is possible to eliminate tumor burden completely
in our cases via surgical removal. There was hypothesis that UM patients
might have developed micro-metastasis, even before they are diagnosed[21]. In the case of the existence of micro-metastasis,
surgeries alone will not achieve its goal of removing tumor cells and hence
their secretions or releases completely.
In conclusion,
we have shown that a convenient, fast proteomic technique, affinity bead
purification and MALDI-TOF analysis in combination with bioinformatic software,
facilitates the detection and identification of novel biomarkers. This study
using MALDI-TOF MS coupled with MB fractionation distinguished differentially
expressed peptides but failed to identify most of these peptides probably due
to extremely low amounts of them in the blood circulation. Proteomic pattern
diagnosis is a promising tool for early disease detection and may help to
reduce the number of invasive medical procedures in the future, such as
biopsies and investigative surgeries.
ACKNOWLEDGEMENTS
Foundations:
Supported
by the National Natural Science Foundation of China (No.81570891; No.81272981);
the Beijing Natural Science Foundation (No.7151003); Advanced Health Care
Professionals Development Project of Beijing Municipal Health Bureau
(No.2014-2-003); Beijing Municipal Administration of Hospitals Clinical
Medicine Development of Special Funding Support (No.ZYLX201307).
Conflicts
of Interest: Shi XY, None; Li Q, None; Wei WB, None; Tao LM, None.
REFERENCES
1 Hu DN, Yu
GP, McCormick SA, Schneider S, Finger PT. Population-based incidence of uveal
melanoma in various races and ethnic groups. <ii>Am J
Ophthalmol</ii> 2005;140(4):612-617. [CrossRef] [PubMed]
2 Vonk DT, Kim
Y, Javid C, Gordon JD, Stea B. Prescribing to tumor apex in episcleral plaque
iodine-125 brachytherapy for medium-sized choroidal melanoma: A
single-institutional retrospective review. <ii>Brachytherapy</ii>
2015;14(5):726-733. [CrossRef] [PubMed]
3 Abildgaard
SK, Vorum H. Proteomics of uveal melanoma: a minireview. <ii>J Oncol
</ii>2013;2013:820953. [CrossRef] [PMC free article] [PubMed]
4 Missotten
GS, Beijnen JH, Keunen JE, Bonfrer JM. Proteomics in uveal melanoma.
<ii>Melanoma Res</ii> 2003;13(6):627-629. [CrossRef]
5 Pardo M,
García A, Thomas B, Piñeiro A, Akoulitchev A, Dwek RA, Zitzmann N. Proteome
analysis of a human uveal melanoma primary cell culture by 2-DE and MS.
<ii>Proteomics </ii>2005;5(18):4980-4993. [CrossRef] [PubMed]
6 Pardo M,
García A, Thomas B, Piñeiro A, Akoulitchev A, Dwek RA, Zitzmann N. The
characterization of the invasion phenotype of uveal melanoma tumour cells shows
the presence of MUC18 and HMG-1 metastasis markers and leads to the
identification of DJ-1 as a potential serum biomarker. <ii>Int J Cancer
</ii> 2006;119(5):1014-1022. [CrossRef] [PubMed]
7 Ramasamy P,
Murphy CC, Clynes M, Horgan N, Moriarty P, Tiernan D, Beatty S, Kennedy S, Meleady
P. Proteomics in uveal melanoma. <ii>Exp Eye Res
</ii>2014;118:1-12. [CrossRef] [PubMed]
8 Khurshid Z,
Zohaib S, Najeeb S, Zafar MS, Slowey PD, Almas K. Human saliva collection
devices for proteomics: an update. <ii>Int J Mol Sci</ii>
2016;17(6).pii:E846. [CrossRef]
9 Chen ZT,
Liang ZG, Zhu XD. A review: proteomics in nasopharyngeal carcinoma.
<ii>Int J Mol Sci </ii>2015;16(7):15497-15530. [CrossRef] [PMC free article] [PubMed]
<no>10
Henrique T, José Freitas da Silveira N, Henrique Cunha Volpato A, <ii>et
al</ii>. HNdb: an integrated database of gene and protein information on
head and neck squamous cell carcinoma. <ii>Database (Oxford)
</ii>2016;2016.pii:baw026.</no>
11 Villanueva
J, Philip J, Entenberg D, Chaparro CA, Tanwar MK, Holland EC, Tempst P. Serum
peptide profiling by magnetic particle-assisted, automated sample processing
and MALDI-TOF mass spectrometry. <ii>Anal Chem
</ii>2004;76(6):1560-1570. [CrossRef] [PubMed]
12 Sacco F,
Silvestri A, Posca D, Pirrò S, Gherardini PF, Castagnoli L, Mann M, Cesareni G.
Deep proteomics of breast cancer cells reveals that metformin rewires signaling
networks away from a pro-growth state. <ii>Cell Syst
</ii>2016;2(3):159-171. [CrossRef] [PubMed]
13 Lin YC, Wu
Chou YH, Liao IC, Cheng AJ. The expression of mammaglobin mRNA in peripheral
blood of metastatic breast cancer patients as an adjunct to serum tumor
markers. <ii>Cancer Lett</ii> 2003;191(1):93-99. [CrossRef]
14 Panzuto F,
Severi C, Cannizzaro R, Falconi M, Angeletti S, Pasquali A, Corleto VD,
Annibale B, Buonadonna A, Pederzoli P, Delle Fave G. Utility of combined use of
plasma levels of chromogranin A and pancreatic polypeptide in the diagnosis of
gastrointestinal and pancreatic endocrine tumors. <ii>J Endocrinol Invest
</ii>2004; 27(1):6-11. [CrossRef]
15 Weiskirchen
R, Tacke F. Liver fibrosis: from pathogenesis to novel therapies. <ii>Dig
Dis </ii> 2016;34(4):410-422. [CrossRef] [PubMed]
16 Zacharski
LR, Memoli VA, Rousseau SM. Thrombin-specific sites of fibrinogen in small cell
carcinoma of the lung. <ii>Cancer </ii>1988;62(2):299-302. [CrossRef]
17 Palumbo JS,
Talmage KE, Liu H, La Jeunesse CM, Witte DP, Degen JL. Plasminogen supports
tumor growth through a fibrinogen-dependent mechanism linked to vascular
patency. <ii>Blood </ii>2003;102(8):2819-2817. [CrossRef] [PubMed]
<no>18
Rybarczyk BJ, Simpson-Haidaris PJ. Fibrinogen assembly, secretion, and
deposition into extracellular matrix by MCF-7 human breast carcinoma cells.
<ii>Cancer Res</ii> 2000;60(7):2033-2039.</no>
19 Mannucci
PM, Vaglini M, Maniezzo M, Magni E, Mari D, Cascinelli N. Hemostatic
alterations are unrelated to the stage of tumor in untreated malignant melanoma
and breast carcinoma. <ii>Eur J Cancer Clin Oncol </ii>
1985;21(6):681-685. [CrossRef]
20 Cheng AJ,
Chen LC, Chien KY, Chen YJ, Chang JT, Wang HM, Liao CT, Chen IH. Oral cancer
plasma tumor marker identified with bead-based affinity-fractionated proteomic
technology. <ii>Clin Chem </ii> 2005;51(12): 2236-2244. [CrossRef] [PubMed]
21 Pardo M,
Dwek RA, Zitzmann N. Proteomics in uveal melanoma research: opportunities and
challenges in biomarker discovery. <ii>Expert Rev Proteomics </ii>
2007;4(2):273-286. [CrossRef] [PubMed]