
・Review・Current
Issue・ ・Achieve・ ・Search Articles・ ・Online Submission・ ・About IJO・ PMC
Parameters of ocular fundus on
spectral-domain optical coherence tomography for glaucoma diagnosis
Yu-Lin Tao1,2, Li-Ming Tao2, Zheng-Xuan Jiang2,
He-Ting Liu2, Kun Liang2, Mo-Han Li2,
Xuan-Sheng Zhu2, Yan-Lin Ren2, Bing-Jie Cui2,3
1Department of
Ophthalmology, the First People's Hospital of Jiujiang City, Jiujiang 332000,
Jiangxi Province, China
2Department of
Ophthalmology, the Second Affiliated Hospital of Anhui Medical University,
Hefei 230000, Anhui Province, China
3Department of
Ophthalmology, the Fuyang Affiliated Hospital of Anhui Medical University,
Fuyang 236000, Anhui Province, China
Correspondence
to: Li-Ming
Tao. Department of Ophthalmology, the Second Affiliated Hospital of Anhui
Medical University, Hefei 230000, Anhui Province, China. Lmtao9@ 163.com
Received:
2016-07-22
Accepted: 2017-02-06
Abstract
In this review,
we summarize the progression of several parameters assessed by spectral-domain
optical coherence tomography (SD-OCT) in recent years for the detection of
glaucoma. Monitoring the progression of defects in the retinal nerve fiber
layer (RNFL) thickness is essential. Imaging and analysis of retinal ganglion
cells (RGCs) and inner plexiform layer (IPL), respectively, have been of great
importance. Optic nerve head (ONH) topography obtained from 3D SD-OCT images is
another crucial step. Other important assessments involve locating the Bruch’s
membrane opening (BMO), estimating the optic disc size and rim area, and
measuring the lamina cribrosa displacement. Still other parameters found in the
past three years for glaucoma diagnosis comprise central retinal artery
resistive index, optic disc perfusion in optical coherence tomography
angiography (OCTA) study, peripapillary choroidal thickness, and choroidal area
in SD-OCT. Recently, several more ocular fundus parameters have been found, and
compared with the earlier parameters to judge the accuracy of diagnosis. While
a few of these parameters have been widely used in clinical practice, a fair
number are still in the experimental stage.
KEYWORDS: glaucoma progression;
retinal nerve fiber layer; ganglion cells; macular thickness; optic nerve head;
lamina cribrosa; optical coherence tomography
DOI:10.18240/ijo.2017.06.23
Citation: Tao YL, Tao
LM, Jiang ZX, Liu HT, Liang K, Li MH, Zhu XS, Ren YL, Cui BJ. Parameters of
ocular fundus on spectral-domain optical coherence tomography for glaucoma
diagnosis. Int J Ophthalmol
2017;10(6):982-991
Article
Outline
INTRODUCTION
Glaucoma is a
group of optic neuropathies that is characterized by progressive degeneration
of retinal ganglion cells (RGCs), slow atrophy and thinning of the retinal
nerve fiber layer (RNFL), irreversible morphological changes to the optic nerve
head (ONH) that contains the narrowing of disc rim area (RA), and expansion of the
optic cup[1-2]. Loss and shrinkage of the visual field is another
characteristic of glaucoma caused by the degeneration of these nerves, which
can eventually lead to blindness and a decline in the quality of life without
early and adequate treatment[1]. There are more than 70 million
people threatened by glaucoma worldwide with approximately 10% being blind in
both eyes[3], making it one of the predominant reasons of blindness
in the world. Glaucoma, especially primary open angle glaucoma (POAG), usually involves
both eyes, occurs insidiously, and progresses slowly, and is often only
detected at an advanced stage where visual function has already been seriously
compromised; this is because patients with POAG rarely show early-stage
symptoms. Mid- or late-stage glaucoma has poor prognosis despite related
treatment, because these patients have a relatively shrunk visual field and
depressed atrophy of the optic disc.
Several
studies have found that visual field loss in many patients is only detected
when a substantial number of RGCs have been lost and a vast amount of RNFL has
thinned[4-8]. Besides, in vivo research in experimental
glaucoma (EG) involving a nonhuman primate (NHP) model of EG has also shown
that RNFL impedence and RGC function exhibit progressive loss from baseline
before any loss of retinal nerve fiber layer thickness (RNFLT) or orbital optic
nerve axons occurs[9], prior to the loss of visual field. With
regard to in vivo measurement, it might serve as potential biomarkers of
early-stage glaucomatous damage preceding axon loss and RGC death[9].
Therefore, it is essential to measure and estimate the parameters of ocular
fundus from spectral-domain optical coherence tomography (SD-OCT) and apply these
findings to the monitoring and detection of progression of primary glaucoma.
With the rapid
development of resolution and scanning speed on OCT imaging and its advantages
of non-contact, good repeatability, and quick imaging, OCT has been widely used
in the field of ophthalmology, ranging from time-domain OCT (TD-OCT) to SD-OCT[10-14].
Different parameters in structural measurements for early glaucoma diagnosis
obtained with SD-OCT have emerged in several research articles and been
published to evaluate their accuracy[15-18]. This paper critically
reviews and evaluates relevant research of these parameters obtained from
SD-OCT for the diagnosis of primary glaucoma. We also review issues related to
what types of SD-OCT can provide optimal results in the potential ability for
diagnosing glaucoma, how to evaluate the parameters in glaucoma diagnosis, and
how these results from SD-OCT could be applied to clinical practice.
TYPES OF
SPECTRAL-DOMAIN OPTICAL COHERENCE TOMOGRAPHY FOR GLAUCOMA DIAGNOSIS
Although
currently, some other inspection equipment that contains scanning laser
polarimetry (SLP) and confocal scanning laser ophthalmoscopy (CSLO) has been
used to detect RNFL thickness clinically[10,19], the most widely
used tool for glaucoma diagnosis in clinical practice is SD-OCT, which can
obtain high-resolution images of RNFLT, optic disc parameters, and macular
ganglion cell complex (mGCC) thickness data[12-13,20-24]. Since its
introduction in 1991 by Huang et al[25], OCT has rapidly
emerged and become widespread in its use as a useful tool in ophthalmology
worldwide.
In the past
two decades, TD-OCT was clinically applied to obtain images of ocular fundus
parameters. TD-OCT can also provide the RNFLT, retinal ganglion cell layer
thickness (RGCLT), and ONH parameters to differentiate glaucomatous eyes from
people alive and to detect changes over time[14,26-29]. However,
owing to its limited suboptimal axial resolution (10 μm) and scan speed
(100-400 A-scan/s), acquisition times with TD-OCT are much longer than SD-OCT.
Therefore, its popularity in hospitals to detect glaucoma progression has
declined. Nowadays, most commercially available instruments provide a quicker
scan speed (26 000-53 000 A-scan/s) and a wider axial resolution of about 5 μm;
hence, aptly named SD-OCT. We can acquire much clearer and more comprehensible
images from SD-OCT that leads to much improved reproducibility and accuracy to
differentiate glaucomatous eyes from healthy eyes[18,30].
Our online
search of published articles showed that seven types of SD-OCT have been widely
popularized to diagnose glaucoma clinically; these include RTVue SD-OCT, Cirrus
HD-OCT, Spectralis OCT, Topcon 3D OCT, RS-3000 OCT, swept-source OCT (SS-OCT),
and Envisu C-Class SDOIS, with the first four types being more popular than the
others[21,24,29,31-43]. Some of these are still in the experimental
stage and not widely used in clinical, e.g. Envisu C-Class SDOIS. Each
type offers a special function and has its own advantages: RTVue SD-OCT is
useful for RNFL change analysis and ganglion cell complex (GCC) progression
analysis; Cirrus HD-OCT, for guided progression analysis (GPA) of RNFL and ONH
measurements; Spectralis OCT, for the RNFL change report with fovea-to-disc
alignment (FoDi); Topcon 3D OCT, for RNFL trend analysis; RS-3000 OCT, for the
detection of changes in RNFL and complex thicknesses about structures
comprising the nerve fiber layer (NFL), ganglion cell layer (GCL), and inner
plexiform layer (IPL) and for its multifunctional follow-up;and swept-source
OCT, for the detection of axonal damage on the lamina cribrosa (LC), in vivo
glaucoma, and evaluation of its ability to qualify lamina cribrosa thickness
(LCT)[35]. The function and current reports of Envisu C-Class SDOIS
are not available.
Several
studies have shown and compared some types of SD-OCT with respect to diagnostic
accuracy in glaucoma. Akashi et al[32] who studied
glaucomatous eyes, normal eyes with high myopia, and normal eyes by using
RTVue, Cirrus, and 3D OCT, concluded that the average circumpapillary retinal
nerve fiber layer (cpRNFL) and GCC thicknesses displayed similar efficacies in
the diagnosis of glaucoma with high myopia. RTVue OCT exhibited the best
diagnostic potential when the position was spotted in nasal cpRNFL, whereas
when spotted in the macular retinal nerve fiber layer (mRNFL), 3D OCT showed
better diagnostic potential than Cirrus OCT. Both cpRNFL and GCC measurements
obtained from each instrument showed good performance in detecting highly
myopic glaucoma. The same research team published another dissertation with the
same instruments and showed that the abilities for the parameters of GCL/IPL
and mRNFL gained from Cirrus and 3D OCT was different[33]. Other
groups have also reviewed the usage of SD-OCT to detect glaucoma progression
and analyzed reproducibility and accuracy of different types of SD-OCT
performed on different parameters of ocular fundus in glaucoma patients[44].
Thus, it is critical to maintain tight surveillance on the progression of
early-stage glaucoma and correctly diagnose with SD-OCT in order toprevent or
delay vision loss in these patients.
DETECTION
OF RETINAL NERVE FIBER LAYER THICKNESS IN GLAUCOMA DIAGNOSIS
With the
enhancement of OCT resolution and SD-OCT imaging, the hierarchy of retinal structures
and tissues can be meticulously visualized, including any pathology. The
structures can be distinguished clearly including NFL, GCL, IPL, and mGCC.
After calculating the thickness of each layer, the difference between
glaucomatous and healthy eyescan be evaluated and the above four parameters
were seen to be significantly lower in glaucomatous eyes than healthy eyes[16,21,24,26,33,38,45-49].
Despite the thinning of the above-mentioned four parameters and the change of
ONH seen on SD-OCT, RNFL has wider applications in the detection of
glaucomatous degeneration than the other parameters. Actually, the first and
most common parameter analyzed by OCT is average cpRNFLT to follow the
progression of glaucoma[50]. Detection of RNFL thickness has been
accurate with respect to each quadrant and each hour circled around the
peripapillary in recent years. Before obtaining the optimal diagnostic
parameters using which the thickness differentiation between glaucoma and
healthy eyescan been compared, theycalculated the specificity and sensitivity
for glaucoma diagnostic parameters and analyzed and compared their area under
the receiver operating characteristic curves (AUC)[51-55].
Many research
studies estimate that repeatability changes with different parameters of
quadrants and hours. Vazirani et al[51] measured 40 normal
and 40 glaucomatous eyes (including 14 cases with advanced glaucoma) and
reported that the average RNFLT shows the best reproducibility for longitudinal
follow-up in all quadrants and the parameter of temporal quadrant yields
minimum repeatability. Mansoori et al[52] showed that
inferior RNFL is the thickest quadrants after studying 95 normal eyes and 83
glaucoma eyes in patients aged >40y. All the parameters in normal and
glaucomatous eyes showed statistically significant differences except for the
temporal quadrant and at the 10 o'clock position. Especially for the temporal
side, the test results showed the same results in the two groups, reflecting
that the temporal side exhibits a low specificity in identifying patients with
early glaucoma in the healthy population. They concluded that superior quadrant
and mean RNFLT parameters of cpRNFL have the maximum diagnostic potential for
primary glaucoma. Nouri-Mahdavi et al[56] and Leite et al[42]
obtained the same results by using the OCT2000 and Spectralis OCT,
respectively, that proved superior and average RNFLT have the largest AROC and
are regarded as the best parameters to distinguish between normal and
glaucomatous eyes. Park et al[55] compared the diagnostic
ability between Stratus OCT and Cirrus HD-OCT and concluded that the Cirrus
HD-OCT showed stronger diagnostic capability than Stratus OCT, which is related
to the result of detection technology improvement, a higher resolution of
Cirrus HD-OCT, and more accurate database standards.
Previous
studies confirmed the superior quadrant[28,52], inferior quadrant[28,55],
and average RNFLT[51-52,55] to be the most valuable parameters in
differentiating between normal and early glaucomatous eyes. Through these
measurements, we can explain the degeneration of visual field associated with
glaucoma that usually first occurs in the superior area, which is in accordance
with the initial damage that occurred in the inferior quadrant of cpRNFL
(Figure 1). Because of different damage scope of visual field on the
glaucomatous involved into studies, the diagnostic capabilities are different
among different quadrants. For example, Mansoori et al[52] included
more patients with visual field damage and more degeneration in the superior
RNFL than the inferior. Visual function worsens with glaucoma progression.
Diagnostic capabilities of most OCT on measuring RNFLT parameters have improved
(although there was no significant increase), as there is more RNFL damage in the
early stage of glaucoma than in those who have not yet progressed to the period
of visual field defects.
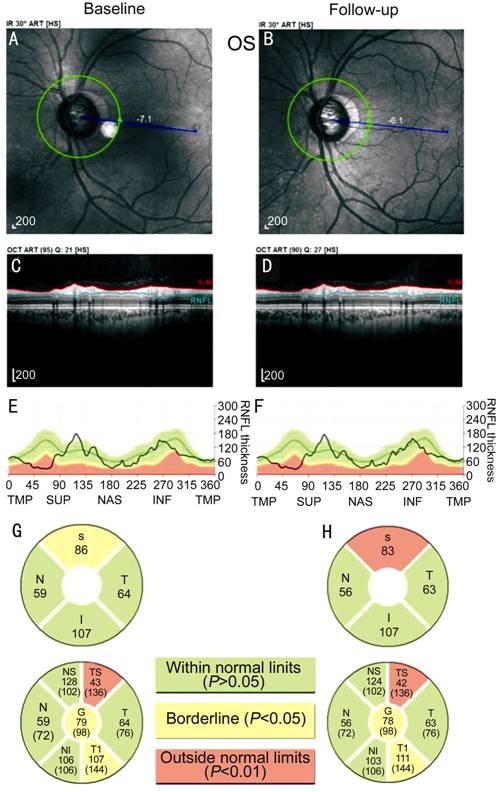
Figure 1
RNFL measurement and analysis printed out of the Spectralis OCT in the same
patient with glaucoma We detected it on December
12, 2014 and April 17, 2015, respectively. The images show the progression and
degeneration in ONH (A, B), cpRNFL images (C, D), thickness graph (E, F), and
changes of every quadrant of RNFL (G, H). In the two spots of detection period,
apparent advancements of RNFL can be seen in the section of superior and global
parameters. Superior RNFLT has exceeded normal limits (P<0.01) and is
temporal-inferior to borderline (P<0.05), while the other
quadrants are still within normal limits (P>0.05). Given a longer follow-up
without any intervention in this patient, the progression would be deeper and
more severe, thereby requiring more thorough inspection and management.
Several
scholars[57] have conducted Meta-analysis about 17 parameters of
cpRNFL (including the location about the thickness of average, superior,
inferior, nasal, and temporal quadrants of RNFL, and 12 total hour from 1 to
12). The subjects involved in this study were included by a random-effects
model, and the diagnostic performance was evaluated with the area under the
AUC. They also considered a number of important factors related to the
consequence in the Meta-regression analysis: 1) severity of glaucoma (divided
into five stages); 2) types of glaucoma (four types); and 3) ethnicity (four
categories). The result obtained was in accordance with the diagnostic
capability of all parameters followed in descending order as follows: average
RNFLT>inferior>superior>7 o’clock>6 o’clock>11 o’clock>12 o’clock>1 o’clock>5 o’clock>nasal>temporal>2 o’clock>10 o’clock>8 o’clock>9 o’clock>4 o’clock>3 o’clock. After excluding
the influence of the factors mentioned above, the average RNFLT showed the
highest diagnostic accuracy. The diagnostic accuracy is significantly lower in
Asian populations than in the other two categories. Only in this way, we can
demonstrate which parameter has the best diagnostic potential in
differentiating glaucomatous from normal eyes.
DETECTION
OF RETINAL GANGLION CELL COMPLEX LAYER THICKNESS IN GLAUCOMA DIAGNOSIS
Composition
and Fundamental Functions of Ganglion Cell Complex NFL is mainly composed of ganglion
cell axons, efferent fibers, Müller cells, glial cells, and retinal blood
vessels. GCL is mainly composed of the cell bodies of ganglion cells, Müller
cells, glial cells, and the branch of retinal vessels. IPL is the main
connection between the first and the second neurons of the retinal neurons in
the brain, comprising the inner nuclear layer (INL) and enormous projections of
ganglion cells. IPL is the synaptic site of bipolar cells, amacrine cells, and
ganglion cells. These three structures together constitute the GCC[58].
Human retina contains approximately 1.5 million RGCs, which is not limited to
only one layer of the 10 retinal layer structures[11]. Although NFL
and IPL are widely distributed on the inside of the retina, GCC has the largest
thickness in the macula except for parts of the area around the optic disc,
which plays an important role in retinal photoreceptors and the conduction of
visual signaling, as the densest area of the RGC is distributed in the macular
area and shows a multi-layered structure[11,49]. RNFL measurement is
susceptible to retinal vascular, peripapillary atrophy arc and other
physiological factors, as blood vessels are rich around the optic disc. Measurement
results obtained in the macular area, which is the physiological a vascular
zone, have the least interference from external factors. Therefore, GCC
thickness measurement to identify and differentiate healthy from primary
glaucoma patients has a comparative advantage when compared to the detection of
RNFL.
Role and
Value in Detecting Ganglion Cell Complex Thickness for Primary Glaucoma
Diagnosis Studies have confirmed the
emergence of RGC apoptosis in GCL in glaucoma patients, and with the progression
of the disease, the number of apoptosis of RGCs increased and the thickness of
RGC decreased. SD-OCT can clearly display the internal structure and can
calculate the thickness variation accurately, thus playing an important role in
the diagnosis of glaucoma[4,8,31,45,49,53,59-62]. Sung et al[63]
examined 98 patients with advanced glaucoma (mean deviation of visual field,
-14.3±5.5 dB) with SD-OCT, and followed-up for about 2.2y. Finally, they
confirmed significant changes that occurred in the average thickness of the
macula (about the scale of 6×6-mm2 covered with 128 scan lines). On
the other hand, such significant changes in average cpRNFLT could not be found
between advanced glaucoma and the non-progression group. However, their next
study included 162 cases involving early and mid-term stages of glaucoma
(defined MD of visual field of the two groups, -4.30 and -9.84 dB
respectively), and the same follow-up period. Eventually, they found
significant changes that appeared in average cpRNFLT and macular thickness (MT)
between the two groups[64]. These results indicate the potential
ability of MT detection and the limitation of RNFLT measurement in monitoring
the progression of advanced glaucoma. It is worth noticing that optic nerve
damage in glaucoma may not involve the peripheral retina. In addition, it has
been confirmed that measurement of macular nerve fibers, ganglion cells, and
the thickness of the IPL can be applied in the detection of glaucoma
progression (Figures 2 and 3)[65].
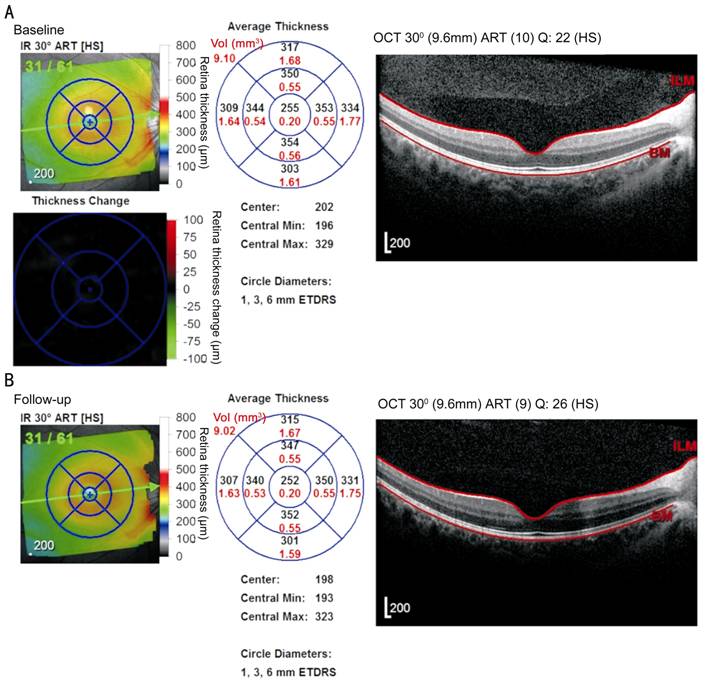
Figure 2
Thickness image and gray scale map of retina and macular layer obtained from
Spectralis OCT in a patient with glaucoma
Thickness
image is marked in black and gray, while the scale map is marked with red.
Baseline was obtained on December 12, 2014 (A) and after 4mo of follow up was
obtained on April 17, 2015 (B). The macular area is divided into nine sectors
including the global part in the center and average volume marked with red in
the top left hand corner of the circle. Over time, the thickness of the retina
and macular layer decreased in the right eye of the patient.
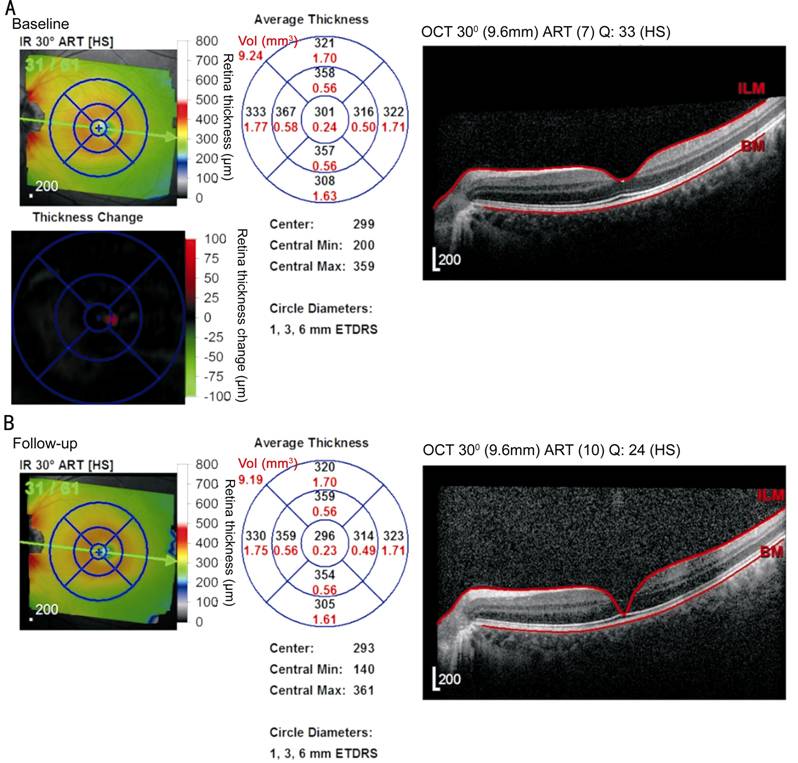
Figure 3
Over time, the thickness of the retina and macular layer decreased in the left
eye of the patient.
Recent studies
have confirmed that the loss of ganglion cells mainly contribute to decrease in
MT, especially due to the thinning of the GCC and INL[58]. On the
basis of this conclusion, Firat et al[53] selected 52 healthy
subjects, 56 with normal tension glaucoma (NTG), and 61 POAG patients with
SD-OCT to detect. After analyzing and comparing MT, GCC, and RNFL, as well as
the AUCs corresponding to these parameters, they found that GCC and RNFL have
similar performance and a high degree of consistency with respect to glaucoma
detection (P<0.05). Superior RNFLT is the single independent
variable in the differentiation between POAG and NTG with respect to all
parameters [odds ratio (OR)=0.942, P=0.004, 95%CI=0.905-0.981]. Yang et
al[61] detected the mGCIPL, mGCC, and cpRNFL thickness of 106
glaucomatous and 41 normal eyes with SS-OCT and SD-OCT, including the
parameters of AUCs, and concluded that average thickness of macular ganglion
cell inner plexiform layer (mGCIPL) and mGCC detected by SS-OCT are all smaller
than the results of SD-OCT regardless of the presence or absence of glaucoma.
The average diagnostic accuracy of all quadrants of macular ganglion cell inner
plexiform layer thickness (mGCIPLT) in SS-OCT and SD-OCT were extraordinarily
similar. Statistically significant differences could not be seen in three
parameters of AUCs regarding average cpRNFLT, mGCC, and mGCIPL that were
obtained with the two types of OCT. Similar diagnostic capabilities were found
between RNFL and GCC in the early, mid, and terminal stages of glaucoma in Kim et
al’s[66] study. Another study by Cho et al[67]
about the average sensitivity of vision, GCC, and RNFLT show similar consistent
results in glaucoma diagnostics.
From the
above-mentioned findings mGCIPL and mGCC can be proven to have high potential
in the diagnosis of early primary glaucoma, and with great consistency with the
results of cpRNFL; all of these can be used as significant and unprecedented
parameters in monitoring the changes of glaucomatous eyes in the long-term
clinical follow-up.
OPTIC NERVE
HEAD CHANGES IN THE PROGRESSION OF GLAUCOMA
General
Change in Optic Disc Structure Morphological structural
changes of the optic disc contribute to another important feature during the
progression of primary glaucoma, which can be seen in the ocular fundus as an
expanded visual cup, narrowed disc-rim, increased cup-disc ratio (CD), etc.
Lee et al[68] detected optic disc with Cirrus HD-OCT before
concluding that significant consistency existed between RA and RNFLT either in
normal population or in glaucoma group who has less figure significantly. Suh et
al[54] who studied 78 patients with early primary glaucoma and
80 individuals with healthy eyes by using the same kind of OCT showed that the
results of AUCs of RA were greater than the AUCs of the nasal quadrant on RNFL
and in the 1-5 o'clock position. No significant difference was found in the
other regions of cpRNFL. Rate ratio (RR) measurements (integrated calculation
of the RA and RNFLT) perform better than RA and the 7+11 o'clock (regions that
contain 7 and 11 o'clock) of RNFLT in the level of AUCs (RA: 0.931; RNFLT:
0.933; RR: 0.968). Berthold et al[17] showed that there was a
significant correlation (P<0.05) between MD and RNFL (r=0.603),
as well as RNFL of the inferior quadrant (r=0.620), RA (r=0.552),
and average CD ratio (r=-0.551). The best correlation for the ONH
analysis was found between MD and vertical CD ratio (r=-0.568).
Therefore, RA,
CD, and other ONH structures detected and analyzed on SD-OCT have an important
role in the detection of glaucoma progression and have a synergistic effect
with RNFLT that can also reflect transition in early glaucoma well.
Changes of
Internal Morphology of the Optic Nerve Head With the continuous improvement of
scanning resolution and depth of OCT, its domain applied to glaucoma monitoring
has penetrated to the detection and evaluation of LC[35,69-71].
Omodaka et al[35] scanned the area measuring 3×3-mm deep
within the ONH, and ultimately, constructed a 3D model corresponding to this
region of the LC structure and calculated out the average lamina cribrosa
thickness (avgLCT). They found a high pertinence between avgLCT and cpRNFLT
with the correlation coefficient of both as 0.64 (P<0.01). The former
coefficient of variation was 5.0%. There were significant differences in the
avgLCT among the normal, preperimetric glaucoma (PPG), and NTG groups, which
indicate that LCT obtained with SS-OCT could be refined as a new parameter for
glaucoma diagnosis and follow-up. With images from SD-OCT, Shoji et al[69]
identified the inner surface of the Bruch’s membrane opening (BMO) and measured
the horizontal and vertical intersectional angles between the BMO line and the
edge of LC, which approximately matched with the best-fitting line. The
parameter of the vertical-inclined angle to the internal LC edge was associated
with glaucoma and corresponded to its pathological changes. Changes in these
parameters are of great significance in the monitoring of myopia, glaucoma, and
LC morphological characteristics. Kim et al[70] reached a
similar conclusion with their study. With the LCT measured by SD-OCT, Sawada
et al[71] found that the LC of POAG moved backward when compared
to healthy eyes.
These research
studies have proved that LC as a portion of the ONH can be used to monitor and
identify early glaucomatous eyes from normal eyes, because the changes in
thickness and depth of LC attributable to the glaucomatous pathology were
prominent and conspicuous. We can learn more about the variation of retinal and
ONH or other structures in glaucoma by using SD-OCT to detect each layer of the
retina and evaluate the relationship between all parameters and glaucoma.
OTHER
POTENTIAL CHANGEABLE PARAMETERS
The Change
of Choroidal Thickness and Choroidal Area
With
the exception of RNFL, GCC, and ONH, peripapillary thickness and choroid volume
can also be applied to distinguish glaucoma and ocular hypertension diseases
from healthy eyes, by SD-OCT[72]. Several studies have shown its
change in the progression of glaucoma. Lamparter et al[72] studied
213 eyes with open angle glaucoma (OAG), 73 eyes with ocular hypertension, and
152 healthy control eyes. This prospective data was collected and calculated by
a linear mixed model fitted with provision for age and disease. The
peripapillary choroidal thickness in glaucomatous eyes was the thinnest,
whereas it was the thickest in eyes with ocular hypertension. Furthermore, the
thickness parameters are different among every sector of peripapillary choroid,
thickest in the superior sector and thinnest in the inferior sector. Most
importantly, the temporal-inferior sector is thinnest in the choroidal area,
which is one of the regions where glaucomatous damage begins. Chebil et al[73]
described macular choroidal thickness (MCT) in POAG patients with high myopia
and confirmed that foveal choroidal thickness (FCT) reduced significantly in
these patients. Choroidal thinning can be a useful parameter for the diagnosis
and follow-up of highly myopic patients with glaucoma.
Nowadays, the
high resolution of choroidal structures can be acquired by long-wavelength
SS-OCT for its higher acquisition speed and deeper tissue penetration and will
become clearer in the near future[34]. This study analyzed the visualization
of the choroidal and scleral interface and showed that choroidal thickness and
area may have better clinical utility in chorioretinal diseases including
glaucoma. Thus, systematic studies are important to excavate the relationship
between choroidal thickness and glaucoma.
Optic Disc
Perfusion in Glaucoma As a consequence of
increased intraocular pressure, the optic nerve becomes compressed, which can
lead to reduction of optic disc perfusion and blood supply. Based on this
theory, we can detect the bloodstream circled ONH and resistive index of the
central retinal artery through OCTA[74-77]. The split-spectrum
amplitude-decorrelation angiography (SSADA) algorithm was used to compute the
3D optic disc angiography. Jia et al[76] found that the disc
flow index reduced in the glaucoma group and was highly correlated with VF
pattern standard deviation and even significant after adjusting for age, CD
area ratio, NFL, and RA. This result also suggests that disc blood flow index
may contribute to the diagnosis of OAG. Liu et al[77]
reported that peripapillary retinal perfusion as well as peripapillary flow
index and peripapillary vessel density can be visualized in glaucomatous eyes.
They all have high repeatability and reproducibility with OCTA in glaucoma
evaluation.
Optic disc
perfusion measured by OCTA is important for the monitoring and evaluation of
glaucoma and its progression. Quantitative OCT angiography is of great utility
to determine the value in future studies in glaucoma evaluation. With the
improvement of glaucoma, visual function decreased severely, especially in the
advanced period. From the discussion, the progression of OAG could be monitored
by OCTA because of the close correlation between the flow index/vessel density
and MD, RNFL, and GCC thickness. In a subsequent study, we can take optimize
this indication for glaucoma diagnosis.
CONCLUSION AND OUTLOOK
Developed by
Huang et al[25] in the 1990s as a new diagnostic tool, OCT
has thus far been extensively used in the clinical diagnosis of related
diseases, especially for primary glaucoma. Use of the Fourier technique results
in enhanced resolution, scanning speed, and depth of OCT, and come out the
Fourier-domain that is SD-OCT, which can discover the reduction of RNFLT, mGCC,
ONH parameters, and LCT before excessive damage to the visual field. This
allows us to correctly and accurately diagnose glaucoma in the early stages,
and offer appropriate treatment to postpone or prevent further disease
progression. Improvements in OCT-based diagnostics have been rapid, with the
emergence of more and more parameters for more rapid detection of optic
neuropathies. Although abundance of optic nerve related parameters are
available to manage the progression of glaucoma, visual functional damage still
occurs in very few cases of glaucoma-related nerve head disease when
irreversible atrophic damage occurs in the optic nerve. There are still plenty
of challenges in finding better and improved high-sensitivity parameters that
can aid in the detection of neural losses that contribute to early primary
glaucoma diagnosis. Therefore, glaucomatous patients would benefit from earlier
diagnosis and better therapy with more accurate ability of detection with
SD-OCT screening.
ACKNOWLEDGEMENTS
Foundations: Supported by the National Natural Science Foundation
of China (No.81300755); the Key Project of the Natural Science Foundation of
the Higher Educational Bureau of Anhui Province (No.KJ2013A147).
Conflicts
of Interest: Tao YL, None; Tao LM, None; Jiang ZX, None; Liu HT,
None; Liang K, None; Li MH, None; Zhu XS, None; Ren YL,
None; Cui BJ, None.
REFERENCES
1 Weinreb RN, Aung T, Medeiros FA. The pathophysiology
and treatment of glaucoma: a review. JAMA
2014;311(18):1901-1911. [CrossRef] [PMC free article]
[PubMed]
2 Weinreb RN, Khaw PT. Primary open-angle glaucoma. Lancet 2004;363(9422):1711-1720. [CrossRef]
3 Quigley HA, Broman AT. The number of people with
glaucoma worldwide in 2010 and 2020. Br J
Ophthalmol 2006;90(3):262-267.
[CrossRef] [PMC free article]
[PubMed]
4 Medeiros FA, Lisboa R, Weinreb RN, Liebmann JM,
Girkin C, Zangwill LM. Retinal ganglion cell count estimates associated with
early development of visual field defects in glaucoma. Ophthalmology 2013;120(4):736-744. [CrossRef] [PMC free article]
[PubMed]
5 Kuang TM, Zhang C, Zangwill LM, Weinreb RN, Medeiros
FA. Estimating lead time gained by optical coherence tomography in detecting
glaucoma before development of visual field defects. Ophthalmology 2015;122(10):2002-2009. [CrossRef] [PMC free article]
[PubMed]
6 Seong M, Sung KR, Choi EH, Kang SY, Cho JW, Um TW,
Kim YJ, Park SB, Hong HE, Kook MS. Macular and peripapillary retinal nerve
fiber layer measurements by spectral domain optical coherence tomography in
normal-tension glaucoma. Invest
Ophthalmol Vis Sci 2010;51(3):1446-1452. [CrossRef] [PubMed]
7 Fang Y, Pan YZ, Li
M, Qiao RH, Cai Y. Diagnostic capability of Fourier-Domain optical coherence
tomography in early primary open angle glaucoma. Chin Med J (Engl) 2010;123(15):2045-2050.
8 Le PV, Tan O, Chopra V, Ragab O, Varma R, Huang D.
Regional correlation among ganglion cell complex, nerve fiber layer, and visual
field loss in glaucoma. Invest Ophthalmol
Vis Sci 2013;54(6):4287-4295. [CrossRef] [PMC free article]
[PubMed]
9 Fortune B, Cull G, Reynaud J, Wang L, Burgoyne CF.
Relating retinal ganglion cell function and retinal nerve fiber layer (RNFL)
retardance to progressive loss of RNFL thickness and optic nerve axons in
experimental glaucoma. Invest Ophthalmol
Vis Sci 2015;56(6):3936-3944. [CrossRef] [PMC free article]
[PubMed]
10 Le PV, Zhang X, Francis BA, Varma R, Greenfield DS,
Schuman JS, Loewen N, Huang D; Advanced Imaging for Glaucoma Study Group.
Advanced imaging for glaucoma study: design, baseline characteristics, and
inter-site comparison. Am J Ophthalmol
2015;159(2):393-403. [CrossRef]
[PMC free
article] [PubMed]
11 Balendra SI, Normando EM, Bloom PA, Cordeiro MF.
Advances in retinal ganglion cell imaging. Eye
(Lond) 2015;29(10):1260-1269. [CrossRef] [PMC free article]
[PubMed]
12 Kotowski J, Wollstein G, Ishikawa H, Schuman JS.
Imaging of the optic nerve and retinal nerve fiber layer: an essential part of
glaucoma diagnosis and monitoring. Surv
Ophthalmol 2014;59(4):458-467.
[CrossRef] [PMC free article]
[PubMed]
13 Vizzeri G, Kjaergaard SM, Rao HL, Zangwill LM. Role
of imaging in glaucoma diagnosis and follow-up. Indian J Ophthalmol 2011;59 Suppl:S59-S68. [CrossRef] [PMC free article]
[PubMed]
14 Leung CK, Chiu V, Weinreb RN, Liu S, Ye C, Yu M,
Cheung CY, Lai G, Lam DS. Evaluation of retinal nerve fiber layer progression
in glaucoma: a comparison between spectral-domain and time-domain optical
coherence tomography. Ophthalmology
2011;118(8):1558-1562. [CrossRef]
[PubMed]
15 Leung CK, Cheung CY, Weinreb RN, Qiu K, Liu S, Li
H, Xu G, Fan N, Pang CP, Tse KK, Lam DS. Evaluation of retinal nerve fiber
layer progression in glaucoma: a study on optical coherence tomography guided
progression analysis. Invest Ophthalmol
Vis Sci 2010;51(1):217-222. [CrossRef] [PubMed]
16 Moreno PA, Konno B, Lima VC, Castro DP, Castro LC,
Leite MT, Pacheco MA, Lee JM, Prata TS. Spectral-domain optical coherence
tomography for early glaucoma assessment: analysis of macular ganglion cell
complex versus peripapillary retinal nerve fiber layer. Can J Ophthalmol 2011;46(6):543-547. [CrossRef] [PubMed]
17 Berthold AJ, Hoang
AM, Just A, Wirbelauer C. Relevant parameters of optic nerve analysis from
spectral domain OCT for glaucoma diagnostics. Klin Monbl Augenheilkd 2015;232(9):1086-1091.
18 Lisboa R, Paranhos A Jr, Weinreb RN, Zangwill LM,
Leite MT, Medeiros FA. Comparison of different spectral domain OCT scanning
protocols for diagnosing preperimetric glaucoma. Invest Ophthalmol Vis Sci 2013;54(5):3417-3425. [CrossRef] [PMC free article]
[PubMed]
19 Fanihagh F, Kremmer S, Anastassiou G, Schallenberg
M. Optical coherence tomography, scanning laser polarimetry and confocal scanning
laser ophthalmoscopy in retinal nerve fiber layer measurements of glaucoma
patients. Open Ophthalmology J
2015;9:41-48. [CrossRef]
[PMC free
article] [PubMed]
20 Chong GT, Lee RK. Glaucoma versus red disease:
imaging and glaucoma diagnosis. Curr Opin
Ophthalmol 2012;23(2):79-88. [CrossRef] [PubMed]
21 Sullivan-Mee M, Ruegg CC, Pensyl D, Halverson K,
Qualls C. Diagnostic precision of retinal nerve fiber layer and macular
thickness asymmetry parameters for identifying early primary open-angle
glaucoma. Am J Ophthalmol
2013;156(3):567-577.e1. [CrossRef]
[PubMed]
22 Medeiros FA, Zangwill LM, Bowd C, Vessani RM,
Susanna R Jr, Weinreb RN. Evaluation of retinal nerve fiber layer, optic nerve
head, and macular thickness measurements for glaucoma detection using optical
coherence tomography. Am J Ophthalmol 2005;139(1):44-55.
[CrossRef] [PubMed]
23 Park HY, Shin HY, Yoon JY, Jung Y, Park CK.
Intereye Comparison of cirrus OCT in early glaucoma diagnosis and detecting
photographic retinal nerve fiber layer abnormalities. Invest Ophthalmol Vis Sci 2015;56(3):1733-1742. [CrossRef] [PubMed]
24 Leung CK, Lam S, Weinreb RN, Liu S, Ye C, Liu L, He
J, Lai GW, Li T, Lam DS. Retinal nerve fiber layer imaging with spectral-domain
optical coherence tomography: analysis of the retinal nerve fiber layer map for
glaucoma detection. Ophthalmology
2010;117(9):1684-1691. [CrossRef]
[PubMed]
25 Huang D, Swanson EA, Lin CP, Schuman JS, Stinson
WG, Chang W, Hee MR, Flotte T, Gregory K, Puliafito CA. Optical coherence
tomography. Science
1991;254(5035):1178-1181. [CrossRef]
26 Polo V, Larrosa JM, Ferreras A, Mayoral F, Pueyo V,
Honrubia FM. Retinal nerve fiber layer evaluation in open-angle glaucoma.
Optimum criteria for optical coherence tomography. Ophthalmologica 2009;223(1):2-6. [CrossRef] [PubMed]
27 Schrems WA, Schrems-Hoesl LM, Bendschneider D,
Mardin CY, Laemmer R, Kruse FE, Horn FK. Predicted and measured retinal nerve
fiber layer thickness from time-domain optical coherence tomography compared
with spectral-domain optical coherence tomography. JAMA Ophthalmol 2015;133(10):1135-1143. [CrossRef] [PubMed]
28 Hong S, Seong GJ, Kim SS, Kang SY, Kim CY.
Comparison of peripapillary retinal nerve fiber layer thickness measured by
spectral vs. time domain optical coherence tomography. Curr Eye Res 2011;36(2): 125-134. [CrossRef] [PubMed]
29 Mulak M, Cicha A,
Kaczorowski K, Markuszewski B, Misiuk-Hojło M. Using Spectralis and Stratus
optical coherence tomography devices to analyze the retinal nerve fiber layer
in patients with open-angle glaucoma- preliminary report. Adv Clin Exp Med 2013;22(6):831-837.
30 Blumberg DM, Dale E, Pensec N, Cioffi GA, Radcliffe
N, Pham M, Al-Aswad L, Reynolds M, Ciarleglio A. Discrimination of glaucoma
patients from healthy individuals using combined parameters from
spectral-domain optical coherence tomography in an African American population.
J Glaucoma 2016;25(3):196-203. [CrossRef] [PubMed]
31 Ng DS, Gupta P,
Tham YC, Peck CF, Wong TY, Ikram MK, Cheung CY. Repeatability of perimacular
ganglion cell complex analysis with spectral-domain optical coherence
tomography. J Ophthalmol
2015;2015:605940.
32 Akashi A, Kanamori A, Nakamura M, Fujihara M,
Yamada Y, Negi A. The ability of macular parameters and circumpapillary retinal
nerve fiber layer by three SD-OCT instruments to diagnose highly myopic
glaucoma. Invest Ophthalmol Vis Sci
2013;54(9):6025-6032. [CrossRef]
[PubMed]
33 Akashi A, Kanamori A, Nakamura M, Fujihara M,
Yamada Y, Negi A. Comparative assessment for the ability of Cirrus, RTVue, and
3D-OCT to diagnose glaucoma. Invest
Ophthalmol Vis Sci 2013;54(7):4478-4484. [CrossRef] [PubMed]
34 Adhi M, Liu JJ, Qavi AH, Grulkowski I, Fujimoto JG,
Duker JS. Enhanced visualization of the choroido-scleral interface using swept-source
OCT. Ophthalmic Surg Lasers Imaging
Retina 2013;44(6 Suppl): S40- S42. [CrossRef] [PubMed]
35 Omodaka K, Horii T, Takahashi S, Kikawa T,
Matsumoto A, Shiga Y, Maruyama K, Yuasa T, Akiba M, Nakazawa T. 3D evaluation
of the lamina cribrosa with swept-source optical coherence tomography in normal
tension glaucoma. PLoS One
2015;10(4):e0122347. [CrossRef]
[PMC free
article] [PubMed]
36 Langenegger SJ, Funk J, Toteberg-Harms M.
Reproducibility of retinal nerve fiber layer thickness measurements using the
eye tracker and the retest function of Spectralis SD-OCT in glaucomatous and
healthy control eyes. Invest Ophthalmol
Vis Sci 2011;52(6):3338-3344. [CrossRef]
37 Patel NB, Wheat JL, Rodriguez A, Tran V, Harwerth
RS. Agreement between retinal nerve fiber layer measures from Spectralis and
Cirrus spectral domain OCT. Optom Vis Sci
2012;89(5):E652-E666. [CrossRef] [PMC free article] [PubMed]
38 Zhao L, Wang Y, Chen CX, Xu L, Jonas JB. Retinal
nerve fibre layer thickness measured by Spectralis spectral-domain optical
coherence tomography: The Beijing Eye Study. Acta Ophthalmol 2014;92(1): e35-e41. [CrossRef]
[PubMed]
39 Xiao GG, Wu LL. Optic disc analysis with Heidelberg
Retina Tomography III in glaucoma with unilateral visual field defects. Jpn J Ophthalmol 2010;54(4):305-309. [CrossRef] [PubMed]
40 Pablo LE, Ferreras A, Fogagnolo P, Figus M, Pajarin
AB. Optic nerve head changes in early glaucoma: a comparison between
stereophotography and Heidelberg retina tomography. Eye (Lond) 2010;24(1):123-130. [CrossRef]
[PubMed]
41 Arthur SN, Smith SD, Wright MM, Grajewski AL, Wang
Q, Terry JM, Lee MS. Reproducibility and agreement in evaluating retinal nerve
fibre layer thickness between Stratus and Spectralis OCT. Eye (Lond) 2011;25(2):192-200. [CrossRef]
[PMC free article] [PubMed]
42 Leite MT, Rao HL, Zangwill LM, Weinreb RN, Medeiros
FA. Comparison of the diagnostic accuracies of the Spectralis, Cirrus, and
RTVue optical coherence tomography devices in glaucoma. Ophthalmology 2011;118(7):1334-1339. [CrossRef]
43 Nukada M, Hangai M, Mori S, Nakano N, Nakanishi H,
Ohashi-Ikeda H, Nonaka A, Yoshimura N. Detection of localized retinal nerve
fiber layer defects in glaucoma using enhanced spectral-domain optical
coherence tomography. Ophthalmology
2011;118(6):1038-1048. [CrossRef] [PubMed]
44 Abe RY, Gracitelli CP, Medeiros FA. The use of
spectral-domain optical coherence tomography to detect glaucoma progression. Open Ophthalmol J 2015;9:78-88. [CrossRef] [PMC free article] [PubMed]
45 Garvin MK, Lee K, Burns TL, Abràmoff MD, Sonka M,
Kwon YH. Reproducibility of SD-OCT-based ganglion cell-layer thickness in
glaucoma using two different segmentation algorithms. Invest Ophthalmol Vis Sci 2013;54(10):6998-7004. [CrossRef]
[PMC free article] [PubMed]
46 Leung CK, Choi N, Weinreb RN, Liu S, Ye C, Liu L,
Lai GW, Lau J, Lam DS. Retinal nerve fiber layer imaging with spectral-domain
optical coherence tomography: pattern of RNFL defects in glaucoma. Ophthalmology 2010;117(12):2337-2344. [CrossRef] [PubMed]
47 Xu G, Weinreb RN, Leung CK. Retinal nerve fiber
layer progression in glaucoma: a comparison between retinal nerve fiber layer
thickness and retardance. Ophthalmology
2013;120(12):2493-2500. [CrossRef] [PubMed]
48 Rolle T, Dallorto L, Briamonte C, Penna RR. Retinal
nerve fibre layer and macular thickness analysis with Fourier domain optical
coherence tomography in subjects with a positive family history for primary
open angle glaucoma. Br J Ophthalmol
2014;98(9):1240-1244. [CrossRef] [PubMed]
49 Sung MS, Yoon JH, Park SW. Diagnostic validity of
macular ganglion cell-inner plexiform layer thickness deviation map algorithm
using cirrus HD-OCT in preperimetric and early glaucoma. J Glaucoma 2014;23(8):e144-e151. [CrossRef] [PubMed]
50 Wollstein G, Schuman JS, Price LL, Aydin A, Stark
PC, Hertzmark E, Lai E, Ishikawa H, Mattox C, Fujimoto JG, Paunescu LA. Optical
coherence tomography longitudinal evaluation of retinal nerve fiber layer
thickness in glaucoma. Arch Ophthalmol
2005;123(4):464-470. [CrossRef] [PMC free article] [PubMed]
51 Vazirani J, Kaushik S, Pandav SS, Gupta P.
Reproducibility of retinal nerve fiber layer measurements across the glaucoma
spectrum using optical coherence tomography. Indian J Ophthalmol 2015;63(4):300-305. [CrossRef]
52 Mansoori T, Viswanath K, Balakrishna N. Ability of
spectral domain optical coherence tomography peripapillary retinal nerve fiber
layer thickness measurements to identify early glaucoma. Indian J Ophthalmol 2011;59(6):455-459. [CrossRef] [PMC free article] [PubMed]
53 Firat PG, Doganay S, Demirel EE, Colak C.
Comparison of ganglion cell and retinal nerve fiber layer thickness in primary
open-angle glaucoma and normal tension glaucoma with spectral-domain OCT. Graefes Arch Clin Exp Ophthalmol
2013;251(3):831-838. [CrossRef] [PubMed]
54 Suh MH, Kim SK, Park KH, Kim DM, Kim SH, Kim HC.
Combination of optic disc rim area and retinal nerve fiber layer thickness for
early glaucoma detection by using spectral domain OCT. Graefes Arch Clin Exp Ophthalmol 2013;251(11):2617-2625. [CrossRef] [PubMed]
55 Park SB, Sung KR, Kang SY, Kim KR, Kook MS.
Comparison of glaucoma diagnostic capabilities of Cirrus HD and Stratus optical
coherence tomography. Arch Ophthalmol
2009;127(12):1603-1609. [CrossRef] [PubMed]
56 Nouri-Mahdavi K, Hoffman D, Tannenbaum DP, Law SK,
Caprioli J. Identifying early glaucoma with optical coherence tomography. Am J Ophthalmol 2004;137(2):228-235. [CrossRef] [PubMed]
57 Chen HY, Chang YC. Meta-analysis of stratus OCT
glaucoma diagnostic accuracy. Optom Vis
Sci 2014;91(9):1129-1139. [CrossRef] [PubMed]
58 Tan O, Li G, Lu AT, Varma R, Huang D. Advanced
Imaging for Glaucoma Study Group. Mapping of macular substructures with optical
coherence tomography for glaucoma diagnosis. Ophthalmology 2008;115(6):949-956. [CrossRef] [PMC free article] [PubMed]
59 Kerrigan-Baumrind
LA, Quigley HA, Pease ME, Kerrigan DF, Mitchell RS. Number of ganglion cells in
glaucoma eyes compared with threshold visual field tests in the same persons. Invest Ophthalmol Vis Sci
2000;41(3):741-748.
60 Oli A, Joshi D. Can ganglion cell complex
assessment on cirrus HD OCT aid in detection of early glaucoma? Saudi J Ophthalmol 2015;29(3):201-204. [CrossRef] [PMC free article] [PubMed]
61 Yang Z, Tatham AJ, Weinreb RN, Medeiros FA, Liu T,
Zangwill LM. Diagnostic ability of macular ganglion cell inner plexiform layer
measurements in glaucoma using swept source and spectral domain optical
coherence tomography. PLoS One
2015;10(5):e0125957. [CrossRef] [PMC free article] [PubMed]
62 Padhy D, Rao A. Macular ganglion cell/inner
plexiform layer measurements by spectral domain optical coherence tomography
for detection of early glaucoma and comparison to retinal nerve fiber layer
measurements. Am J Ophthalmol
2014;158(1):211. [CrossRef] [PubMed]
63 Sung KR, Sun JH, Na JH, Lee JY, Lee Y. Progression
detection capability of macular thickness in advanced glaucomatous eyes. Ophthalmology 2012;119(2):308-313. [CrossRef] [PubMed]
64 Na JH, Sung KR, Lee JR, Lee KS, Baek S, Kim HK,
Sohn YH. Detection of glaucomatous progression by spectral-domain optical
coherence tomography. Ophthalmology
2013;120(7):1388-1395. [CrossRef] [PubMed]
65 Leung CK, Ye C, Weinreb RN, Yu M, Lai G, Lam DS.
Impact of age-related change of retinal nerve fiber layer and macular
thicknesses on evaluation of glaucoma progression. Ophthalmology 2013;120(12):2485-2492. [CrossRef] [PubMed]
66 Kim NR, Lee ES, Seong GJ, Kim JH, An HG, Kim CY.
Structurefunction relationship and diagnostic value of macular ganglion cell
complex measurement using Fourier-domain OCT in glaucoma. Invest Ophthalmol Vis Sci 2010;51(9):4646-4651. [CrossRef]
[PubMed]
67 Cho JW, Sung KR, Lee S, Yun SC, Kang SY, Choi J, Na
JH, Lee Y, Kook MS. Relationship between visual field sensitivity and macular
ganglion cell complex thickness as measured by spectral-domain optical
coherence tomography. Invest Ophthalmol
Vis Sci 2010;51(12):6401-6407. [CrossRef]
[PubMed]
68 Lee M, Yoo H, Ahn J. Comparison of disc analysis
algorithms provided by cirrus oct and stereo optic-disc photography in normal
and open angle glaucoma patients. Curr
Eye Res 2013;38(5):605-613. [CrossRef] [PubMed]
69 Shoji T, Kuroda H, Suzuki M, Baba M, Hangai M,
Araie M, Yoneya S. Correlation between lamina cribrosa tilt angles, myopia and
glaucoma using OCT with a wide bandwidth femtosecond mode-locked laser. PLoS One 2014;9(12):e116305. [CrossRef] [PMC free article] [PubMed]
70 Kim YW, Kim DW, Jeoung JW, Kim DM, Park KH.
Peripheral lamina cribrosa depth in primary open-angle glaucoma: a swept-source
optical coherence tomography study of lamina cribrosa. Eye (Lond) 2015;29(10):1368-1374. [CrossRef]
[PMC free article] [PubMed]
71 Sawada Y, Hangai M, Murata K, Ishikawa M, Yoshitomi
T. Lamina cribrosa depth variation measured by spectral-domain optical
coherence tomography within and between four glaucomatous optic disc
phenotypes. Invest Ophthalmol Vis Sci
2015;56(10):5777-5784. [CrossRef]
[PubMed]
72 Lamparter J, Schulze A, Riedel J,
Wasielica-Poslednik J, König J, Pfeiffer N, Hoffmann EM. Peripapillary
choroidal thickness and choroidal area in glaucoma, ocular hypertension and
healthy subjects by SD-OCT. Klin Monbl
Augenheilkd 2015;232(4):390-394. [CrossRef] [PubMed]
73 Chebil A, Maamouri R, Ben Abdallah M, Ouderni M,
Chaker N, El Matri L. Foveal choroidal thickness assessment with SD-OCT in high
myopic glaucoma. J Fr Ophtalmol
2015;38(5):440-444. [CrossRef] [PubMed]
74 Ghany AF, Botros
SM, El-Raggal TM. Central retinal artery resistive index and optical coherence
tomography in assessment of glaucoma progression. Int J Ophthalmol 2015;8(2):305-309.
75 Wang X, Jiang C, Ko T, Yu X, Min W, Shi G, Sun X.
Correlation between optic disc perfusion and glaucomatous severity in patients
with open-angle glaucoma: an optical coherence tomography angiography study. Graefes Arch Clin Exp Ophthalmol 2015;253(9):1557-1564.
[CrossRef] [PubMed]
76 Jia Y, Wei E, Wang X, Zhang X, Morrison JC, Parikh
M, Lombardi LH, Gattey DM, Armour RL, Edmunds B, Kraus MF, Fujimoto JG, Huang
D. Optical coherence tomography angiography of optic disc perfusion in
glaucoma. Ophthalmology
2014;121(7):1322-1332. [CrossRef] [PMC free article] [PubMed]
77 Liu L, Jia Y, Takusagawa HL, Pechauer AD, Edmunds
B, Lombardi L, Davis E, Morrison JC, Huang D. Optical coherence tomography
angiography of the peripapillary retina in glaucoma. JAMA Ophthalmol
2015;133(9):1045-1052. [CrossRef] [PMC free article] [PubMed]