
・Clinical Research・ Current
Issue IF in JCR CiteScore ・Submission・ In Press Recent Accepted PMC RSS
Citation: Li M, Guo JM, Xu XL, Wang JM. Diurnal macular choroidal area fluctuation
in normal and primary open angle glaucoma groups. Int J Ophthalmol 2017;10(8):1233-1238
Diurnal macular choroidal area fluctuation in
normal and primary open angle glaucoma groups
Mu Li1, Jin-Min Guo1,
Xiao-Lan Xu1,2, Jun-Ming Wang 1
1Department of Ophthalmology, Tongji Hospital, Tongji Medical
College, Huazhong University of Science and Technology, Wuhan 430030, Hubei
Province, China
2Department of Ultrasound, Tongji Hospital, Tongji Medical College,
Huazhong University of Science and Technology, Wuhan 430030, Hubei Province,
China
Correspondence
to: Xiao-Lan Xu and Jun-Ming Wang. Department of Ophthalmology, Tongji
Hospital, Tongji Medical College, Huazhong University of Science and
Technology, No.1095 Jiefang Road, Wuhan 430030, Hubei Province, China.
xxllisamxcz2008@126.com; yksys32438@ 163.com
Received:
2016-12-26
Accepted: 2017-04-24
Abstract
AIM: To
assess and compare the diurnal macular choroidal area fluctuation in normal and
primary open angle glaucoma (POAG) groups using enhanced depth imaging optical
coherence tomography (EDI-OCT).
METHODS: Twenty-eight
normal and 27 POAG eyes were enrolled in this study. EDI-OCT was used to
measure the macular choroidal area every 3h from 9:00 a.m. to 21:00 p.m.
RESULTS: Significant
diurnal fluctuations of macular choroidal area were observed in both normal (P=0.003)
and POAG groups (P<0.001). But no significant macular choroidal area
difference has been found between the two groups at all the five measurement
time-points (512778±166242 vs 455079±207278 µm², P=0.195 at 9:00
a.m.; 501526±168953 vs 447846±211147 µm², P=0.245 at 12:00 a.m.;
501982±173158 vs 448024±206653 µm², P=0.239 at 15:00 p.m.;
508912±174589 vs 457783±207081 µm², P=0.252 at 18:00 p.m.;
503787±171241 vs 453230±205955 µm², P=0.274 at 21:00 p.m.;
respectively). Furthermore, neither the fluctuation manners nor the change in
macular choroidal area between the two adjacent measurement time points showed
significant difference between normal and POAG groups (all P>0.05).
In the meantime, significant diurnal intraocular pressure fluctuations were
also observed in normal and POAG groups (both P<0.001).
CONCLUSION: In
diurnal time, the macular choroidal area in both normal and POAG groups
fluctuated significantly; moreover, neither the value of macular choroidal
area, nor the fluctuation of macular choroidal area in POAG group is
significantly different from that in normal group.
KEYWORDS: diurnal fluctuation; macular choroidal area; primary open angle
glaucoma; optical coherence tomography
DOI:10.18240/ijo.2017.08.08
Citation: Li M, Guo JM, Xu XL, Wang JM. Diurnal macular choroidal area fluctuation
in normal and primary open angle glaucoma groups. Int J Ophthalmol 2017;10(8):1233-1238
INTRODUCTION
Primary
open angle glaucoma (POAG) is a leading cause of irreversible blinding disease
characterized by progressive degeneration of retinal ganglion cells, resulting
in the glaucomatous change of the optic disc and corresponding defect of visual
field[1]. For most POAG patients, we could observe that the progress
of visual field defect was from periphery (e.g. paracentral scotoma or
arcuate scotoma) to the center. In addition, Rao et al[2]
also found the rate of mean deviation (MD) change was less negative in eyes
with more severe visual field loss at baseline. Hence, the changing rate of MD
would slow down with the progression of POAG. So the central visual acuity of
most POAG patients could remain undamaged as the normal individuals for a long
time and only in the late severe stage of POAG would the central visual acuity
be damaged.
According
to the neurovascular unit theory[3-4], the function of neuron and
vessels were combined together. In addition, the blood supply of macula is only
from the choroid due to lack of retinal vessels and the choroid is the main
vascular layer of eye[5]. So the macular choroid might be of great
importance for the central visual acuity. In 1990s, histological studies
observed both thickened and thinned choroidal thickness in POAG patients[6-7].
But recently, many studies reported no significant macular choroidal thickness
difference between normal and POAG eyes by enhanced depth imaging optical
coherence tomography (EDI-OCT)[8-9]. Using the same method, Rhew et
al[10] and Park et al[11] found the similar
result between normal and normal tension glaucoma eyes. Furthermore, the
Meta-analysis result of Wang and Zhang[12] suggested that there was
no significant difference of the macular choroidal thickness between normal and
POAG eyes. So as a neurovascular unit, the function of the macula (central
visual acuity) and the macular choroidal thickness in POAG patients remained
the same as that of normal individuals.
For
normal tension glaucoma patients, intraocular pressure (IOP) could be in normal
range but had an abnormal fluctuation with the progress of visual field defect[13],
indicating the dynamic parameter is as important as the static parameter. And
just as the other ocular parameters, like IOP, axial length (AL) and anterior
chamber depth[14-17], the macular choroid also did not stay
unchanged in the whole day, but had a fluctuation[18]. So although
there was no significant choroidal thickness difference between normal and POAG
eyes according to the one-off measurement, however whether the fluctuation of
choroidal thickness of POAG patients was similar to that of normal individuals
was for now still not clear. To answer this question, we aimed to observe and
compare the diurnal fluctuation of choroidal thickness between POAG patients
and normal controls using EDI-OCT, which was a non-invasive, real-time, high
resolution, high speed measurement method. In the meantime, we also hoped to
study the correlation between the change in IOP and the change in macular choroidal
thickness in both enrolled groups. And considering the higher accuracy of
two-dimensional measurement than that of one-dimensional measurement and the
reduced measurement bias caused by choroidal thickness variation in different
choroidal region, we chose choroidal area instead of thickness measurement.
SUBJECTS AND METHODS
This
study was conducted in accordance with the tenets of the Declaration of
Helsinki and was approved by the Ethics Committee of the Tongji Hospital,
Medical College, Huazhong University of Science and Technology, Wuhan, China.
Written informed consents were obtained from all the research participants
before enrolling them in this study. Registry number is ChiCTR-RCC-14004831.
In
this prospective research, we recruited 28 eyes from 28 normal individuals and
27 eyes from 27 POAG patients (one eye of each subject was randomly selected to
eliminate the intereye correlation between two eyes of one subject). All the
eyes received the same ophthalmic examinations, including the best-corrected
visual acuity (BCVA), refractive error (RE), IOP measurement by non-contact
tomometer (NIDEK RT-2100; NIDEK, Co., Ltd., Gamagori, Japan), systolic blood
pressure (SBP) and diastolic blood pressure (DBP) measurement (OmronHEM-7201;
Omron, Dalian, Liaoning Province, China), slit-lamp microscopy examination,
indirect ophthalmoscope, anterior chamber angle examination using gonioscopy,
visual field test (30-2, SITA fast) using Humphrey Field Analyzer (Carl Zeiss
Meditec, Dublin, USA), central corneal thickness (CCT) using pachymetry map
(anterior segment OCT, Carl Zeiss Meditec, Dublin, USA), AL using IOL-master
(Carl Zeiss Meditec, Dublin, USA), choroid images and retinal nerve fiber layer
thickness using spectral-domain optical coherence tomography (SD-OCT;
Heidelberg Engineering GmbH, Heidelberg, Germany).
Subjects
were included in the POAG group if all of the following were true: 1) at least
18 years of age; 2) cup-to-disc (C/D) ratio ≥0.6 with an interocular C/D ratio difference
≥0.2; 3) retinal nerve fiber layer defect was present; 4) glaucomatous visual
field defects corresponding to optic nerve changes were present; 5) normal
anterior chamber depth with an open angle; 6) RE between +3.0 and -6.0 diopters
(D). Patients who had a history of eye disease (except for POAG disease) or any
prior ocular surgeries or poor OCT images quality were excluded from
participation. Patients with systemic disease were also excluded. Normal
subjects were included if all of the following were true: 1) at least 18 years
of age; 2) normal fundus; 3) normal visual field; 4) normal anterior chamber
depth with an open angle; 5) RE between +3.0 and -6.0 D. Potential control
patients were excluded from participation if they had a family history of
glaucoma, a history of ophthalmic disease or surgery, or systemic disease or
poor OCT images quality[19].
IOP
and the macular choroidal area were measured within 10min every 3h from 9:00
a.m. to 21:00 p.m. in a whole day. And we can calculate the mean arterial
pressure (MAP) and mean ocular perfusion pressure (MOPP) according to the
following formulas: MAP=DBP+1/3(SBP-DBP) and MOPP=2/3(MAP-IOP). Every
examination was performed in sitting position in every tested subject of the
whole tested day.
Enhanced
Depth Imaging Optical Coherence Tomography
EDI-OCT imaging has been previously reported, and with this
technique, we could finally visualize the full thickness of choroid[20].
The image was taken by 100 B-scans with the eye tracing function and the scan
angle was 30°[21]. We set the scan angle of the SD-OCT to be 30°, so
for every obtained imaging, the whole OCT picture represented 30°. Then from
the fovea to both of its sides we divided the image into 30 parts equally,
which means every part represented 1°. We chose the continuous 4 parts under
the fovea to be the macular choroidal area of that image (Figure 1). For every
eye in each measurement time point, a vertical and a horizontal OCT images were
obtained. Then the two data were averaged to represent the macular choroidal
area of the eye at that measurement time point.
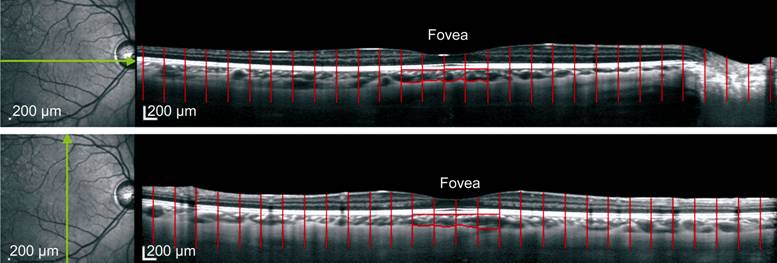
Figure
1 Example of macular choroidal area measurement From the
fovea to its both sides we divide the imaging into 30 areas, every area
represented 1°. For macula, the continuous 4 subfoveal areas (the red encircle
zone) represented the macular choroidal area of that image.
The
choroidal area was defined as the area between the outer border of the retinal
pigment epithelium (RPE) and the inner border of the sclera. For macular
imaging, both the sides (left and right border in the imaging) of the measured
area should be perpendicular to the RPE and the inner border of the sclera[22].
The observers, who were mask to the subject information, undertook the
measurement by using the software Image J (version 1.47, National Institutes of
Health, Bethesda, Maryland, USA). And the P-value for the interobserver
of the macular choroidal area measurement was greater than 0.05.
To
evaluate the correlation between the change in IOP and the change in macular
choroidal area, we chose the value of IOP and macular choroidal area at 9:00
a.m., when the diurnal macular choroidal area fluctuation study started, as the
baseline. The change in IOP or macular choroidal area was the difference
between the value of IOP or macular choroidal area at 12:00 a.m., 15:00 p.m.,
18:00 p.m. and 21:00 p.m. and the value of IOP or macular choroidal area at
9:00 a.m.
Statistical
Analysis The
statistical analyses were performed using the SPSS software package 19.0. Data
are shown as mean±standard deviation. The fluctuation of macular choroidal area
was analyzed by using a repeated-measures analysis of variance. Comparison of
parameters between POAG group and normal control group are done using
Mann-Whitney U test and correlations were evaluated by nonparametric
spearman correlation analyses. All tests were two-tailed and statistical
significance was defined as P value <0.05.
RESULTS
Demographic
Characteristics This study
enrolled 28 normal eyes and 27 POAG eyes. The demographic data are detailed in
Table 1. There was no significant difference in the mean age between the normal
individuals (36.04±8.04y) and those with POAG group (37.56±7.80y; P=0.367).
The percentage of female, RE, BCVA, AL, CCT, MOPP, MAP and DBP were similar in
two groups (all P>0.05). Significant difference in SBP can be seen
between the normal individuals and POAG patients (111.11±8.17 vs 115.70±5.30
mm Hg; P=0.023). And as expected, the MD of visual field were
significantly different between these two groups (-1.96±0.52 vs
-9.05±7.02 dB; P<0.001).
Table
1 Demographic characteristics of study subjects mean±SD
|
Parameters |
Normal
eyes |
POAG eyes |
P |
|
Age (a) |
36.04±8.04 |
37.56±7.80 |
0.367 |
|
Female (%) |
64.3 |
40.7 |
0.080 |
|
RE (D) |
-2.46±1.57 |
-2.41±1.95 |
0.893 |
|
BCVA |
0.94±0.18 |
0.93±0.19 |
0.900 |
|
AL (mm) |
24.73±0.56 |
24.95±1.46 |
0.674 |
|
CCT (µm) |
541.96±31.83 |
544.63±34.12 |
0.926 |
|
MOPP (mm
Hg) |
46.51±4.77 |
46.61±4.58 |
0.730 |
|
MAP (mm
Hg) |
86.79±6.01 |
87.90±5.02 |
0.276 |
|
SBP (mm
Hg) |
111.11±8.17 |
115.7±5.30 |
0.023a |
|
DBP (mm
Hg) |
74.50±5.88 |
74.00±6.83 |
0.906 |
|
MD (dB) |
-1.96±0.52 |
-9.05±7.02 |
<0.001a |
RE:
Refractive error; BCVA: Best-corrected visual acuity; AL: Axial length; CCT:
Central corneal thickness; MOPP: Mean ocular perfusion pressure; MAP: Mean
arterial pressure; SBP: Systolic blood pressure; DBP: Diastolic blood pressure;
MD: Mean deviation. aP<0.05.
Diurnal
Changes of Macular Choroidal Area Significant
diurnal variations of macular choroidal area in normal (P=0.003) and
POAG (P<0.001) groups could be detected (Table 2). In both normal and
POAG groups, the fluctuation rhythms of macular choroidal area were similar
(Figure 2). The macular choroidal area in the five measurement time points all
showed no significant difference between the two groups (all P>0.05;
Table 2). Furthermore, the change in macular choroidal area between the two
adjacent measurement time points (9:00 a.m. vs 12:00 a.m.; 12:00 a.m. vs
15:00 p.m.; 15:00 p.m. vs18:00 p.m.; 18:00 p.m. vs 21:00 p.m.,
respectively) showed no significant difference between normal and POAG groups
(all P>0.05; Table 3).
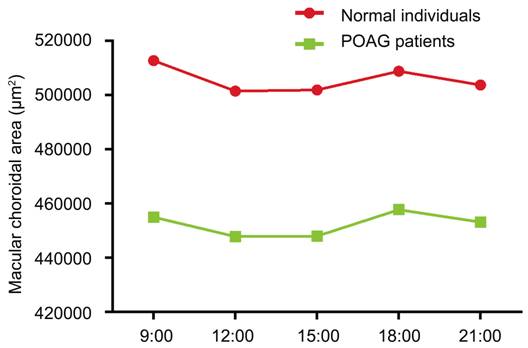
Figure
2 Fluctuations of macular choroid area of normal and POAG groups.
Table
2 Fluctuations of macular choroid area in normal and POAG groups
mean±SD
|
Choroidal
area (µm²) |
9:00 a.m. |
12:00 a.m. |
15:00 p.m. |
18:00 p.m. |
21:00 p.m. |
P |
|
Normal
group |
512778±166242 |
501526±168953 |
501982±173158 |
508912±174589 |
503787±171241 |
0.003a |
|
POAG group |
455079±207278 |
447846±211147 |
448024±206653 |
457783±207081 |
453230±205955 |
<0.001a |
|
P |
0.195 |
0.245 |
0.239 |
0.252 |
0.274 |
|
aP<0.05.
Table
3 The comparison of the macular choroidal area changes between the two adjacent
measurement time points in normal and POAG groups
mean±SD
|
The change
in choroidal area (µm²) |
9:00 a.m. vs
12:00 a.m. |
12:00 a.m.
vs 15:00 p.m. |
15:00 p.m.
vs 18:00 p.m. |
18:00 p.m.
vs 21:00 p.m. |
|
Normal
group |
-11252±14534 |
455±18882 |
6930±19468 |
-5125±14586 |
|
POAG group |
-7233±12905 |
177±14629 |
9759±13833 |
-4553±13540 |
|
P |
0.121 |
0.556 |
0.590 |
0.920 |
Diurnal
Changes of Intraocular Pressure and the Correlation Between the Change in
Macular Choroidal Area and the Change in Intraocular Pressure We observed
a significant fluctuation of IOP in normal and POAG groups (both P<0.001)
in diurnal time. In addition, IOP in the five measurement time points all
showed significant difference between the two groups (P=0.020, 0.002,
0.004, 0.041, and 0.008; respectively; Table 4).
Table
4 Fluctuations of IOP of normal and POAG groups mean±SD
|
IOP (mm
Hg) |
9:00 a.m. |
12:00 a.m. |
15:00 p.m. |
18:00 p.m. |
21:00 p.m. |
P |
|
Normal
group |
16.95±2.52 |
16.04±2.65 |
15.57±2.55 |
15.57±2.89 |
14.94±2.54 |
<0.001a |
|
POAG group |
18.22±2.35 |
18.07±2.31 |
17.50±2.53 |
16.55±2.11 |
16.94±2.25 |
<0.001a |
|
P |
0.020a |
0.002a |
0.004a |
0.041a |
0.008a |
- |
aP<0.05.
Furthermore,
for normal group, the change in IOP was significantly and positively correlated
with the change in macular choroidal area only between 12:00 a.m. and the
baseline time point (9:00 a.m.) (r=0.479, P=0.006). But no such
correlation has been found between 15:00 p.m., 18:00 p.m., 21:00 p.m. and the
baseline time-point (9:00 a.m.) (r=0.143, 0.322 and 0.353, respectively;
P=0.539, 0.073 and 0.066, respectively). For POAG group, no such
correlation has been found between 12:00 a.m., 15:00 p.m., 18:00 p.m., 21:00
p.m. and the baseline time-point (9:00 a.m.) (r=0.063, 0.242, 0.153 and
0.127, respectively; P=0.754, 0.224, 0.446 and 0.528, respectively;
Figure 3).
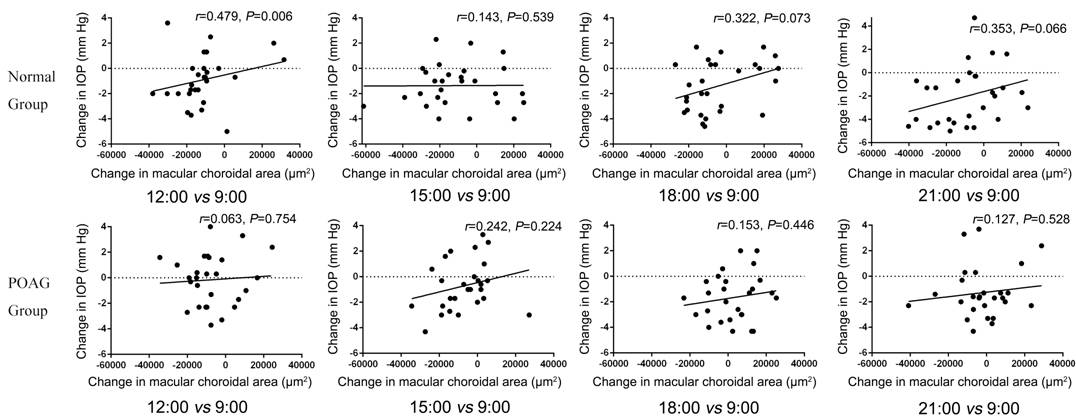
Figure
3 The correlation between the change in macular choroidal area and the change
in IOP.
DISCUSSION
In
this current study, we set the data at 9:00 a.m. as the baseline, and compared
the baseline macular choroid area between the healthy subjects and POAG
patients. Based on the results, we confirmed a lack of significant difference
of macular choroid area between the two tested groups, just as previous studies
have found[8-11,23] and this implied the higher IOP in POAG patients
could make the retinal nerve fiber layer thinner but not the macular choroid,
the macular choroid remained thick enough to maintain the central visual
acuity.
Up
to now, the mechanism of the choroid thickness variation is still obscure. Some
hypotheses were attempted to explain this physiological phenomenon, including
changes in the synthesis of the osmotically active poly proteoglycans, changes
of the vasopermeability in the choroid, changes in the amount of the fluid from
the anterior chamber, the movement of the fluid from the RPE to the choroid and
changes in the contraction of the nonvascular smooth muscle[24]. In
addition, the choroidal thickness also has some relationship with the other
ocular physiological parameters, like IOP and AL[25] and with the
systemic physiological parameters, like the blood pressure[22].
In
terms of the fluctuation, Lee et al[26] reported that choroid
thickness decreased all the way during the daytime significantly. By the study of
Usui et al[22] the choroid thickness has a peak value at 3:00
a.m. and a valley value at 18:00 p.m. The choroid thickness showed a downtrend
as well. But conversely, Chakraborty et al[17] found the
choroid thickness increased constantly from 12:00 a.m. to 21:00 p.m. Yet those
researches were all done in healthy subjects. In our study, we noticed that
there exists a significant fluctuation of the macular choroid area not only in
healthy subjects but also in POAG patients. But the macular choroid area fluctuation
diagram was not a straight line but a curve. It falls down from 9:00 a.m. and
then rebounds at 12:00 a.m. all the way up until 18:00 p.m. and then once more
falls down to 21:00 p.m. It was not exactly the same with the above mentioned
conclusion. This finding might indicate that by POAG patients we should take
the measurement time point into consideration when measuring the choroid
thickness or area, especially in the forenoon. Besides, we found that the
macular choroid area variation curve of normal and POAG groups were similar
during the daytime. By the statistical methods, we conclude that, in those two
groups, neither the fluctuation manners nor the change value of macular
choroidal area between the two adjacent measurement time points differs significantly
from each other, indicating that the fluctuation rhythm of macular choroidal
area were similar between normal and POAG groups.
So
based on the results of this study, we could find that not only the macular
choroidal area value, but also the fluctuation of the macular choroidal area in
the daytime were not different between normal and POAG groups. And as mentioned
above, the choroid was the only blood supply to the macula, which was the
determinate of the central visual acuity. So we speculated that no matter in
terms of statically or dynamically, the macular choroidal blood flow of POAG
patients could remain sufficient and change in the normal range within the day,
just as the normal individual, and could resist the mechanical compression of
IOP and maintain the central visual acuity. So this could be one reason for the
long-lasting of central visual acuity of POAG patients, especially in view of
the neurovascular unit theory, which combined the blood supply of vessels and
the function of nerve.
Furthermore,
we also studied the correlation between the change in macular choroidal area
and the change in IOP. As the result showed, for normal individuals, the change
in IOP was significantly positive correlated with the change in macular
choroidal area only between 12:00 a.m. and the baseline time-point (9:00 a.m.),
without such correlation between 15:00 p.m., 18:00 p.m., 21:00 p.m. and the
baseline time-point (9:00 a.m.). For POAG group, no such correlation has been
found between 12:00 a.m., 15:00 p.m., 18:00 p.m., 21:00 p.m. and the baseline
time-point (9:00 a.m.). Schuman et al[27] reported that the
degree of IOP elevation was associated with uveal thickening in healthy
individuals. But by that study, this was achieved by a valsalva maneuver, and
the venous pressure was also elevated in the episcleral veins and could
contribute to the IOP elevation. In this present study, significant correlation
between the change in IOP and the change in macular choroidal area was only observed
at 12:00 a.m. in normal group. So in physiological status, there might be no
correlation between the change in choroid and IOP in normal and POAG groups
because IOP was determined by multi-factors and had autonomic regulation
function[28].
The
present study had certain limitations. First, the sample size was relatively
small and we could not divide the patients with POAG into different subgroups
by stages for further analysis. Second, this study was only conducted in
diurnal time but not in nocturnal time. Third, the use of anti-glaucoma drugs
may affect the choroidal area, we did not take this factor into consideration.
Forth, the choroidal area or thickness could not fully represent the actual
choroidal microcirculation and metabolic status.
In
conclusion, both the macular choroidal area in normal and POAG groups showed
significant diurnal fluctuations. When comparing the macular choroidal area
between normal and POAG groups, not only the macular choroidal area, but also
the fluctuation of macular choroidal area of POAG patients in diurnal time was
not significantly different from that of normal individuals.
ACKNOWLEDGEMENTS
Conflicts
of Interest: Li M, None; Guo JM, None; Xu XL, None;
Wang JM, None.
REFERENCES
1 Flammer J, Mozaffarieh M. What is the present pathogenetic concept of
glaucomatous optic neuropathy? Sur
Ophthalmol 2007;52 Suppl 2:162-173. [CrossRef] [PubMed]
2 Rao HL, Kumar AU, Babu JG, Senthil S, Garudadri CS. Relationship
between severity of visual field loss at presentation and rate of visual field
progression in glaucoma. Ophthalmology
2011;118(2):249-253. [CrossRef] [PubMed]
3 Tao-Cheng JH, Nagy Z, Brightman MW. Tight junctions of brain
endothelium in vitro are enhanced by astroglia. J Neurosci 1987;7(10): 3293-3299. [PubMed]
4 Lo EH, Dalkara T, Moskowitz MA. Mechanisms, challenges and
opportunities in stroke. Nat Rev Neurosci
2003;4(5):399-415. [CrossRef] [PubMed]
5 Delaey C, Van de Voorde J. Regulatory mechanisms in the retinal and
choroidal circulation. Ophthalmic Res 2000;32(6):249-256.
[CrossRef] [PubMed]
6 Yin ZQ, Vaegan, Millar TJ, Beaumont P, Sarks S. Widespread choroidal
insufficiency in primary open-angle glaucoma. J Glaucoma 1997;6(1):23-32. [CrossRef] [PubMed]
7 Cristini G, Cennamo G, Daponte P. Choroidal thickness in primary
glaucoma. Ophthalmologica 1991;202(2):81-85.
[CrossRef]
8 Nakakura S, Yamamoto M, Terao E, Nagasawa T, Tabuchi H, Kiuchi Y. The
whole macular choroidal thickness in subjects with primary open angle glaucoma.
PLoS One 2014;9(10):e110265. [CrossRef] [PMC free article] [PubMed]
9 Zhang C, Tatham AJ, Medeiros FA, Zangwill LM, Yang Z, Weinreb RN.
Assessment of choroidal thickness in healthy and glaucomatous eyes using swept
source optical coherence tomography. PLoS
One 2014;9(10):e109683. [CrossRef] [PMC free article] [PubMed]
10 Rhew JY, Kim YT, Choi KR. Measurement of subfoveal choroidal
thickness in normal-tension glaucoma in Korean patients. J Glaucoma 2012;23(1):46-49. [CrossRef] [PubMed]
11 Park HY, Lee NY, Shin HY, Park CK. Analysis of macular and
peripapillary choroidal thickness in glaucoma patients by enhanced depth
imaging optical coherence tomography. J
Glaucoma 2014;23(4):225-231. [CrossRef]
12 Wang W, Zhang X. Choroidal thickness and primary open-angle glaucoma:
a cross-sectional study and meta-analysis. Invest
Ophthalmol Vis Sci 2014;55(9):6007-6014. [CrossRef] [PubMed]
13 Tojo N, Abe S, Ishida M, Yagou T, Hayashi A. The fluctuation of
intraocular pressure measured by a contact lens sensor in normal-tension
glaucoma patients and nonglaucoma subjects. J
Glaucoma 2017;26(3):195-200. [CrossRef] [PubMed]
14 Read SA, Collins MJ, Iskander DR. Diurnal variation of axial length,
intraocular pressure, and anterior eye biometrics. Invest Ophthalmol Vis Sci 2008;49(7):2911-2918. [CrossRef] [PubMed]
15 Loewen NA, Liu JH, Weinreb RN. Increased 24-hour variation of human
intraocular pressure with short axial length. Invest Ophthalmol Vis Sci 2010;51(2):933-937. [CrossRef] [PMC free article] [PubMed]
16 Mapstone R, Clark CV. Diurnal variation in the dimensions of the
anterior chamber. Arch Ophthalmol 1985;103(10):1485-1486. [CrossRef] [PubMed]
17 Chakraborty R, Read SA, Collins MJ. Diurnal variations in axial
length, choroidal thickness, intraocular pressure, and ocular biometrics. Invest Ophthalmol Vis Sci
2011;52(8):5121-5129. [CrossRef] [PubMed]
18 Tan CS, Ouyang Y, Ruiz H, Sadda SR. Diurnal variation of choroidal
thickness in normal, healthy subjects measured by spectral domain optical
coherence tomography. Invest Ophthalmol
Vis Sci 2012;53(1):261-266. [CrossRef] [PubMed]
19 Yan X, Li M, Chen Z, Zhu Y, Song Y, Zhang H. Schlemm's canal and
trabecular meshwork in eyes with primary open angle glaucoma: a comparative
study using high-frequency ultrasound biomicroscopy. PLoS One 2016;11(1):e0145824. [CrossRef] [PMC free article] [PubMed]
20 Spaide RF, Koizumi H, Pozzoni MC. Enhanced depth imaging
spectral-domain optical coherence tomography. Am J Ophthalmol 2008; 146(4):496-500. [CrossRef] [PubMed]
21 Hirooka K, Fujiwara A, Shiragami C, Baba T, Shiraga F. Relationship
between progression of visual field damage and choroidal thickness in eyes with
normal-tension glaucoma. Clin Exp
Ophthalmol 2012;40(6): 576-582.
[CrossRef] [PubMed]
22 Usui S, Ikuno Y, Akiba M, Maruko I, Sekiryu T, Nishida K, Iida T.
Circadian changes in subfoveal choroidal thickness and the relationship with
circulatory factors in healthy subjects. Invest
Ophthalmol Visual Sci 2012;53(4):2300-2307. [CrossRef] [PubMed]
23 Mwanza JC, Hochberg JT, Banitt MR, Feuer WJ, Budenz DL. Lack of
association between glaucoma and macular choroidal thickness measured with
enhanced depth-imaging optical coherence tomography. Invest Ophthalmol Visual Sci 2011;52(6):3430-3435. [CrossRef] [PMC free article] [PubMed]
24 Nickla DL, Wallman J. The multifunctional choroid. Prog Retin Eye Res 2010;29(2):144-168. [CrossRef] [PMC free article] [PubMed]
25 Hata M, Hirose F, Oishi A, Hirami Y, Kurimoto Y. Changes in choroidal
thickness and optical axial length accompanying intraocular pressure increase. Jpn J Ophthalmol 2012;56(6):564-568. [CrossRef] [PubMed]
26 Lee SW, Yu SY, Seo KH, Kim ES, Kwak HW. Diurnal variation in
choroidal thickness in relation to sex, axial length, and baseline choroidal
thickness in healthy Korean subjects. Retina
2014;34(2):385-393. [CrossRef] [PubMed]
27 Schuman JS, Massicotte EC, Connolly S, Hertzmark E, Mukherji B, Kunen
MZ. Increased intraocular pressure and visual field defects in high resistance
wind instrument players. Ophthalmology
2000;107(1): 127-133. [CrossRef]
28 Aptel F, Weinreb RN, Chiquet C, Mansouri K. 24-h monitoring devices
and nyctohemeral rhythms of intraocular pressure. Prog Retin
Eye Res 2016;55:108-148. [CrossRef] [PubMed]