INTRODUCTION
W ith the widespread use of cataract surgery, ophthalmologists have started preferring the use of increased vacuum during phacoemulsification to improve surgical efficiency. However, the high vacuum would lead to anterior chamber instability, resulting in the need for more infusion pressure to maintain stability[1]. Several studies have measured the intraocular pressure (IOP) during cataract surgery[2-4],showing that IOP was much higher than the pressure of central retinal artery. This high IOP could reduce retinal blood flow,causing retinal ischemia and eventually altering the cellular microenvironment, thus leading to retinal ganglion cell apoptosis.
Previous studies have shown that macular thickness and ganglion cell complex (GCC) thickness measured using optical coherence tomography (OCT) would increase postoperatively[2,5-6]. An increased macular thickness is associated with infusion time (IT) under high simulated dynamic intraocular pressure (SDIOP)[2]. However, the relationship between infusion pressure and the postoperative physiological state of retinal visual function remains unclear.Previous studies have focused only on best-corrected visual acuity (BCVA) changes after cataract surgery, but changes in the microenvironment are not experienced by patients[6].Therefore, we investigated whether a subclinical change would occur in retinal visual function in the early postoperative course and whether it was associated with IT. Moreover, we investigated whether a correlation exists between a change in retinal thickness and retinal function.
Table 1 Comparison of patient demographics and intraoperative data between the groups

aStatistical analysis with Pearson Chi-square; IOP: Intraocular pressure.
High IOP first affects the retinal ganglion cells. Recent studies have shown that the measurement of macular GCC thickness was better than the measurement of retinal nerve fibre layer(RNFL) thickness in glaucoma considering structure-function correlations[7-9]. Therefore, we used the Cirrus OCT device to quantitatively assess the changes in macular ganglion cellinner plexiform layer (mGC-IPL) thickness by the effect of infusion pressure during cataract surgery.
Fundus-related microperimetry is clinically useful for assessing macular function[9-10]. It focuses at 10° macular centre where the density of the retinal ganglion cells was highest[11].Therefore, it could help us detect ganglion cell deficits.
The magnocellular pathway of the retinal ganglion cells is known to be affected early by high IOP[12-13]. Histologically,these cells have large-diameter axons and are preferentially damaged in early glaucoma[14-15]. The magnocellular pathway is also sensitive to low levels of luminance contrast, with 15% contrast levels specifically highlighting the function of the magnocellular pathway[12]. Isolated-check visual evoked potential (icVEP) has been designed to tap the cortical activity initiated primarily by the afferents in the magnocellular pathway, thereby allowing it to detect early changes in the magnocellular pathway produced by the effect of high infusion pressure.Therefore, the aims of this study were as follows: 1) to use OCT and microperimetry to detect macular sensitivity changes and mGC-IPL thickness changes and 2) to use icVEP to investigate the effect of infusion pressure on the magnocellular pathway during cataract surgery to detect the relationship between IT and these changes.
SUBJECTS AND METHODS
This was a prospective observational cohort study. Participant enrolment and treatment took place at Peking University Third Hospital Eye Center, China. Written and fully informed consents were voluntarily provided by all participants prior to enrolment in the clinical study. The study and data collection were performed with approval from the Peking University Third Hospital Institutional Review Board.
Thirty-eight patients were enrolled in our study and sixty-one eyes were performed cataract surgery. The inclusion criteria were the presence of clinically age-related cataract with moderate media opacity, BCVA of 0.6 or better on the Snellen scale, and completion of the OCT, icVEP, and microperimetry tests. The exclusion criterion was the presence of any other ocular pathology except cataract or any other systemic diseases.
Patients were divided into two groups according to IT recorded using surgery equipment [Group A: IT>ITmean(27 eyes);Group B: IT<ITmean(34 eyes)]. The patient demographics and intraoperative data of these two groups were compared using independent sample t-test and Pearson Chi-square tests(Table 1).
All participants included in this study underwent a complete preoperative ophthalmologic examination including the following tests: BCVA, IOP measurement, slit-lamp examination,dilated fundus examination, and biometric measurements using the IOL-Master (Zeiss-Meditec, Jena, Germany).The preoperative evaluation was followed by a standard phacoemulsification and foldable IOL implantation surgery performed by the same surgeon using the Alcon Centurion Vision System (Alcon Laboratories, Inc.) at Peking University Third Hospital Eye Center. The infusion pressure was set at 55 mm Hg during the surgery. As the Alcon Centurion Vision System could stably control the infusion pressure at a certain level, we could take it as the IOP during the surgery. The total IT was recorded automatically by using the surgery equipment.The patients were treated with a combination of levofloxacin(Gravit), prednisolone acetate (Pred Forte), and pranoprofen eye drops 4 times per day for 1wk, which was then gradually reduced. None of the patients had any complications.
mGC-IPL thickness was measured using OCT, magnocellular pathway function was measured using icVEP, and macular sensitivity was measured using microperimetry. All measurements were conducted preoperatively and at 1wk and 1mo postoperatively.
Optical Coherence Tomography An OCT scan was performed using the OCT4000 system (Carl Zeiss Meditec) to obtain cross-sectional images of the mGC-IPL for measuring its thickness. mGC-IPL thickness included the thicknesses of the ganglion cell layer and the IPL. High-definition OCT provides a ganglion cell analysis program capable of measuring mGC-IPL thickness.
Table 2 Preoperative and postoperative (1wk and 1mo) mGC-IPL thickness and functional parameters(BCVA, icVEP, and microperimetry)
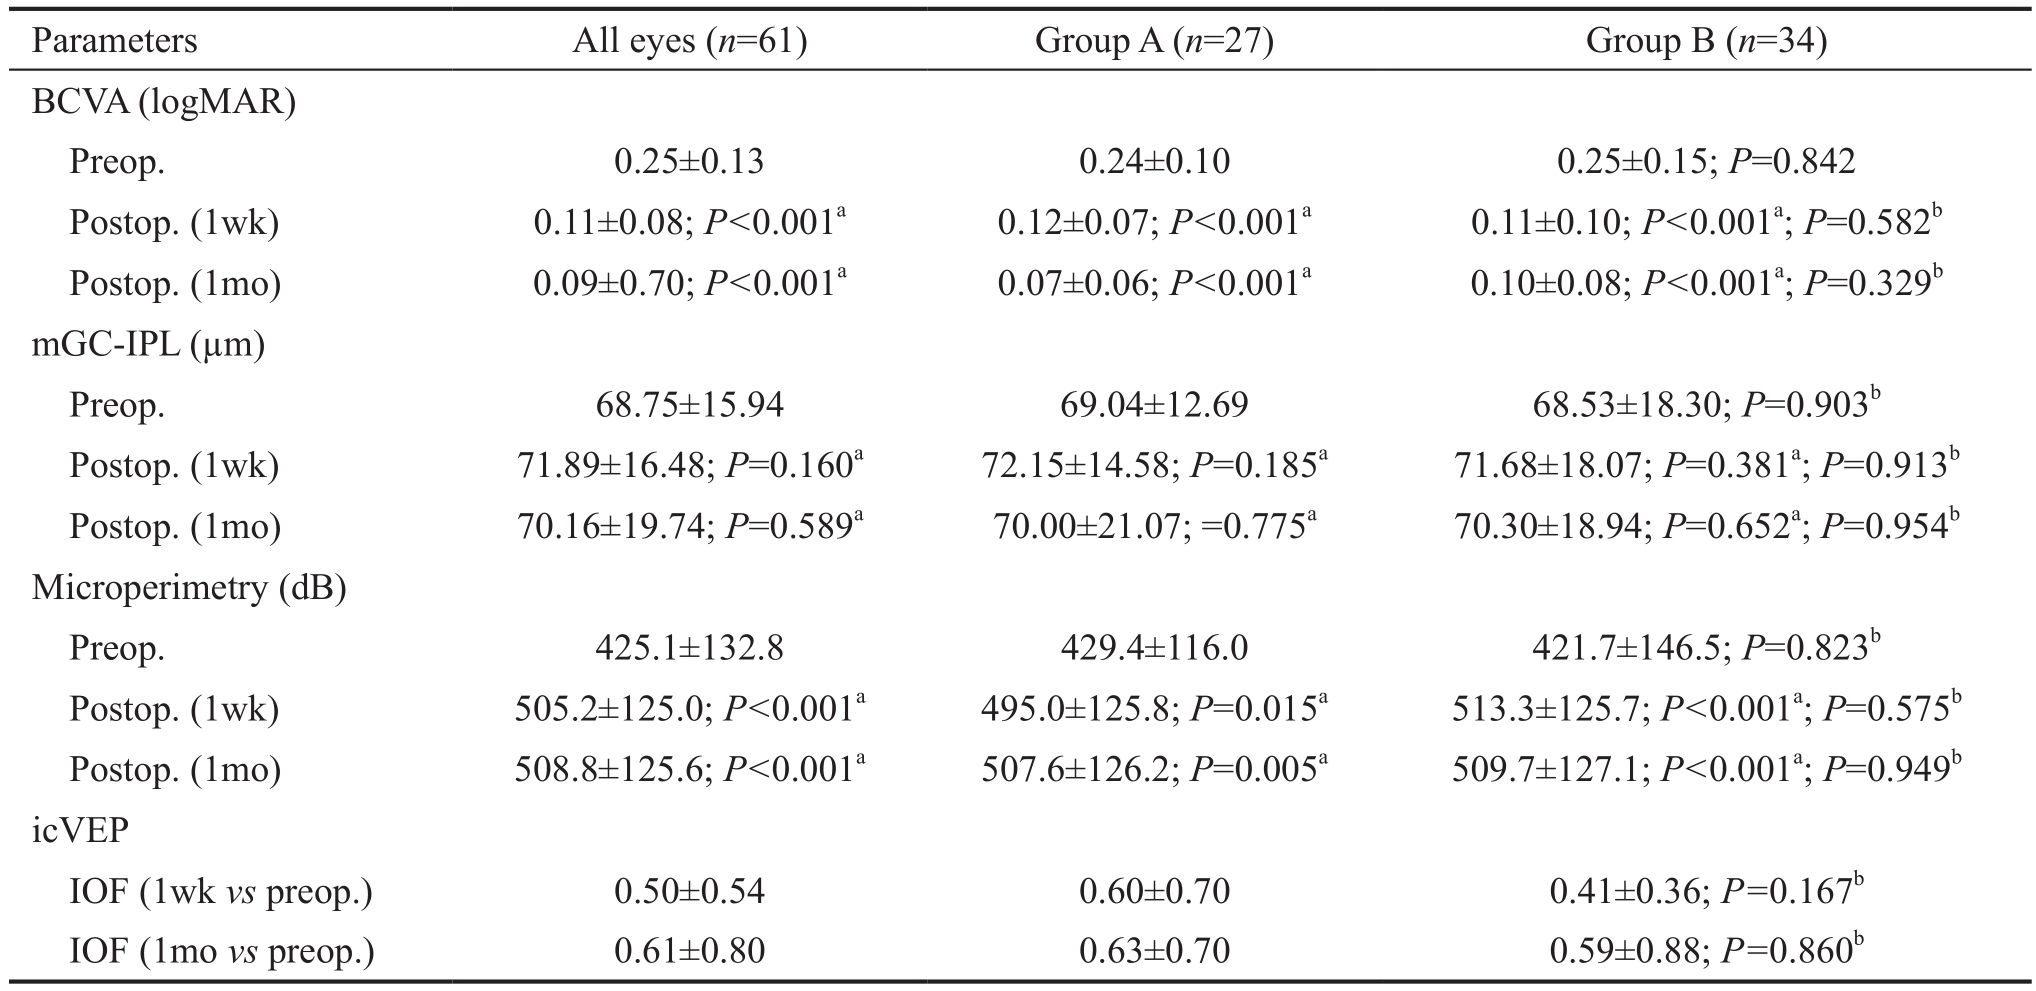
aP: Preoperative vs postoperative, paired t-test;bP: Group A vs Group B, Independent-sample t-test; BCVA: Best-corrected visual acuity;icVEP: Isolated-check visual evoked potential; IOF: Individual observed F value; mGC-IPL: Macular ganglion cell-inner plexiform layer.
Fundus-related Microperimetry Using an automated fundusrelated perimeter (MP1 Microperimeter; Nidek Technologies,Gamagori, Japan) the fundus was imaged in real-time on a video monitor with an infrared fundus camera (768×576-pixel resolution). A stimulus was projected to a specific area of the fundus while a retinal image was captured and real-time results were shown on a video monitor. Background illumination was set on 4 apostilb (asb). Stimulus intensity was varied on a onestep scale from 0 to 20 dB; the duration of the stimulus was set to 200ms. A 4-2 Goldmann III strategy was applied to cover 76 spots within 20° of the fundus. Eyes with more than 25%fixation points located within a 4° diameter were defined as eyes with central fixation[16].
Isolated-check Visual Evoked Potential To evaluate the magnocellular pathway, which was thought to be affected early by high IOP[14-15], an electrophysiological technique was performed using the Neucodia visual electrophysiological diagnostic system (MKWH AMD, Huzhou Medconova Medical Technology, Inc.). The test was conducted under the contrast form, and it could detect whether a progressive deficit exits between two examinations. All patients had a BCVA of 0.6 or better. At the beginning of the test, electrodes were connected to the scalp of the patients by using an electrolytic paste. During the test, a low-contrast bright pattern was luminance-modulated against a static background at 10 Hz in order to drive preferentially the magnocellular pathway.A 15% positive-contrast (bright) condition pattern was used during the test. The patients sat at a distance of 70 cm from the screen, and maintained their position at the same level when viewing the pattern. Artefact rejection features ensured that eight valid runs were obtained per eye. Each patient was tested twice to ensure the accuracy of the test, and the second trial was recorded[12]. The contrast form can automatically provide a calculated value showing whether a progressive deficit in the magnocellular pathway existed between the two tests. This was manifested as the individual observed F (IOF) value. If IOF was <0.63, there was no progression; if IOF was ≥0.84, the deficit in the magnocellular pathway progressed; if IOF was≥0.63 and <0.84, the deficit in the magnocellular pathway was suspected to have progressed.
Statistical Analysis Statistical analysis was performed using IBM SPSS Statistics 23.0 (IBM Corp., Armonk, NY, USA).Independent-sample t-tests were used to compare the difference between the two groups in mGC-IPL thickness and the microperimetry values at each time point. Paired t-tests were used to compare the difference between postoperative value and preoperative value in each group. Pearson’s correlation analysis and Spearman correlation analysis were carried out to analyse the correlation between IT and the changes in retinal structure as well as the changes in visual function. P values less than 0.05 were considered statistically significant.
RESULTS
Preoperative and Postoperative Macular Structural Changes Collectively, and for each group, the mGC-IPL thickness first increased 1wk postoperatively and then recovered after 1mo. However, the difference was not significant (Table 2). The 1-week postoperative mGC-IPL thickness in Group A was not significantly different from that in Group B (P=0.913). Moreover, the 1-month postoperative mGC-IPL thickness in Group A was not significantly different from that in Group B (P=0.954; Table 2).
Correlation Between Infusion Time and Macular Structural Changes Collectively, and in Group B, the change in mGC-IPL thickness showed no correlation with IT at both postoperative time points. In Group A, the 1-week postoperative change in mGC-IPL thickness was positively correlated with IT (ΔThickness=-26.89+0.19IT, R2=0.156,P=0.0198; Figure 1).
Preoperative and Postoperative Macular Visual Sensitivity Changes The BCVA (logMAR unit) increased significantly 1wk and 1mo postoperatively (Table 2). No statistical difference in 1-week (P=0.582) and 1-month (P=0.329)postoperative visual acuity was observed between Groups A and B.
Isolated-check Visual Evoked Potential Test Results The IOF value is automatically calculated by the equipment, and shows whether a progressive deficit exists in the magnocellular pathway.For all patients, the 1-week postoperative vs preoperative IOF was 0.50±0.54, and the 1-month postoperative vs preoperative IOF was 0.61±0.80. In Group A, the 1-week postoperative vs preoperative IOF was 0.60±0.70, and the 1-month postoperative vs preoperative IOF was 0.63±0.70. In Group B, the 1-week postoperative vs preoperative IOF was 0.41±0.36, and the 1-month postoperative vs preoperative IOF was 0.59±0.88. Figures 2-5 showed the scatterplot of each group’s IOF value and infusion time at each postoperative time point.In Group A, 11 out of 27 eyes showed progressive deficit in the magnocellular pathway 1-week postoperatively. In Group B,the ratio was 9 out of 34 eyes. At 1-month postoperative time point, the ratio in Group A was 8 out of 27 eyes, and the ratio in Group B was 4 out of 34 eyes.
Fundus-related microperimetry test results Using an automated fundus-related perimeter (MP-1), we detected 20° macular sensitivity. For all patients and for each group,macular sensitivity at each postoperative time point was significantly higher than the corresponding preoperative value(Table 2). Retinal sensitivity measured at both postoperative time points was not significantly different between Groups A and B (1-week postoperative P=0.575; 1-month postoperative P=0.949; Table 2). We also found a correlation between macular sensitivity change and IT in Group B (1-week postoperative ΔSensitivity=661-5.69IT, R2=0.372, P<0.001;1-month postoperative ΔSensitivity=469-3.81IT, R2=0.209,P=0.0066; Figures 6 and 7). We found no correlation between mGC-IPL thickness change and macular sensitivity change at both postoperative time points collectively or individually in each group.
DISCUSSION
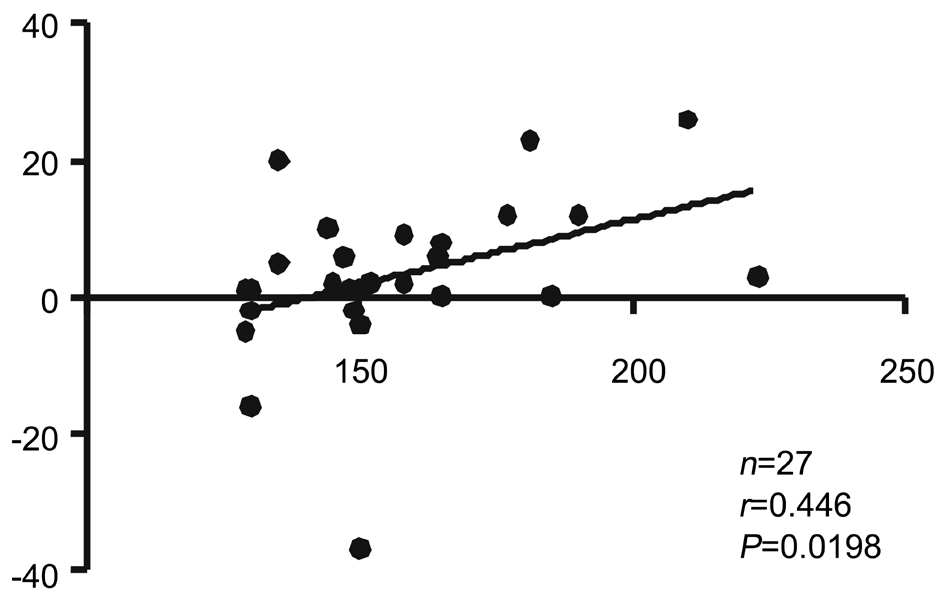
Figure 1 Correlation between infusion time and 1-week postoperative mGC-IPL thickness change in Group A.
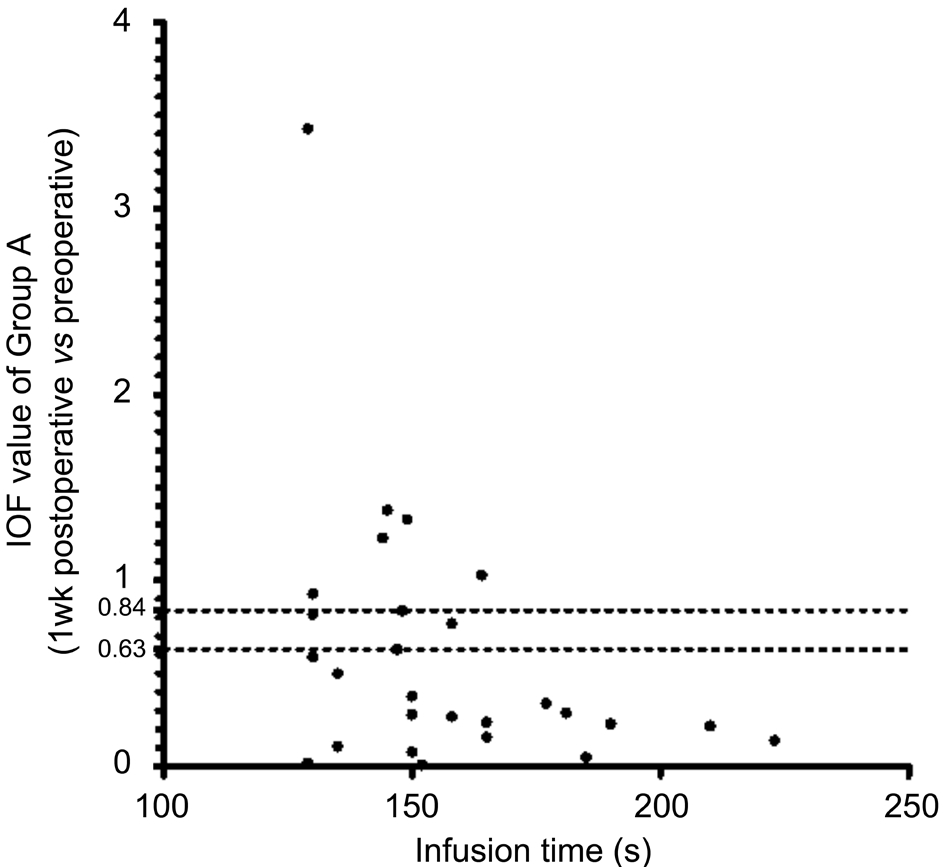
Figure 2 Infusion time and IOF value (1wk postop. vs preop.)of Group A IOF: Individual observed F value; IOF <0.63: No progressive deficit in the magnocellular pathway; IOF ≥0.84: The deficit in the magnocellular pathway progressed; IOF ≥0.63 and <0.84: Suspected progressive deficit in the magnocellular pathway.
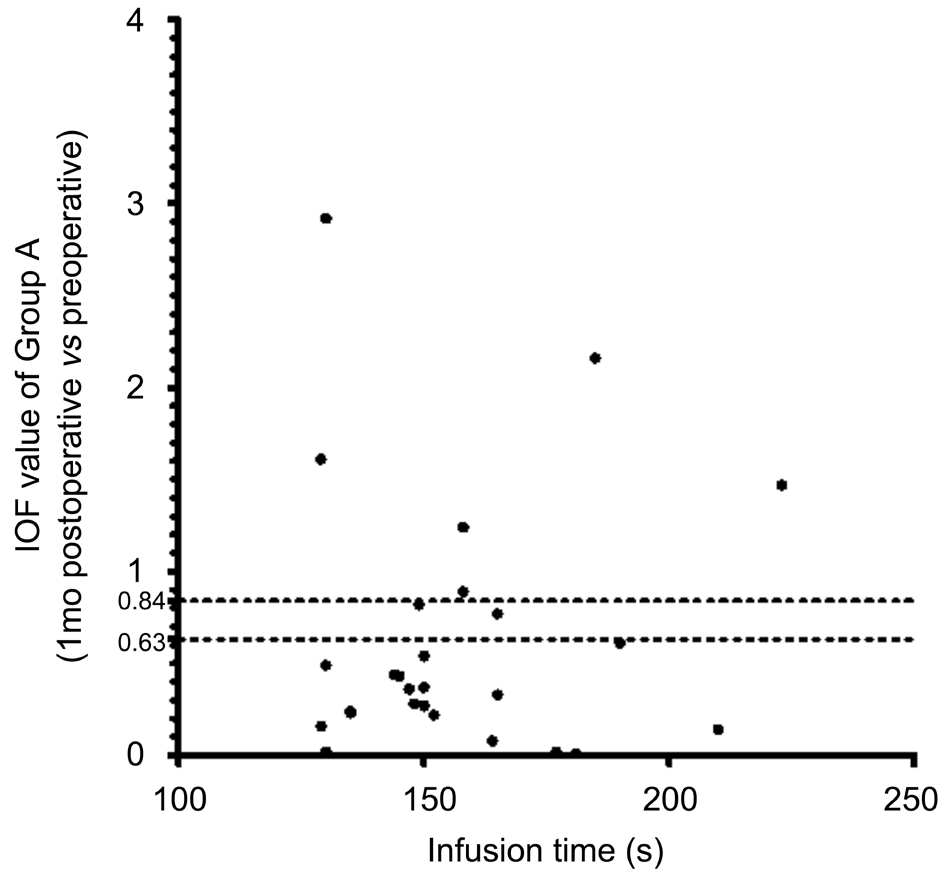
Figure 3 Infusion time and IOF value (1mo postop. vs preop.) of Group A.
Ophthalmologists often use high vacuum and infusion pressure to perform cataract surgery efficiently. However, the high infusion pressure could cause an increase in IOP[17]. Under such high IOP, anterior segment ischemia would appear and lead to prostaglandin release, which finally results in subclinical cystoid macular edema (CME)[18-20]. CME is the leading cause of an unfavorable visual outcome after uncomplicated cataract surgery[21]. The incidence of angiography-positive CME ranges from 9% to 19%, and the condition remains subclinical in most cases[22-24]. The transient effects of high IOP on retinal structure have been documented in many articles, and includes an increase in central macular thickness, macular volume, and mGC-IPL thickness after cataract surgery, but postoperative studies on retinal function have only been conducted using BCVA assessments. Visual acuity was not a sensitive enough parameter to detect the subclinical changes in visual function.Thus, more sensitive visual function assessments, such as microperimetry, were used in our study.
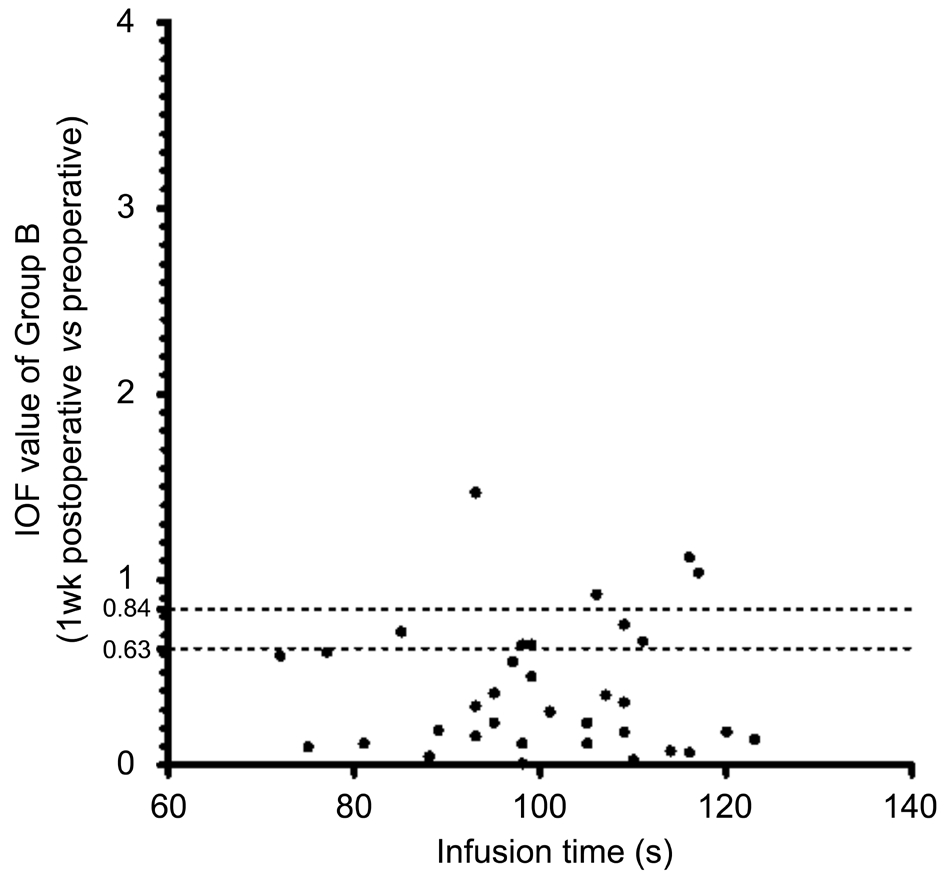
Figure 4 Infusion time and IOF value (1wk postop. vs preop.) of Group B IOF: Individual observed F value.

Figure 5 Infusion time and IOF value (1mo postop. vs preop.) of Group B IOF: Individual observed F value.
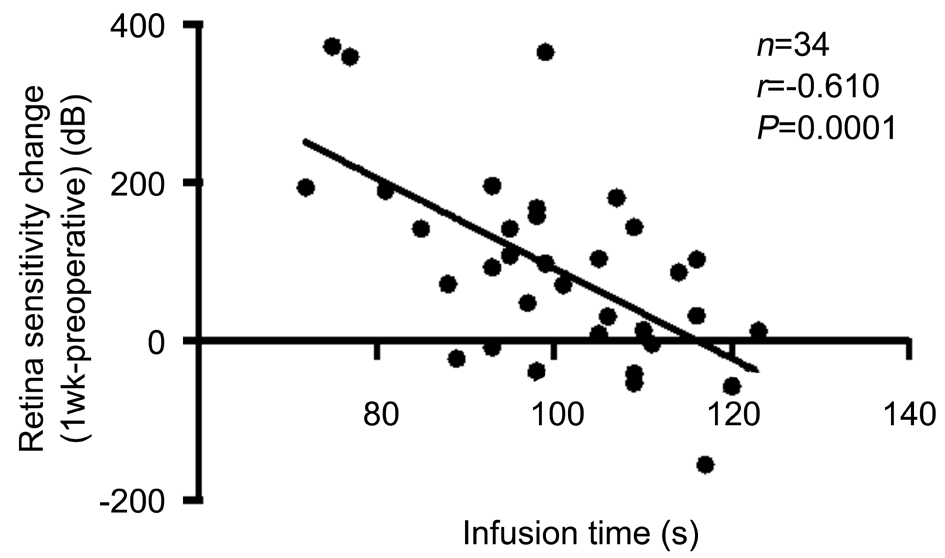
Figure 6 Correlation between infusion time and retinal sensitivity increase (1wk postop. vs preop.) measured using microperimetry in Group B.
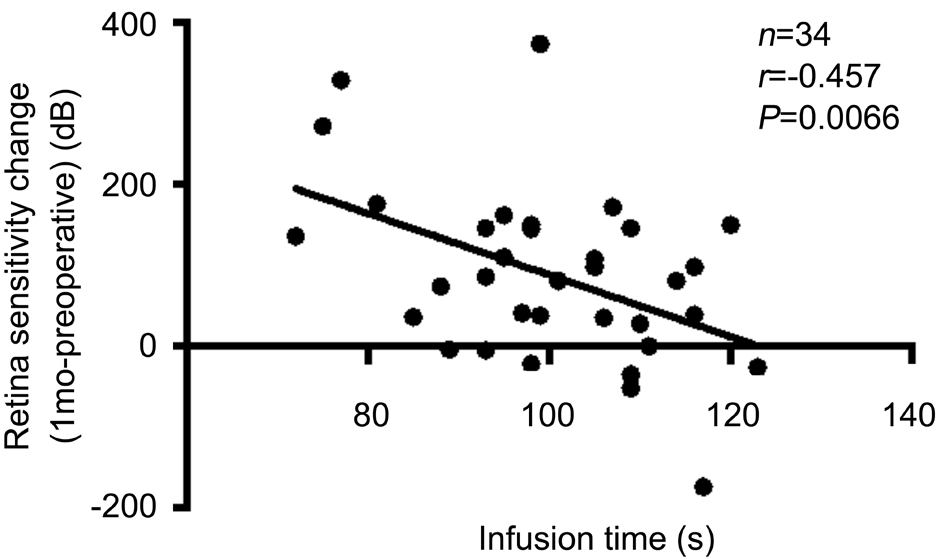
Figure 7 Correlation between infusion time and retinal sensitivity increase (1mo postop. vs preop.) measured using microperimetry in Group B.
Previous studies have shown that the ganglion cells of the magnocellular pathway were the most early affected by a high IOP. Recently, icVEP was utilized in patients with glaucoma to detect early changes in the magnocellular pathway. We incorporated icVEP into our study to determine the effect of infusion pressure on the magnocellular pathway. Moreover, we measured IT to determine whether a longer duration of high IOP would lead to a more significant change in retinal structure and function.
Using OCT images, we found that at both time points after cataract surgery, 1wk and 1mo, mGC-IPL thickness had slightly increased. We also observed a tendency that mGCIPL thickness would recover to the preoperative level at the 1-month postoperative time point, albeit being thicker than the preoperative level. This finding was consistent with that of a pervious study by Sari et al[19]. However, in the present study, we did not observe significant changes in mGC-IPL thickness at either postoperative time points in Group A or B. Furthermore, when comparing the postoperative thickness between Group A (IT>ITmean) and Group B (IT<ITmean), we found no statistical difference at either postoperative time points.
Previous studies have shown a significant increase in macular thickness 1mo after cataract surgery[22,25]. Chen et al[2]also showed that the group with longer IT under high infusion pressure had higher macular thickness 1wk after surgery.The negative result in our study may be due to the following reasons. First, different studies calculated the thicknesses of different layers. In our study, we focused on mGC-IPL thickness, which is lesser than the total macular thickness;hence, CME may not be significant in such a thin layer.Second, different studies use different surgery equipment. In our study, we used the Alcon Centurion Vision System, which could stably control the infusion pressure at a certain level,thereby helping reduce the fluctuation of the infusion pressure effect on the retina and producing less negative effects on retinal structure. Moreover, the infusion pressure during the surgery in our study was set at 55 mm Hg, which was lower than the pressure of the central retinal artery (60 mm Hg), thereby reducing the injury induced by the infusion pressure. Third,the difference in size and ethnicity of the included population should be considered. Finally, we must take into consideration the presence of cataract that could lead to an underestimation of mGC-IPL thickness[26]. In our study, we included patients with a relatively clear lens and manually excluded all images with segmentation errors to reduce preoperative and postoperative OCT signal strength differences. Therefore, in our study, the non-statistical difference in OCT findings before and after surgery may be due to a reduced interference of signal strength change.
On investigating the correlation between IT and macular structural changes, we found a positive relationship between IT and the 1-week postoperative mGC-IPL thickness change in Group A (ΔThickness=-26.89+0.19IT, R2=0.156, P=0.0198).However, in Group B, the change in 1-week postoperative mGC-IPL thickness showed no correlation with IT. This finding also corresponded with that of the study by Chen et al[2], which showed that the effect of infusion pressure on the retina may be cumulative, and therefore, a longer IT would cause a more significant change in retinal thickness.
For illustrating the visual function changes after cataract surgery, we used three parameters: BCVA (logMAR unit),icVEP, and microperimetry. In terms of visual acuity (logMAR unit), significant changes were observed at both postoperative time points than before surgery. This was mainly due to the removal of the lens and an increase in the opacity of the lens. No statistical difference was observed in the 1-week or 1-month postoperative visual acuity between Groups A and B.The icVEP was a novel electrophysiological instrument used in our study. It is designed to tap cortical activity initiated primarily by the afferents in the magnocellular pathway of ganglion cells. Using the equipment’s contrast program,we could obtain an automatically calculated value showing whether a progressive deficit in the magnocellular pathway existed between two tests. In our study, for each individual group and for all the patients combined, the IOF at 1wk after surgery was lower than 0.63, suggesting the absence of progressive deficits in the magnocellular pathway at the 1-week postoperative time point. However, the IOF at 1mo after surgery in Group A was 0.63±0.70, suggesting a suspected progressive deficit. In contrast, the 1-month postoperative IOF in Group B was 0.59±0.88, suggesting no progressive deficits.As the mean value of the 1-month postoperative IOF of Group A was 0.63±0.70, which was at the threshold. Whether there existed a difference still needs to be discussed. Figures 2-5 show each individual’s IOF value. We could see that in Group A at the 1-week postoperative time point, the ratio of IOF≥0.63 was 11/27, which was greater than the ratio of 9/34 in Group B. At the 1-month postoperative time point, we also found a greater ratio in Group A. We speculate that under the high infusion pressure during cataract surgery, the function of the magnocellular pathway may be affected, and that the eyes with a longer IT would be more easily affected. As the icVEP test can be affected by many factors like patient condition for fixating on one object on the screen, opacity of the lens, and visual acuity, we could not overlook the bias that these factors introduced into our results. More studies are needed to confirm our findings.
To our knowledge, few studies have investigated the visual function change after cataract surgery by using an electrophysiology test. Interestingly, an animal study conducted by Minami et al[27]reported similar results to our findings.In that study, the authors performed phacoemulsification and aspiration on rabbits, followed by pars plana vitrectomy on some of these rabbits after they underwent a high or low IOP infusion. They reported significant changes in the visual evoked potentials (VEPs) and a significantly fewer number of cells in the ganglion cell layer in the high-pressure group. They also performed electroretinography but found no changes. The absence of electroretinographic changes and the presence of VEP changes suggest that these changes were due to retinal ganglion cells.
In the microperimetry test, we also found some significant changes. For all the patients and for each group individually,the changes in macular sensitivity at both postoperative time points were significantly increased. This may be attributed to the familiarity of the patients with how the test is conducted.After each examination, the patients would become more familiar with the test, and this could improve the results.Further, although we excluded patients with severe cataract,some influence of lens opacity could still introduce some bias into the microperimetry test. On assessing the correlation between IT and macular sensitivity increase, we also found that with a longer IT, the increase in sensitivity would be less prominent. Nevertheless, we only found this correlation in Group B. Further studies are needed to confirm our findings.On assessing the correlation between retinal structural changes and visual function changes, we found no correlation between mGC-IPL thickness change and retinal sensitivity change at both postoperative time points either collectively or individually in each group.
Our study focused on the structural and functional changes of the mGC-IPL, which was thought to be the first affected by high IOP. However, other retinal layers may also be affected during cataract surgery and might subsequently influence visual sensitivity. Furthermore, the equipment used in our study, such as the high-definition OCT, icVEP, and MP-1,were all focused on the central part of the macula. While this benefited our study, in that we could detect the changes in ganglion cells in the densest part of the retina, it overlooks the remaining parts of the retina. As all types of cells and all parts of these cells influence visual function, the exact effect of high infusion pressure on visual function needs to be further studied.The surgery equipment used in our study could maintain the IOP at 55 mm Hg; thus, the only variation during each surgery was in IT. In further studies, we could try different infusion pressures on animal eyes to learn more about the effect of high infusion pressure on changes in retinal morphology and function. Our study findings would guide surgery equipment parameter setting and, hopefully, help reduce the incidence of CME after cataract surgery in the future.
ACKNOWLEDGEMENTS
Foundation: Supported by the Beijing Municipal Commission of Science and Technology (No.Z151100004015073).
Conflicts of Interest: Ding T, None; Shi DN, None; Fan X,None; Zheng MY, None; Wang W, None; Qiu WQ, None.
REFERENCES
1 Khng C, Packer M, Fine IH, Hoffman RS, Moreira FB. Intraocular pressure during phacoemulsification. J Cataract Refract Surg 2006;32(2):301-308.
2 Chen D, Zhu J, Li J, Ding XX, Lu F, Zhao YE. Effect of simulated dynamic intraocular pressure on retinal thickness measured by optical coherence tomography after cataract surgery. Int J Ophthalmol 2012;5(6):687-693.
3 Zhao Y, Li X, Tao A, Wang J, Lu F. Intraocular pressure and calculated diastolic ocular perfusion pressure during three simulated steps of phacoemulsification in vivo. Invest Ophthalmol Vis Sci 2009;50(6):2927-2931.
4 Findl O, Strenn K, Wolzt M, Menapace R, Vass C, Eichler HG,Schmetterer L. Effects of changes in intraocular pressure on human ocular haemodynamics. Curr Eye Res 1997;16(10):1024-1029.
5 Celik E, Cakır B, Turkoglu EB, Doğan E, Alagoz G. Effect of cataract surgery on subfovealchoroidal and ganglion cell complex thicknesses measured by enhanced depth imaging optical coherence tomography. Clin Ophthalmol 2016;10:2171-2177.
6 Pardianto G, Moeloek N, Reveny J, Wage S, Satari I, Sembiring R,Srisamran N. Retinal thickness changes after phacoemulsification. Clin Ophthalmol 2013;7:2207-2214.
7 Gonzalez-Lopez JJ, Rebolleda G, Leal M, Oblanca N, Muñoz-Negrete FJ, Costa-Frossard L, Alvarez-Cermeño JC. Comparative diagnostic accuracy of ganglion cell-inner plexiform and retinal nerve fiber layer thickness measures by Cirrus and Spectralis optical coherence tomography in relapsing-remitting multiple sclerosis. Biomed Res Int 2014;2014:128517.
8 Mwanza JC, Oakley JD, Budenz DL, Chang RT, Knight OJ, Feuer WJ. Macular ganglion cell-inner plexiform layer: automated detection and thickness reproducibility with spectral domain-optical coherence tomography in glaucoma. Invest Ophthalmol Vis Sci 2011;52(11):8323-8329.
9 Rohrschneider K, Bültmann S, Glück R, Kruse FE, Fendrich T, Völcker HE. Scanning laser ophthalmoscope fundus perimetry before and after laser photocoagulation for clinically significant diabetic macular edema.Am J Ophthalmol 2000;129(1):27-32.
10 Okada K, Yamamoto S, Mizunoya S, Hoshino A, Arai M, Takatsuna Y. Correlation of retinal sensitivity measured with fundus-related microperimetry to visual acuity and retinal thickness in eyes with diabetic macular edema. Eye (Lond) 2006;20(7):805-809.
11 Soto I, Pease ME, Son JL, Shi X, Quigley HA, Marsh-Armstrong N.Retinal ganglion cell loss in a rat ocular hypertension model is sectorial and involves early optic nerve axon loss. Invest Ophthalmol Vis Sci 2011;52(1):434-441.
12 Zemon V, Tsai JC, Forbes M, Al-Aswad LA, Chen CM, Gordon J, Greenstein VC, Hu G, Strugstad EC, Dhrami-Gavazi E, Jindra LF.Novel electrophysiological instrument for rapid and objective assessment of magnocellular deficits associated with glaucoma. Doc Ophthalmol 2008;117(3):233-243.
13 Greenstein VC, Seliger S, Zemon V, Ritch R. Visual evoked potential assessment of the effects of glaucoma on visual subsystems. Vision Res 1998;38(12):1901-1911.
14 Quigley HA, Dunkelberger GR, Green WR. Chronic human glaucoma causing selectively greater loss of large optic nerve fibers. Ophthalmology 1988;95(3):357-363.
15 Kerrigan-Baumrind LA, Quigley HA, Pease ME, Kerrigan DF,Mitchell RS. Number of ganglion cells in glaucoma eyes compared with threshold visual field tests in the same persons. Invest Ophthalmol Vis Sci 2000;41(3):741-748.
16 Midena E, Radin PP, Pilotto E, Ghirlando A, Convento E, Varano M.Fixation pattern and macular sensitivity in eyes with subfoveal choroidal neovascularization secondary to age-related macular degeneration. A microperimetry study. Semin Ophthalmol 2004;19(1-2):55-61.
17 Ching HY, Wong AC, Wong CC, Woo DC, Chan CW. Cystoid macular oedema and changes in retinal thickness after phacoemulsification with optical coherence tomography. Eye (Lond) 2006;20(3):297-303.
18 Perente I, Utine CA, Ozturker C, Cakir M, Kaya V, Eren H, Kapran Z, Yilmaz OF. Evaluation of macular changes after uncomplicated phacoemulsification surgery by optical coherence tomography. Curr Eye Res 2007;32(3):241-247.
19 Sari ES, Ermis SS, Yazici A, Koytak A, Sahin G, Kilic A. The effect of intracameral anesthesia on macular thickness and ganglion cell-inner plexiform layer thickness after uneventful phacoemulsification surgery:prospective and randomized controlled trial. Graefes Arch Clin Exp Ophthalmol 2014;252(3):433-439.
20 Walkden A, Cakir M, Kaya V, Eren H, Kapran Z, Yilmaz OF.Pseudophakic cystoid macular edema and spectral-domain optical coherence tomography-detectable central macular thickness changes with perioperative prostaglandin analogs. J Cataract Refract Surg 2017;43(8):1027-1030.
21 The Miami Study Group. Cystoid macular edema in aphakic and pseudophakic eyes. Am J Ophthalmol 1979;88(1):45-48.
22 Mentes J, Erakgun T, Afrashi F, Kerci G. Incidence of cystoid macular edema after uncomplicated phacoemulsification. Ophthalmologica 2003;217(6):408-412.
23 Ursell PG, Spalton DJ, Whitcup SM, Nussenblatt RB. Cystoid macular edema after phacoemulsification: relationship to blood-aqueous barrier damage and visual acuity. J Cataract Refract Surg 1999;25(11):1492-1497.
24 Kusbeci T, Eryigit L, Yavas G, Inan UU, Evaluation of cystoid macular edema using optical coherence tomography and fundus fluorescein angiography after uncomplicated phacoemulsification surgery. Curr Eye Res 2012;37(4):327-333.
25 Roh HC, Park CY, Kim M. Changes of the macular ganglion cell-inner plexiform layer thickness after cataract surgery in glaucoma patients. J Ophthalmol 2016;2016:9785939.
26 Nakatani Y, Higashide T, Ohkubo S, Takeda H, Sugiyama K. Effect of cataract and its removal on ganglion cell complex thickness and peripapillary retinal nerve fiber layer thickness measurements by fourierdomain optical coherence tomography. J Glaucoma 2013;22(6):447-455.
27 Minami M, Oku H, Okuno T, Fukuhara M, Ikeda T. High infusion pressure in conjunction with vitreous surgery alters the morphology and function of the retina of rabbits. Acta Ophthalmol Scand 2007;85(6):633-639.