Correlation between choroidal thickness and intraocular pressure after 23-gauge vitrectomy for idiopathic epiretinal membrane
Masahiro Ishida, Takashi Wakakuri, Yutaka Imamura
Department of Ophthalmology, Teikyo University School of Medicine, University Hospital Mizonokuchi, 5-1-1 Futago,Takatsu-ku, Kawasaki, Kanagawa 213-8507, Japan
Abstract
● AlM:To determine the relationship between the subfoveal choroidal thickness (CT) and intraocular pressure (lOP)following idiopathic epiretinal membrane (ERM) surgery.
● METHODS:Retrospective observational case series of patients who had undergone 23-gauge vitrectomy for an ERM.The measurements of CT and lOP were done at the baseline and 1d, 1wk, 1, 3, 6, and 12mo after the surgery.
● RESULTS:Forty-four eyes of 43 patients with a mean age of 69.8±9.5y were studied.The CT was 200.8±86.3 µm at the baseline, 210.1±83.5 µm at 1d, 213.2±85.4 µm at 1wk,203.1±84.0 µm at 1mo, 197.5±85.5 µm at 3mo, 197.7±84.0 µm at 6mo, and 191.2±86.8 µm at 12mo after surgery.The CT on day 1 and week 1 after the surgery was signifcantly thicker than that at the baseline CT (P=0.0023 andP<0.0001).The CT at 12mo after surgery was significantly thinner than the baseline (P=0.0062).The lOP on day 1 and week 1 were significantly lower than the baseline (P<0.0001 andP=0.0042).The lOP at 1, 3, 6, and 12mo after surgery were significantly higher than the baseline lOP(P=0.0087,P=0.0023,P<0.00051, andP<0.0001).The rates of changes in the CT between baseline and day 1 and week 1 were significantly and negatively correlated with the rates of change in the lOP (P<0.0001 andP=0.046).ln the group with the lOP change rate of -30% or less at 1d postoperatively, the change rate of CT was -21.1% to 31.2% (9.8%±12.4%) and in the group of -29% or more,it was -8.9% to 28.0% (2.6%±8.9%).The change rate of CT in the group with the lOP change rate of -30% or less was significantly higher than the group of -29% or more(P=0.016).
● CONCLUSlON:CT increases soon after the ERM surgery which is probably due to the transient hypotony, showing that lOP may be a signifcant confounding factor for CT.
● KEYWORDS:choroidal thickness; vitrectomy; intraocular pressure; epiretinal membrane
INTRODUCTION
The choroidal thickness (CT) is altered in eyes with various types of chorioretinal diseases such as central serous chorioretinopathy[1], Vogt-Koyanagi-Harada disease[2-3],and high myopia[4].The CT is also significantly affected by age, refractive error[5-6], and by vasodilating medications such as sildenafil[7].Because the CT is altered by different kinds of chorioretinal diseases, it is important to determine what parameters associated with the chorioretinal diseases is associated with the altered CT.
Whether the intraocular pressure (IOP) can alter the CT is controversial.For example, it has been reported that the choroid is thicker after the IOP is reduced by trabeculectomy[8-10].However, there is also a study reporting that the IOP was not signifcantly correlated with the CT in healthy eyes[11].This is important because it is known that intraocular surgery can alter the IOP,e.g.the IOP is elevated after conventional vitrectomy but is reduced after non-sutured microvitrectomy.
As the frst step toward understanding the relationship between the IOP and the CT, we measured the subfoveal CT and IOP before and after 23-gauge (23G) vitrectomy.We selected vitrectomy for an epiretinal membrane (ERM) because its duration is short, and it does not lead to severe postoperative infammation.
SUBJECTS AND METHODS
This was a retrospective, interventional, observational case series study.We studied the medical records of 44 eyes of 43 consecutive patients who had undergone vitrectomy by one surgeon for an idiopathic ERM and were followed for at least 1y after the surgery.The surgeries were performed at the Teikyo University School of Medicine, University Hospital Mizonokuchi from August 2010 to April 2014.The procedures used to treat the patients and the examination of their medical records were approved by the Institutional Review Board of the Teikyo University School of Medicine.Informed consent was obtained from all individual participants.Eyes with any ocular condition that could affect the visual function,such as diabetic retinopathy, macular degeneration, myopic chorioretinal atrophy, cataract >grade III in the Emery-Little scale[12], corneal diseases, secondary ERM after retinal detachment surgery, and glaucoma were excluded.
Standard 3-port vitrectomy with 23G instruments was performed on the 44 eyes to remove the ERM.Phacoemulsification and intraocular lens implantation was performed on 34 of the 35 phakic eyes.Nine eyes were pseudophakic.After completion of core vitrectomy, a posterior vitreous detachment was created if one was not present (5 eyes) by active aspiration.The ERM was removed with or without the internal limiting membrane (ILM) using a V-rance microhooked needle and vitreoretinal forceps.If the ILM was removed, it was peeled by grasping it with vitreoretinal forceps without the use of dyes.At the completion of the surgery, the scleral ports were sutured in 19 eyes (1 port, 1 eye; 2 ports, 1 eye; 3 ports, 17 eyes).The ILM was not peeled in 3 of 11 eyes with an ERM and a pseudomacular hole.One eye developed an intraoperative rhegmatogenous retinal detachment, in which intraoperative fuid-air exchange was performed.About 40% of the vitreous cavity was flled with air due to the upper retinal tear.
Spectral domain optical coherence tomography (SD-OCT;Spectralis, Heidelberg Engineering, Germany) was used to determine the CT pre- and postoperatively (Figure 1).The IOP was measured by Goldmann applanation tonometry or pneumatic tonometry.The CT and IOP were measured before and 1d, 1wk, 1, 3, 6, and 12mo postoperatively.The thickness of the choroid was measured by enhanced depth imaging SD-OCT, and measurement was performed in the daytime(between 7:00 a.m.to 17:00 p.m.).
Statistical AnalysisStatistical analyses were performed with the Excel (Microsoft) software with add-in statistical software (SSRI, Tokyo).The descriptive data are presented as the means±standard deviations (SD).The best-corrected visual acuity (BCVA) was measured with a Landolt C chart in decimal units, and converted to the logarithm of the minimal angle of resolution (logMAR) units.Pairedt-tests were used to determine whether differences over time were significant.The correlations between the CT and IOP were determined by Spearman rank correlations.APof <0.05 was considered signifcant.

Figure 1 Representative case showing a thickening of the choroid in a 70-year-old woman The subfoveal CT was 145 µm and the IOP was 14 mm Hg at the baseline (A), 168 µm and 4 mm Hg at 1d (B),189 µm and 9 mm Hg at 1wk (C), 150 µm and 13 mm Hg at 1mo (D),and 145 µm and 17 mm Hg at 1y (E) after the surgery.
RESULTS
The medical records of 44 eyes of 43 patients (26 eyes of 25 women and 18 eyes of 18 men) that had undergone vitrectomy to remove an ERM were studied.Their mean age was 69.8±9.5y with a range of 44 to 92y.The mean axial length was 23.79±1.35 mm with a range 22.09 mm to 27.36 mm.The mean postoperative follow-up period was 24.8±8.5mo with a range 12 to 38mo.
The mean CT was 200.8±86.3 µm at the baseline, 210.1±83.5 µm at 1d, 213.2±85.4 µm at 1wk, 203.1±84.0 µm at 1mo, 197.5±85.5 µm at 3mo, 197.7±84.0 µm at 6mo, and 191.2±86.8 µm at 12mo after the surgery (Figure 2).The CT on day 1 and week 1 after the surgery were signifcantly thicker than that at the baseline CT (P=0.0023 andP<0.0001).The CT at 12mo after surgery was signifcantly thinner than that at the baseline (P=0.0062).The IOP was 12.1±2.2 mm Hg at the baseline, 8.8±3.4 mm Hg at day 1, 10.6±2.9 mm Hg at 1wk (n=42), 13.2±3.2 mm Hg at 1mo (n=43), 13.5±2.9 mm Hg at 3mo, 13.8±2.9 mm Hg at 6mo, and 14.1±2.7 mm Hg at 12mo after the surgery (Figure 3).The IOP on day 1 and week 1 were signifcantly lower than the baseline IOP (P<0.0001 andP=0.0042).The IOPs at 1, 3, 6,and 12mo after the surgery were signifcantly higher than that at the baseline IOP (P=0.0087,P=0.0023,P<0.00051, andP<0.0001, respectively).
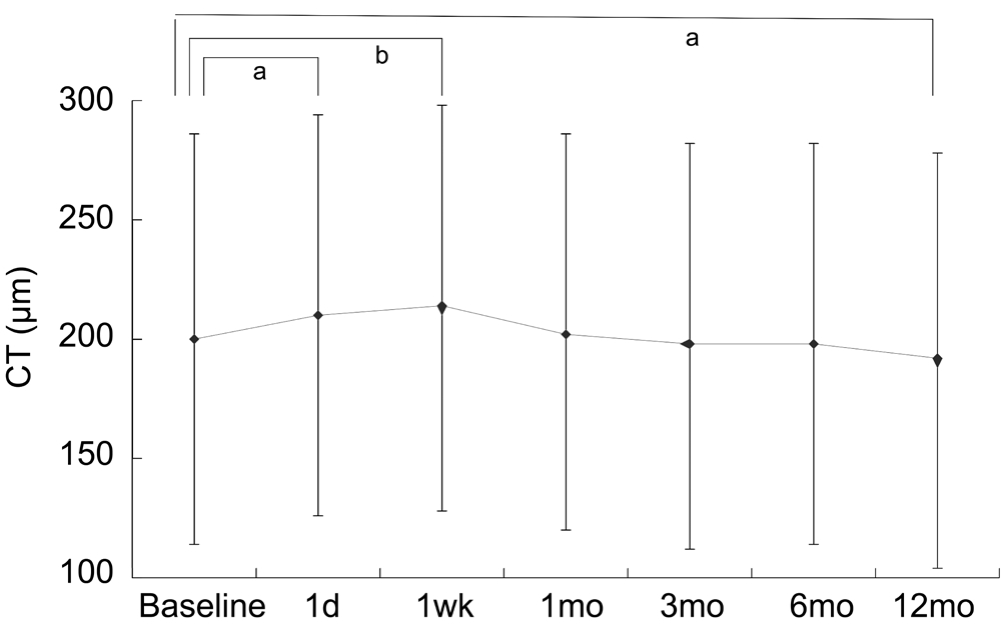
Figure 2 Changes in subfoveal CT The subfoveal CT was 200.8±86.3 µm at the baseline, 210.1±83.5 µm at 1d, 213.2±85.4 µm at 1wk, 203.1±84.0 µm at 1mo, 197.5±85.5 µm at 3mo, 197.7±84.0 µm at 6mo, and 191.2±86.8 µm at 12mo after the surgery.
aP<0.01,bP<0.00001, pairedt-test.
The rates of changes in the CT between baseline and day 1 and week 1 were signifcantly and negatively correlated with the rates of change in the IOP (r=-0.506,P<0.00092; andr=-0.311,P=0.046, respectively; Figure 4A and 4B).The CT was not significantly correlated with the IOP at the baseline and at 1y (r=0.131,P=0.389; Figure 4C).
In the group with the IOP change rate of -30% or less at 1d postoperatively, the change rate of CT was -21.1% to 31.2% (9.8%±12.4%) and in the group of -29% or more, it was -8.9% to 28.0% (2.6%±8.9%).The change rate of CT in the group with the IOP change rate of -30% or less was signifcantly higher than the group of -29% or more (P=0.016,Mann-WhitneyUtest), indicating that the larger IOP change contributed to larger CT changes.
The baseline CT was signifcantly correlated with the age (r=-0.431,P=0.0047), but not with the baseline IOP (r=-0.166,P=0.274), axial length (r=-0.178,P=0.244), preoperative BCVA (r=0.185,P=0.225), and postoperative BCVA (r= -0.256,P=0.094).
The mean BCVA postoperatively was 0.060±0.223 logMAR units, which was significantly better than the preoperative BCVA of 0.296±0.198 logMAR units (P<0.0001).
DISCUSSION

Figure 3 Changes in IOP after vitrectomy The IOP was 12.1±2.2 mm Hg at the baseline, 8.8±3.4 at 1d, 10.6±2.9 at 1wk (n=42), 13.2±3.2 at 1mo (n=43), 13.5±2.9 at 3mo, 13.8±2.9 at 6mo, and 14.1±2.7 at 12mo after the surgery.
aP<0.000001,bP<0.00001,cP<0.0001,dP<0.01,pairedt-test.
Our results showed that the CT was signifcantly thicker than that at the baseline on day 1 and week 1 after the 23G ERM surgery, and the CT at 1y was signifcantly thinner than that at the baseline.We found that the rate of change of the CT was signifcantly correlated with the rate of change of the IOP on day 1 and week 1 postoperatively, however the correlation was not signifcant at 1y.At 1d postoperatively, the change rate of CT in the group with the IOP change rate of -30% or less was significantly higher than the group of -29% or more.These results indicated that the increase of the CT within the first week was most likely due to the hypotony, and the thinning of the choroid at 1y was caused by a different mechanism.To our knowledge, there are no published articles which examined the relationship between IOP and CT in ERM surgery.Although we are aware of the existence of the paper showing that the reduced IOP after trabeculectomy was significantly correlated with the increase in CT[8-10].According to the course of central serous chorioretinopathy[1]and Vogt-Koyanagi-Harada disease[2-3], the choroid is an organ whose thickness varies widely depending on their pathological conditions.We presume that the pressure to the choroid was decreased due to a rapid decrease in the IOP after surgery, and the CT was increased with time.
Michalewskaet al[13]reported the CT in the eyes with ERM undergoing ERM and ILM peeling, which was measured by swept source OCT.They showed CT at 3mo after surgery was significantly thinner than baseline.We also found a gradual thinning of the choroid with time as reported.An increase in the oxygen level in the vitreous after the vitrectomy[14-15]may meet the retinal demand which would decrease the choroidal supply of oxygen to the retinal tissues.It may be the cause of the thinning of the choroid after several months postoperatively.
We found that the preoperative IOP and CT were not signifcantly correlated as has been reported in healthy eyes[11].However, changes of the CT was signifcantly correlated with the changes of IOP, therefore the changes in the IOP may be a confounding factor for measuring CT.
A recent study indicated CT became thick in eyes with pseudophakic cystoid macular edema and thin after the treatment of cystoid macular edema[16].Since macular edema is often found in eyes after ERM surgery, we may be take care of the possible occurrence of cystoid macular edema in eyes with thick CT after ERM surgery.

Figure 4 Correlation between the subfoveal CT and IOP The subfoveal CT at the baseline and 1d (A;n=44,r=-0.506,P<0.001) and 1wk (B;n=42,r=-0.311,P<0.05) were signifcantly correlated with the IOP.The CT between the baseline and at 12mo (C;n=44,r=0.131,P=0.389) was not signifcantly correlated with the IOP.Spearman’s correlation coeffcient by rank test.
Since Chang[17]reported the risk of open angle glaucoma(OAG) in vitrectomized eyes, several studies have the similar fndings[18-20].Cataract surgery combined with vitrectomy was shown to be a risk factor for IOP elevations in vitectomized eyes[17-18,20].Oxidative stress[14-15]may affect the structure of trabecular meshwork, which may reduced aqueous flow and result in OAG.In the present study, only 1 eye was phakic after vitrectomy, and 9 eyes were pseudophakic preoperatively and 39 eyes underwent simultaneous cataract surgery,suggesting that our patients were likely to have postoperative IOP elevation.
This study has limitations.This study was a retrospectively analyses of the IOP and CT, and the number of the participants was relatively small.The measurement of the CT was done manually by a single examiner, however we meausured CT in the daytime in order to get rid of possible diurnal variations of CT[21].We did not perform multivariate analysis for CT,however we measured differences of IOP and CT of the same patient, therefore other factors than IOP appear unlikely to infuence the changes of CT.
In conclusion, the CT becomes thicker on day 1 and week 1 after 23G-vitrectomy for ERM due to a lower IOP, and then gradually decreases until 1y after vitrectomy.We need to take an IOP change into consideration as a confounding factor when evaluating CT in our researches.
ACKNOWLEDGEMENTS
Foundation:Dr.Imamura Y was funded by Koureisha Ganshikkan Kenkyu Zaidan in Japan.
Conflicts of Interest:Ishida M, None; Wakakuri T, None;Imamura Y, None.
REFERENCES
1 Imamura Y, Fujiwara T, Margolis R, Spaide RF.Enhanced depth imaging optical coherence tomography of the choroid in central serous chorioretinopathy.Retina2009;29(10):1469-1473.
2 Maruko I, Iida T, Sugano Y, Oyamada H, Sekiryu T, Fujiwara T, Spaide RF.Subfoveal choroidal thickness after treatment of Vogt-Koyanagi-Harada disease.Retina2011;31(3):510-517.
3 Fong AH, Li KK, Wong D.Choroidal evaluation using enhanced depth imaging spectral-domain optical coherence tomography in Vogt-Koyanagi-Harada disease.Retina2011;31(3):502-509.
4 Fujiwara T, Imamura Y, Margolis R, Slakter JS, Spaide RF.Enhanced depth imaging optical coherence tomography of the choroid in highly myopic eyes.Am J Ophthalmol2009;148(3):445-450.
5 Ikuno Y, Kawaguchi K, Nouchi T, Yasuno Y.Choroidal thickness in healthy Japanese subjects.Invest Ophthalmol Vis Sci2010;51(4):2173-2176.
6 Hirata M, Tsujikawa A, Matsumoto A, Hangai M, Ooto S, Yamashiro K, Akiba M, Yoshimura N.Macular choroidal thickness and volume in normal subjects measured by swept-source optical coherence tomography.Invest Ophthalmol Vis Sci2011;52(8):4971-4978.
7 Vance SK, Imamura Y, Freund KB.The effects of sildenafl citrate on choroidal thickness as determined by enhanced depth imaging optical coherence tomography.Retina2011;31(2):332-335.
8 Kara N, Baz O, Altan C, Satana B, Kurt T, Demirok A.Changes in choroidal thickness, axial length, and ocular perfusion pressure accompanying successful glaucoma filtration surgery.Eye(Lond)2013;27(8):940-945.
9 Kadziauskiene A, Kuoliene K, Asoklis R, Lesinskas E, Schmetterer L.Changes in choroidal thickness after intraocular pressure reduction following trabeculectomy.Acta Ophthalmol2016;94(6):586-591.
10 Yoshikawa M, Akagi T, Nakanishi H, Ikeda HO, Morooka S, Yamada H, Hasegawa T, Iida Y, Yoshimura N.Longitudinal change in choroidal thickness after trabeculectomy in primary open-angle glaucoma patients.Jpn J Ophthalmol2017;61(1):105-112.
11 Pekel G, Acer S, Yağci R, Özdemir S, Kaya H, Hiraali MC, Çetin EN.Relationship between subfoveal choroidal thickness, ocular pulse amplitude, and intraocular pressure in healthy subjects.J Glaucoma2016;25(7):613-617.
12 Emery JM.Kelman phacoemulsifcation, patient selection.Emery JM,MoIntyre DJ, eds.Extracapsular cataract surgery.St Louis, Missouri:CV Mosby;1983:95-100.
13 Michalewska Z, Michalewski J, Adelman RA, Zawislak E, Nawrocki J.Choroidal thickness measured with swept source optical coherence tomography before and after vitrectomy with internal limiting membrane for idiopathic epiretinal membranes.Retina2015;35(3):487-491.
14 Barbazetto IA, Liang J, Chang S, Zheng L, Spector A, Dillon JP.Oxygen tension in the rabbit lens and vitreous before and after vitrectomy.Exp Eye Res2004;78(5):917-924.
15 Holekamp NM, Shui YB, Beebe DC.Vitrectomy surgery increases oxygen exposure to the lens: a possible mechanism for nuclear cataract formation.Am J Ophthalmol2005;139(2):302-310.
16 Fleissing E, Cohen S, Iglicki M, Goldstein M, Zur D.Changes in choroidal thickness in clinically signifcant pseudophakic cystoid macular edema.Retina2018;38(8):1629-1635.
17 Chang S.LXII Edward Jackson lecture: open angle glaucoma after vitrectomy.Am J Ophthalmol2006;141(6):1033-1043.
18 Wu L, Berrocal MH, Rodriguez FJ,et al.Intraocular pressure elavevation after uncomplicated pars plana vitrectomy: results of the Pan American Collaborative Retina Study Group.Retina2014;34(10):1985-1989.
19 Fujikawa M, Sawada O, Kakinoki M, Sawada T, Kawamura H, Ohji M.Long-term intraocular pressure changes after vitrectomy for epiretinal membrane and macular hole.Graefes Arch Clin Exp Ophthalmol2014;252(3):389-393.
20 Lalezary M, Shah RJ, Reddy RK, Kammer JA, Kuchtey RW, Joos KM, Cherney EF, Recchia FM, Kim SJ.Prospective retinal and optic nerve vitrectomy evaluation (PROVE) study.Twelve-month findings.Ophthalmology2014;121(10):1983-1989.
21 Tan CS, Ouyang Y, Ruiz H, Sadda SR.Diurnal variation of choroidal thickness in normal, healthy subjects measured by spectral domain optical coherence tomography.Invest Ophthalmol Vis Sci2012;53(1):261-266.
Citation:Ishida M, Wakakuri T, Imamura Y.Correlation between choroidal thickness and intraocular pressure after 23-gauge vitrectomy for idiopathic epiretinal membrane.Int J Ophthalmol2018;11(11):1774-1778
DOl:10.18240/ijo.2018.11.07
Accepted:2018-04-13
Received:2017-09-16
Correspondence to:Masahiro Ishida.Department of Ophthalmology, Teikyo University School of Medicine,University Hospital Mizonokuchi, 5-1-1 Futago, Takatsuku, Kawasaki, Kanagawa 213-8507, Japan.ishidam@med.teikyo-u.ac.jp