The thickness and volume of the choroid, outer retinal layers and retinal pigment epithelium layer changes in patients with diabetic retinopathy
Xiang-Ning Wang1, Shu-Ting Li1, Wei Li1, Yan-Jun Hua1, Qiang Wu1,2
1Department of Ophthalmology, Shanghai Jiao Tong University Af filiated Sixth People’s Hospital, Shanghai 200233, China
2Shanghai Key Laboratory of Diabetes Mellitus, Shanghai 200233, China
Abstract● AlM: To evaluate the thickness and volume changes of the choroidal, outer retinal layers (ORL) and retinal pigment epithelium (RPE) in patients with diabetic retinopathy (DR)using optical coherence tomography (OCT) and correlate them with visual acuity.● METHODS: We carried out a retrospective observational case series. Consecutive DR patients were recruited for color fundus photography and OCT assessment. The RPE, ORL and choroidal thickness were measured. The correlation with the best-corrected visual acuity (BCVA)was also investigated.● RESULTS:The study included 128 eyes, comprising 45 eyes of 25 diabetic macular edema (DME) patients, 34 eyes of 20 DR without DME (non-DME) patients, and 49 eyes of 25 age-matched normal individuals. The choroidal thickness in DR patients were decreased statistically significantly compared with the control group (P<0.05).The mean macular ORL thickness in DME (73.02±15.34 μm)and non-DME groups (76.35±7.32 μm) were decreased statistically signi ficantly compared with the control group(80.20±5.85 μm;P=0.006,P=0.013, respectively). ln both the non-DME and DME groups, the RPE thickness were decreased compared with the control group (P<0.05),except in the macular and central ring. The BCVA were signi ficant interactions with the total inner retinal volume and macular RPE thickness in the DME group (r=0.115,P<0.001,r=-0.013,P=0.017, respectively).● CONCLUSlON: The choroid, ORL and RPE thickness are signi ficantly decreased in DR patients compared with controls in different segments.
INTRODUCTION
Diabetic macular edema (DME) is the leading cause of visual impairment in patients with diabetic retinopathy(DR) worldwide[1]. The retina gets nutrients from two discrete circulatory systems, the choroidal blood vessels and the retinal blood vessels. While alterations in retinal vasculature resulting in impairment of the blood-retinal barrier (BRB) have been demonstrated to play a vital role in the pathophysiology of DME, changes in the underlying choroidal vasculature may also play a contributing role[2]. The choroid has been reported to plays an important role in the pathophysiology of DR[3]. Some studies have reported that choroidal thickness is decreased in DME, and the underlying choroidal vasculature changes may also be related to the onset or progression of the disease[4-6].
Karahanet al[7]had reported the correlation between choroidal thickness and the outer retinal layer (ORL) by optical coherence tomography (OCT) scan. The ORL thickness, as de fined in this study as the distance between the external limiting membrane(ELM) and the retinal pigment epithelium (RPE), was the sum of the length of the inner and outer segments of photoreceptors.It is known that the outer segments of photoreceptors contain disks filled with opsin, which is responsible for absorbing photons for later signal transduction[8]. Several studies have reported that the photoreceptor layer status and ORL thickness are closely related to visual acuity (VA) in patients with DME[8-10]. The RPE layer, the structure of BRB, is responsible for the mainly retinal oxygen and nutrition supplies. The breakdown of BRB has been demonstrated to play an important role in the processes of diabetes and ischemia[11].Hence, it is meaningful to study the thickness and volume changes of the choroid, ORLs and the RPE layer in patients with DME.
The purpose of this study was to evaluate the thickness and volume changes of the choroid, RPE and ORL in patients with DME using SD-OCT and correlating with VA.
SUBJECTS AND METHODS
Study SubjectsThis study adhered to the tenets of the Declaration of Helsinki and had the approval of the Ethics Committee of Sixth People’s Hospital Affiliated to Shanghai Jiao Tong University, Shanghai, China.
A retrospective review was performed on all patients with DR who were examined at the Department of Ophthalmology,Sixth People’s Hospital Affiliated to Shanghai Jiao Tong University, between September 2015 and March 2016. Also,25 age-matched controls (49 eyes) with normal VA and no retinal or choroidal pathology were included in this study.
At the initial evaluation, all patients received a complete ophthalmologic examination that included the manifest refraction, axial length, best-corrected visual acuity (BCVA)measurement, slit-lamp biomicroscopy, a detailed fundus examination, colour fundus photography, SD-OCT (Spectralis HRA+OCT; Heidelberg Engineering, Heidelberg, Germany).The patients with DME were diagnosed by stereoscopic biomicroscopy according to the criteria reported by the ETDRS[12].
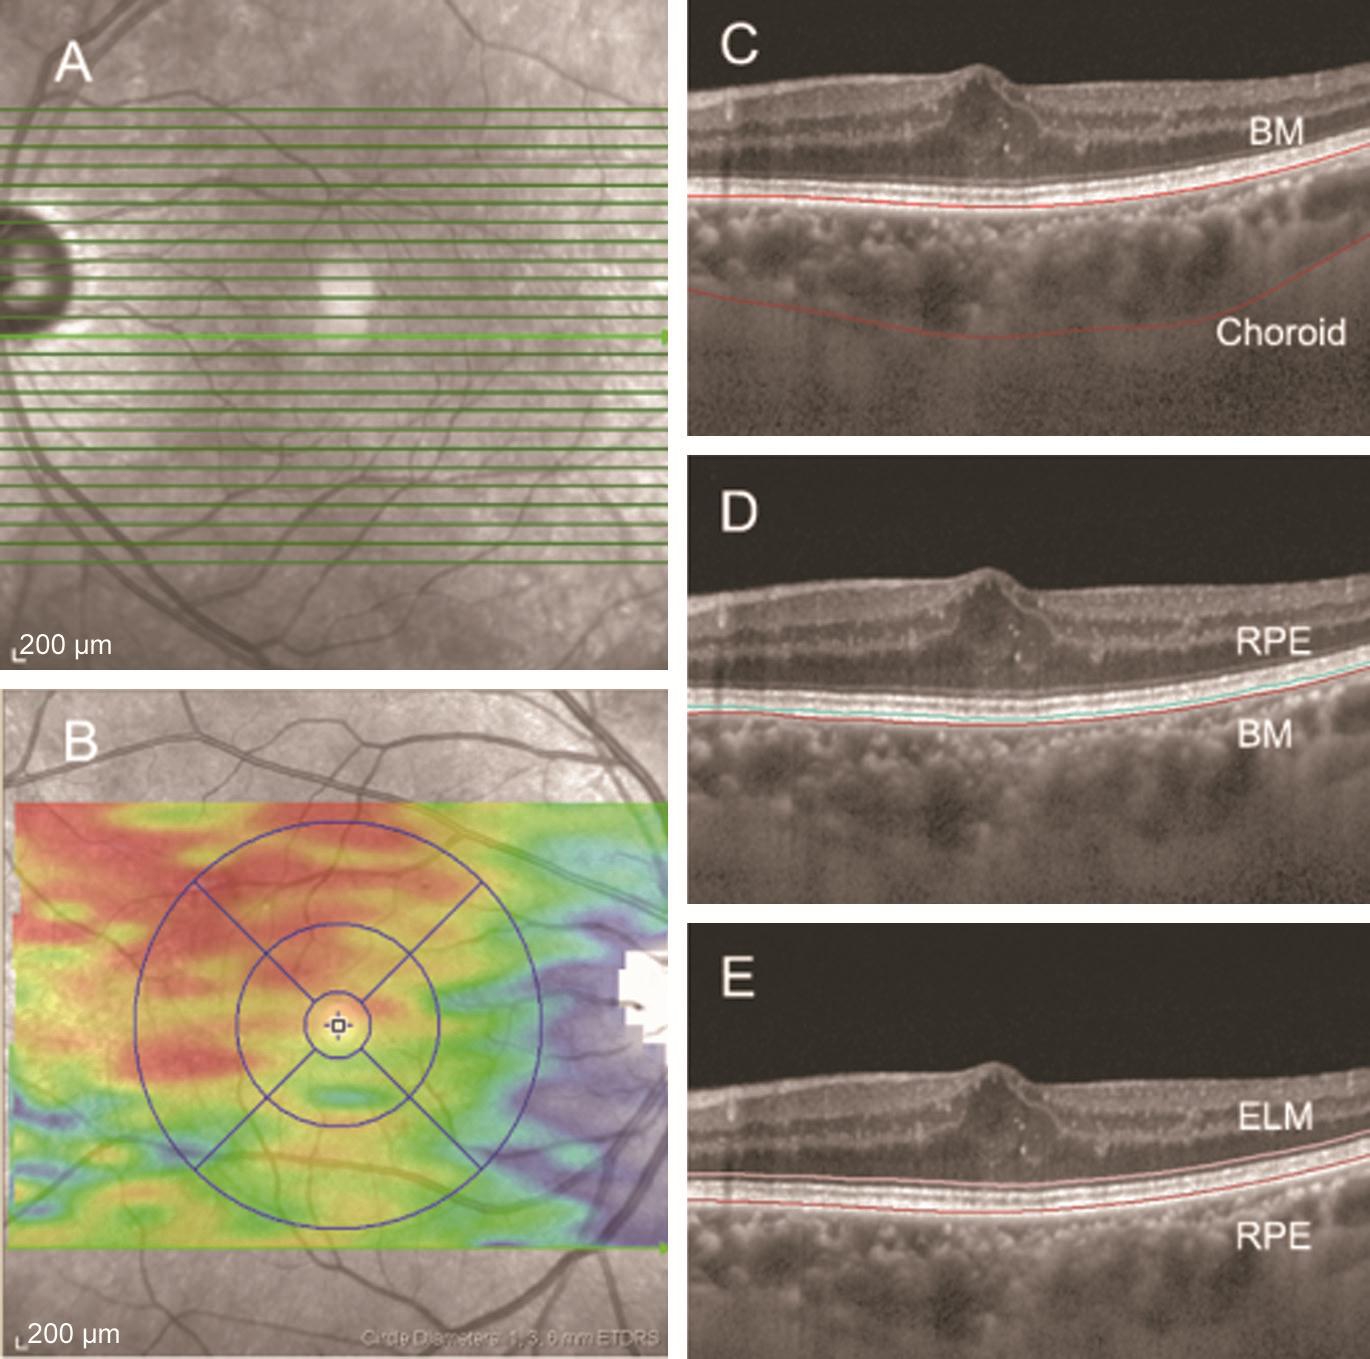
Optical Coherence Tomography ScanIn this visit, all patients also underwent SD-OCT. The chosen protocol was a high-resolution volume protocol, composed of 31 horizontal lines, centred to the fovea. An internal fixation light was applied to center the scanning area on the fovea. Each scan was 8.4 mm in length and spaced 240 µm apart from each other.All 31 OCT macular B scans were acquired in a continuous,automated sequence and covered a 30°×25° area centered on the fovea (Figure 1).
Determination of Choroidal, RPE and ORL Thickness and VolumeOnly high-quality images were accepted. All images were segmented by the intrinsic software segmentation algorithm (Heidelberg Eye Explorer software ver. 1.9.10.0,Heidelberg Engineering). The RPE thickness was defined as the layers from the RPE to the Bruch’s membrane (BM),the ORL thickness defined as the layers from the RPE to the ELM (Figure 1). After this process, the ORL and RPE thickness were calculated automatically, and presented as a colored topographic map with nine subfields as defined by the ETDRS-style grid through the built-in mapping software.In addition, we moved the automated retinal segmentation line to the choroidal segmentation line, making the dots at the internal limiting membrane line move to the BM line and the dots at the BM line to the chorio-scleral interface line (Figure 1). The choroidal volume in the ETDRS circle 6 mm was also calculated by built-in software. Each reader adjusted the segmentation lines of each image twice for the measurement of test-retest reliability.
Statistical AnalysisStatistical calculations were performed using statistical software (Statistical Package for Social Sciences Version 18.0; SPSS, Inc., Chicago, IL, USA). Comparative analyses of three or more groups were carried out using a oneway analysis of variance (ANOVA) followed by a post-test.Two groups were compared using one- and two-tailedt-tests with Bonferroni’s correction. The correlation analyses were evaluated on the basis of the Pearson correlation coefficient.Multiple linear regression was used to evaluate the explanatory variables with regard to the dependent variable, BCVA, inner retinal volume and macular RPE thickness.
Correlation between BCVA and retinal or choroidal thickness in each diabetic group was analyzed using the Pearson’s correlation coef ficient. The chosen level of statistical signi ficance wasP<0.05.
RESULTS
Baseline CharacteristicsA total of 79 eyes from 45 patients with DR meeting inclusion criteria for the study were evaluated.The number of eyes and patients, and the characteristics of the patients [age, gender, laterality, body mass index (BMI),BCVA, HbA1c level, axial length and refractive error] in each group are summarized in Table 1. When comparing the participants and measurements of the three groups, there were no differences in terms of age, gender, laterality, BMI,axial length and refractive error. As expected, BCVA was significantly reduced in eyes from the DR (P<0.001) and DME groups (P<0.001) when compared with control eyes. In addition, DMEs had significantly higher HbA1c levels than non-DMEs (P<0.001).
Table 1 Characteristics of patients
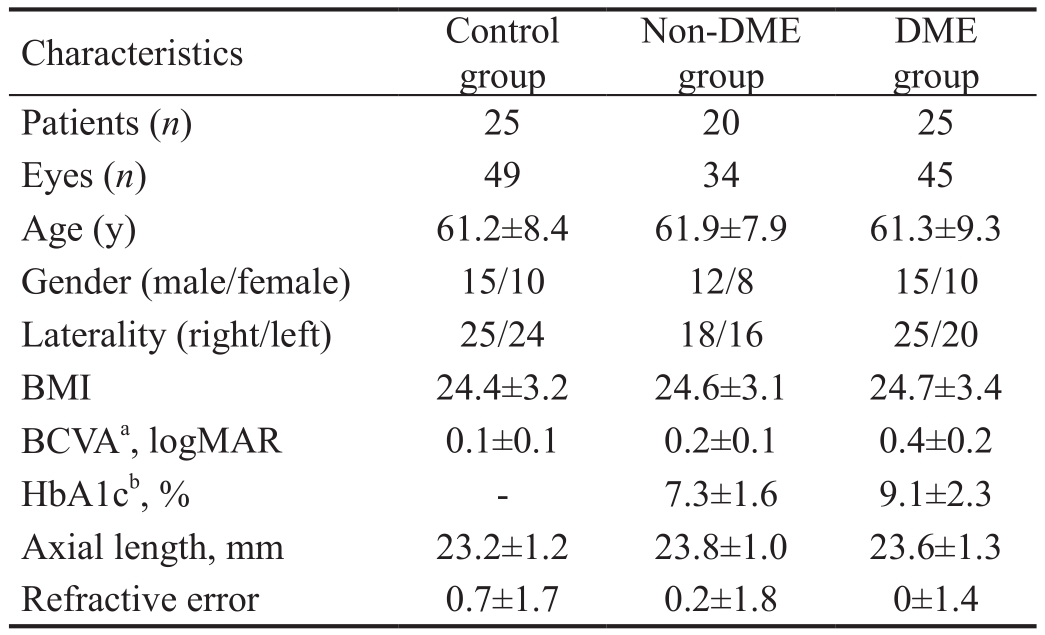
DME: Diabetic macular edema; BMI: Body mass index; BCVA:Best-corrected visual acuity; HbA1c: Hemoglobin A1c.aSigni ficant difference among groups by one-way ANOVA (P<0.001).bSigni ficant difference byt-test (P<0.001).
DME group Patients (n) 25 20 25 Eyes (n) 49 34 45 Age (y) 61.2±8.4 61.9±7.9 61.3±9.3 Gender (male/female) 15/10 12/8 15/10 Laterality (right/left) 25/24 18/16 25/20 BMI 24.4±3.2 24.6±3.1 24.7±3.4 BCVAa, logMAR 0.1±0.1 0.2±0.1 0.4±0.2 HbA1cb, % - 7.3±1.6 9.1±2.3 Axial length, mm 23.2±1.2 23.8±1.0 23.6±1.3 Refractive error 0.7±1.7 0.2±1.8 0±1.4 Characteristics Control group Non-DME group
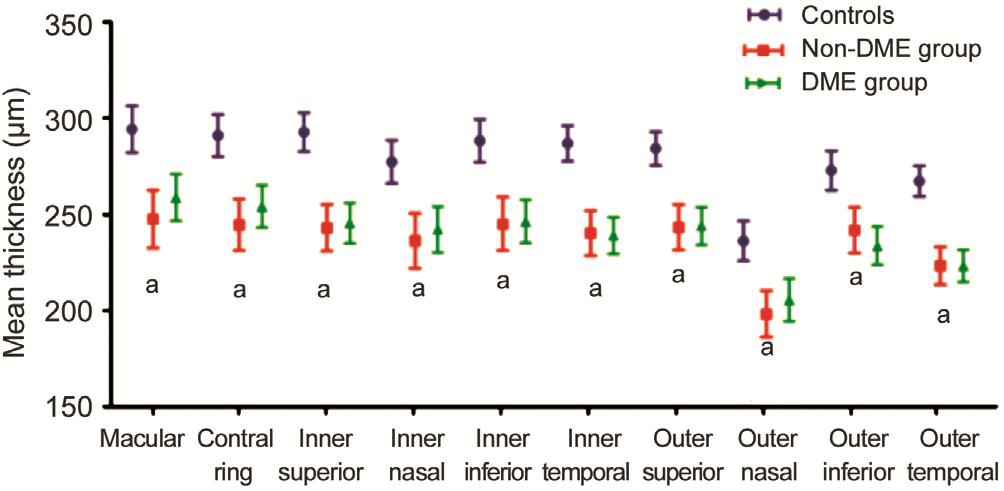
Inner Retinal Thickness and Choroidal Thickness Between Diabetic and Control ParticipantsRegarding choroidal thickness, the choroidal thickness in the non-DME and DME groups were decreased statistically significantly compared with the control group (P<0.05 for both non-DME and DME groups; Table 2, Figure 2). However, there were no statistically signi ficant differences in terms of any measurement partition between the DME and non-DME groups (P>0.05; Table 2,Figure 2).
Regarding inner retinal thickness, there were no statistically signi ficant differences in terms of any measurement between the non-DME and control group (P>0.05), except in the macular thickness and central ring (P=0.04,P=0.006,respectively; Table 2). However, the inner retinal thickness in the DME groups was increased statistically significantly in terms of any measurement compared with the non-DME and control groups (P<0.001 for both DR and control groups;Table 2).
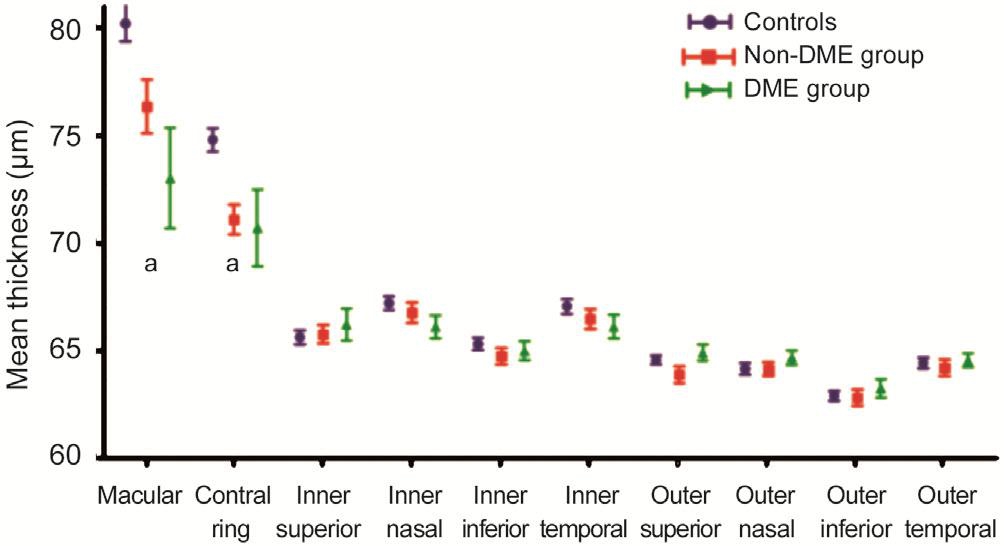
RPE and ORL Thickness Between Diabetic and Control ParticipantsIn all three groups, the RPE and ORL thickness were thickest in the macular or central ring among the all the assessed quadrants. Comparing among each group,there were no statistically significant differences in terms of any measurement partition between the DME and non-DME groups (P>0.05; Table 3, Figures 3 and 4). Regarding the ORL thickness, there were no statistically significant differences among each group, except in the macular and central ring (P<0.05 for both non-DME and DME groups as compared with the control group; Table 3, Figure 3).The mean macular ORL thickness in DME (73.02±15.34 μm) and non-DME groups (76.35±7.32 μm) were decreased statistically signi ficantly compared with the control group (80.20±5.85 μm;P=0.006,P=0.013, respectively).
In both the non-DME and DME groups, the RPE thickness was decreased statistically significantly compared with the control group (P<0.05 for both non-DME and DME groups;Table 3, Figure 4), except in the macular and central ring.The mean macular RPE thickness in DME (17.60±5.37 μm)and non-DME groups (17.44±5.08 μm) were not signi ficantly decreased compared with the control group (17.75±4.85 μm;P=0.894,P=0.782, respectively).
BCVA According to Different FactorsWe investigated the interaction between the variables that were found to besignificantly associated with worse VA. We found that there were signi ficant interactions with the total inner retinal volume and macular RPE thickness in the DME group (r=0.115,P<0.001,r=-0.013,P=0.017, respectively).
Table 2 The choroidal and inner retinal thickness in healthy individuals and diabetic patient groups in terms of any measurement
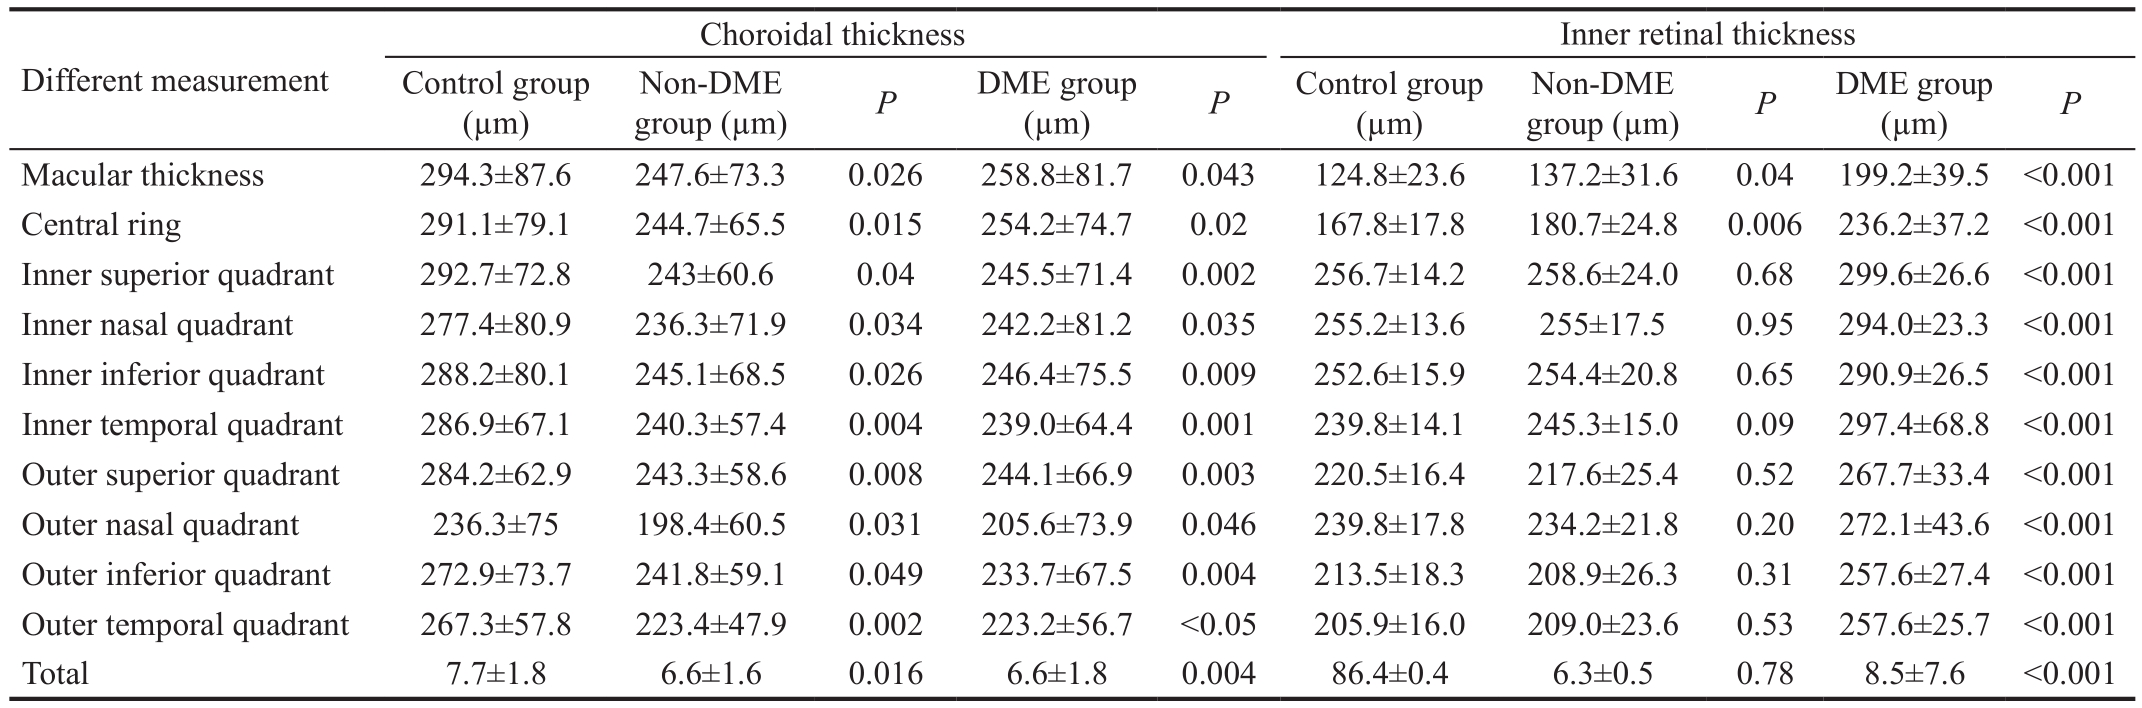
DME: Diabetic macular edema.
 Control group(µm)Different measurement group (µm)PDME group Non-DME(µm)PControl group(µm)group (µm)PDME group(µm)PNon-DME Macular thickness 294.3±87.6 247.6±73.3 0.026 258.8±81.7 0.043 124.8±23.6 137.2±31.6 0.04 199.2±39.5 <0.001 Central ring 291.1±79.1 244.7±65.5 0.015 254.2±74.7 0.02 167.8±17.8 180.7±24.8 0.006 236.2±37.2 <0.001 Inner superior quadrant 292.7±72.8 243±60.6 0.04 245.5±71.4 0.002 256.7±14.2 258.6±24.0 0.68 299.6±26.6 <0.001 Inner nasal quadrant 277.4±80.9 236.3±71.9 0.034 242.2±81.2 0.035 255.2±13.6 255±17.5 0.95 294.0±23.3 <0.001 Inner inferior quadrant 288.2±80.1 245.1±68.5 0.026 246.4±75.5 0.009 252.6±15.9 254.4±20.8 0.65 290.9±26.5 <0.001 Inner temporal quadrant 286.9±67.1 240.3±57.4 0.004 239.0±64.4 0.001 239.8±14.1 245.3±15.0 0.09 297.4±68.8 <0.001 Outer superior quadrant 284.2±62.9 243.3±58.6 0.008 244.1±66.9 0.003 220.5±16.4 217.6±25.4 0.52 267.7±33.4 <0.001 Outer nasal quadrant 236.3±75 198.4±60.5 0.031 205.6±73.9 0.046 239.8±17.8 234.2±21.8 0.20 272.1±43.6 <0.001 Outer inferior quadrant 272.9±73.7 241.8±59.1 0.049 233.7±67.5 0.004 213.5±18.3 208.9±26.3 0.31 257.6±27.4 <0.001 Outer temporal quadrant 267.3±57.8 223.4±47.9 0.002 223.2±56.7 <0.05 205.9±16.0 209.0±23.6 0.53 257.6±25.7 <0.001 Total 7.7±1.8 6.6±1.6 0.016 6.6±1.8 0.004 86.4±0.4 6.3±0.5 0.78 8.5±7.6 <0.001
Table 3 The ORL, RPE layer thickness in healthy individuals and diabetic patient groups in terms of any measurement

DME: Diabetic macular edema; RPE: Retinal pigment epithelium; ORL: Outer retinal layers.
 Different measurementControl group(µm)group (µm)PDME group (µm)PControl group(µm)Non-DME group (µm)PDME group(µm)PNon-DME Macular thickness 17.7±4.8 17.4±5.1 0.78 17.6±5.4 0.89 80.2±5.8 76.4±7.3 0.01 73.0±15.3 0.006 Central ring 16.9±2.3 16±2.9 0.11 16.3±3.2 0.63 74.8±3.9 71.1±4.0 0 70.7±11.6 0.033 Inner superior quadrant 17.5±2.4 14.3±17.1 <0.05 14.5±1.8 <0.05 65.6±2.4 65.7±2.5 0.80 66.2±4.9 0.439 Inner nasal quadrant 17.2±2.0 14.7±1.5 <0.05 15.0±1.6 <0.05 67.2±2.2 66.7±2.7 0.404 66.1±3.4 0.373 Inner inferior quadrant 16.4±1.6 14.4±2.6 <0.05 14.7±2.8 <0.05 65.3±2.1 64.7±2.2 0.223 65±2.8 0.537 Inner temporal quadrant 16.0±1.6 13.8±1.3 <0.05 14.1±1.6 <0.05 67.1±2.4 66.5±2.7 0.299 66.1±3.6 0.137 Outer superior quadrant 15.5±1.5 13.0±1.3 <0.05 13.3±1.5 <0.05 64.6±1.5 63.9±2.3 0.096 64.9±2.4 0.408 Outer nasal quadrant 15±1.6 12.6±0.9 <0.05 13.0±1.4 <0.05 64.1±1.9 64.1±1.9 0.981 64.7±2.2 0.224 Outer inferior quadrant 14.4±1.4 12.9±1.7 <0.05 13.1±1.7 <0.05 62.9±1.6 64.1±1.9 0.849 63.3±2.8 0.465 Outer temporal quadrant 14.5±1.4 12.9±1.1 <0.05 13.2±1.3 <0.05 64.4±1.7 64.3±2.2 0.61 64.5±2.1 0.753 Total 0.43±0.03 0.37±0.02 <0.05 0.38±0.03 <0.05 1.83±0.04 1.81±0.10 0.142 1.83±0.06 0.799
DISCUSSION
The purpose of this study was to evaluate the thickness changes of the choroid, RPE and ORL in patients with DME,and to investigate the correlation with VA. A structurally and functionally normal choroidal vasculature is necessary for retinal functioning; while abnormal choroidal blood volume and/or compromised blood flow can led to photoreceptor dysfunction and death[13]. The pathologic findings in diabetic people included focal vascular dilatation and narrowing,hypercellularity, increased tortuosity of the blood vessels,vascular loops and microaneurysm formation, areas of nonperfusion and sinus-like structure formation between the choroidal lobules[14-15]. These changes may be involved in the onset and/or progression of the DR.
In the present study, we found that central choroidal thickness evaluated by OCT is reduced in DR patients compared with normal healthy subjects, and no significant central choroidal thickness changes were observed between the non-DME and DME groups. It has been demonstrated that decreased choroidal thickness might be associated with retinal tissue hypoxia, because the major source of nutrition for the RPE and ORL come from the choroid[16]. Furthermore, choroidal thinning could explain the increased susceptibility to retinal hypoxia and ischemia in diabetics[17]. Finally, choroidal thinning may be related to the destruction of the BRB, leading to the onset or progression of DME.
In this study, the macular/central ring ORL thickness in the DME groups and non-DME groups were decreased signi ficantly compared with the control group and with a worse VA. The ELM is known to correspond to the adherens junctions between the photoreceptor cells and Müller cells, which is also prevents passage of macromolecules[18]. The light perception represent the photoreceptor function, which is the junction between the inner and outer segments of the photoreceptors(IS/OS) on OCT images. These layers on the OCT images be regarded indicate signi ficant implication about pathologies of the photoreceptors. According to research findings, there was a relationship between damage to the foveal photoreceptors and the VA in retinal vascular diseases[9,19-20]. Wonget al[8]investigated the correlation between ORL thickness and VA in 78 patients with DME. They found that central ORL thickness correlates better with vision than the total retinal thickness.
In our study, the macular/central ring ORL thickness in DR patients was significantly decreased compared to that of the control group. However, the BCVA was not only associated with the ORL thickness. These may indicate that the BCVA is more closely to the internal structure and function of ORL rather than the thickness changes. Ujiet al[21]reported that eyes with an intact inner segment ellipsoid line or ELM line had significantly better VA and higher parallelism than eyes with a discontinuous or absent inner segment ellipsoid line or ELM line in DME patients. Parallelism correlated well with VA. It also been reported that hyperre flective foci in DME are related to foveal photoreceptor damage and concomitant visual disturbance[22-24].
In this study, the macular/central ring RPE thickness in the DME and non-DME groups were decreased significantly compared with the control group and with a worse VA.Boyntonet al[25]found that untreated patients with proliferative diabetic retinopathy (PDR) also had diffusely thinned RPE layers compared with controls. The RPE exerts a enormous function on supporting photoreceptor function by transporting the vitamin A derivative retinal and supplying essential metabolites. The RPE is also responsible for light absorption and phagocytosis of shed photoreceptor of outer segments[26].Furthermore, the RPE is of great important for photoreceptor renewal and for the phagocytosis of membranes shed by the photoreceptors[25]. In patients with PDR, the thinned RPE layer in both groups revealed the disruption of normal RPE-ephotoreceptor complex anatomic features, structural findings that correlate well with the compromised RPE and photoreceptor function in these patients[25].
This study has several limitations. The first is the small sample size of the study. Selection bias could occur as a result of choosing a small group. There were measurement errors in the analysis of choroidal, ORL and RPE thickness. Also,the structure and function of each layers were not included in this study. With the development of analysis techniques and software, further studies should be performed on a large number of subjects.
In conclusion, the choroidal, ORL and RPE thickness were signi ficantly decreased in DR patients compared with controls in different segments, while no significantly changes were found between non-DME and DME groups. The total inner retinal volume and macular RPE thickness were associated with BCVA in DME.
ACKNOWLEDGEMENTS
Foundation:Supported by the Science and Technology Commission of Shanghai Municipality, China(No.16DZ0501100).
Conflicts of Interest: Wang XN,None;Li ST,None;Li W,None;Hua YJ,None;Wu Q,None.
REFERENCES
1 Romero-Aroca P. Managing diabetic macular edema: the leading cause of diabetes blindness.World J Diabetes2011;2(6):98-104.
2 Rayess N, Rahimy E, Ying GS, Bagheri N, Ho AC, Regillo CD, Vander JF, Hsu J. Baseline choroidal thickness as a predictor for response to antivascular endothelial growth factor therapy in diabetic macular edema.Am J Ophthalmol2015;159(1):85-91.e3.
3 Kim JT, Lee DH, Joe SG, Kim JG, Yoon YH. Changes in choroidal thickness in relation to the severity of retinopathy and macular edema in type 2 diabetic patients.Invest Opthalmol Vis Sci2013;54(5):3378-3384.
4 Esmaeelpour M, Brunner S, Ansari-Shahrezaei S, Nemetz S, Považay B, Kajic V, Drexler W, Binder S. Choroidal thinning in diabetes type 1 detected by 3-dimensional 1060 nm optical coherence tomography.Invest Opthalmol Vis Sci2012;53(11):6803-6809.
5 Esmaeelpour M, Považay B, Hermann B, Hofer B, Kajic V, Hale SL, North RV, Drexler W, Sheen NJL. Mapping choroidal and retinal thickness variation in type 2 diabetes using three-dimensional 1060-nm optical coherence tomography.Invest Opthalmol Vis Sci2011;52(8):5311-5316.
6 Regatieri CV, Branchini L, Carmody J, Fujimoto JG, Duker JS.Choroidal thickness in patients with diabetic retinopathy analyzed by spectral-domain optical coherence tomography.Retina2012;32(3):563-568.
7 Karahan E, Zengin MO, Tuncer I. Correlation of choroidal thickness with outer and inner retinal layers.Ophthalmic Surgery,Lasers and Imaging Retina2013;44(6):544-548.
8 Wong RLM, Lee JWY, Yau GSK, Wong IYH. Relationship between outer retinal layers thickness and visual acuity in diabetic macular edema.Biomed Res Int2015;2015:1-5.
9 Forooghian F, Stetson PF, Meyer SA, Chew EY, Wong WT, Cukras C,Meyerle CB, Ferris FL 3rd. Relationship between photoreceptor outer segment length and visual acuity in diabetic macular edema.Retina2010;30(1):63-70.
10 Kang JW, Chung H, Chan Kim H. Correlation of optical coherence tomographic hyperreflective foci with visual outcomes in different patterns of diabetic macular edema.Retina2016;36(9):1630-1639.
11 Xu HZ, Le YZ. Signi ficance of outer blood-retina barrier breakdown in diabetes and ischemia.Invest Opthalmol Vis Sci2011;52(5):2160-2164.
12 Photocoagulation for diabetic macular edema. Early Treatment Diabetic Retinopathy Study report number 1. Early Treatment Diabetic Retinopathy Study research group.Arch Ophthalmol1985;103(12):1796-1806.
13 Cao J, McLeod S, Merges CA, Lutty GA. Choriocapillaris degeneration and related pathologic changes in human diabetic eyes.Arch Ophthalmol1998;116(5):589-597.
14 Fryczkowski AW, Sato SE, Hodes BL. Changes in the diabetic choroidal vasculature: scanning electron microscopy findings.Ann Ophthalmol1988;20(8):299-305.
15 Hidayat AA, Fine BS. Diabetic choroidopathy. Light and electron microscopic observations of seven cases.Ophthalmology1985;92(4):512-522.
16 Linsenmeier RA, Padnick-Silver L. Metabolic dependence of photoreceptors on the choroid in the normal and detached retina.Invest Ophthalmol Vis Sci2000;41(10):3117-3123.
17 Bearse MA Jr, Han Y, Schneck ME, Adams AJ. Retinal function in normal and diabetic eyes mapped with the slow flash multifocal electroretinogram.Invest Ophthalmol Vis Sci2004;45(1):296-304.
18 Marmor MF. Mechanisms of fluid accumulation in retinal edema.Doc Ophthalmol1999;97(3-4):239-249.
19 Alasil T, Keane PA, Updike JF, Dustin L, Ouyang Y, Walsh AC,Sadda SR. Relationship between optical coherence tomography retinal parameters and visual acuity in diabetic macular edema.Ophthalmology2010;117(12):2379-2386.
20 Maheshwary AS, Oster SF, Yuson RM, Cheng LY, Mojana F, Freeman WR. The association between percent disruption of the photoreceptor inner segment-outer segment junction and visual acuity in diabetic macular edema.Am J Ophthalmol2010;150(1):63-67.e1.
21 Uji A, Murakami T, Unoki N, Ogino K, Horii T, Yoshitake S,Dodo Y, Yoshimura N. Parallelism for quantitative image analysis of photoreceptor-retinal pigment epithelium complex alterations in diabetic macular edema.Invest Ophthalmol Vis Sci2014;55(5):3361-3367.
22 Bolz M, Schmidt-Erfurth U, Deak G, Mylonas G, Kriechbaum K,Scholda C, Diabetic Retinopathy Research Group Vienna. Optical coherence tomographic hyperre flective foci: a morphologic sign of lipid extravasation in diabetic macular edema.Ophthalmology2009;116(5):914-920.
23 Uji A, Murakami T, Nishijima K, Akagi T, Horii T, Arakawa N, Muraoka Y, Ellabban AA, Yoshimura N. Association between hyperre flective foci in the outer retina, status of photoreceptor layer, and visual acuity in diabetic macular edema.Am J Ophthalmol2012;153(4):710-717,717.e1.
24 Nishijima K, Murakami T, Hirashima T, Uji A, Akagi T, Horii T, Ueda-Arakawa N, Muraoka Y, Yoshimura N. Hyperre flective foci in outer retina predictive of photoreceptor damage and poor vision after vitrectomy for diabetic macular edema.Retina2014;34(4):732-740.
25 Boynton GE, Stem MS, Kwark L, Jackson GR, Farsiu S, Gardner TW. Multimodal characterization of proliferative diabetic retinopathy reveals alterations in outer retinal function and structure.Ophthalmology2015;122(5):957-967.
26 Finnemann SC. Focal adhesion kinase signaling promotes phagocytosis of integrin-bound photoreceptors.EMBO J2003;22(16):4143-4154.
Citation:Wang XN, Li ST, Li W, Hua YJ, Wu Q. The thickness and volume of the choroid, outer retinal layers and retinal pigment epithelium layer changes in patients with diabetic retinopathy.Int J Ophthalmol2018;11(12):1957-1962
DOl:10.18240/ijo.2018.12.14
● KEYWORDS:choroid; diabetic macular edema; outer retinal layers; retinal pigment epithelium; diabetic retinopathy
Received:2017-01-25 Accepted: 2018-03-01
Correspondence to:Qiang Wu. Department of Ophthalmology,Shanghai Jiao Tong University Affiliated Sixth People’s Hospital, 600 Yishan Road, Shanghai 200233, China. Qiang.wu@shsmu.edu.cn