Visual impairment (VI) and blindness are worldwide,social, economic and public health problems especially for developing countries[1]. There are 285 million people living with VI worldwide (246 million low vision and 39 million blind); 63% of low vision and 82% of blind people were aged 50y and over[2]. VI is unequally distributed in the World Health Organization (WHO) regions, the lowest prevalence is seen in the American (AMR) and European region (EUR) (29.1 and 31.7 cases per 1000 population respectively), whereas the highest prevalence is seen in the WHO Eastern Mediterranean Region (EMR) at 40.5/1000, and South-East Asia Region(SEAR) (without India) at 48.2/1000 population[3-4].Developing countries host approximately more than 90%of the visually impaired people, 66% of them comprised by China, India, EMR and Sub-Saharan Africa[2,5]. Access to the preventive and eye curative services are severely limited in these countries due to lack of or un-equal distribution of services[6].
The real financial cost of VI worldwide is estimated to be$2954 billion in 2010. The real financial cost is comprised of two components: direct (health-related) costs of vision loss estimated as $2302 billion, and indirect costs (production losses, informal care and deadweight welfare losses) estimated as $652 billion[7].
The WHO estimated burden of disease due to VI as 3.3% of the total Disability Adjusted Life Years (DALYs) in the 2004[8].VI also affects many activities related to quality of life, such as leisure and work, social and consumer interaction, and household and personal care as well as related to reading[9-10].
Women are more likely to become visually impaired or blind compare to men. Almost in every region of the world, studies indicated a higher prevalence of VI among women with female/male ratios from 1.5 to 2.2[4].
The presence of age-related eye diseases such as cataract,diabetic retinopathy (DR) and age-related macular degeneration(AMD) lead to VI has also been claimed to be associated with increased mortality risk; participants with VI had a higher allcause mortality rate [hazard ratio (HR) =1.57; 95%CI 1.25-1.96][11].In Pakistan, the prevalence of VI was estimated at 17.7%among people aged 30 and over[12], in Tehran, it was 14%among people aged 50 and over[13], and in Southern Urban China, it was estimated as 10.7% for people aged 50 and over[14].Prevention and treatment of VI lead to substantial decrease in the consequences caused by VI and blindness. As prevention of VI is a high priority for public health, population-based studies for providing up-to-date information about magnitude and causes of VI is required.
Afghanistan is in the list of low developing countries. There are no figures regarding the prevalence and main causes of VI. These parameters are very important for designing of meaningful preventive and curative strategies; therefore,a population-based cross-sectional study was designed to determine the prevalence of VI, its main causes and related factors in Nangarhar Province of Afghanistan.
Ethical permission for this study was obtained from Non-Interventional Clinical Research Ethics Board of Hacettepe University. Before the starting of study, the permissions were also obtained from the Nangarhar Medical Faculty and Regional Public Health Administration of Afghanistan.Furthermore, the objectives of the study and the procedure were explained to every participant and a written consent was taken.The study was carried out in five divisions (Nahias) of Jalalabad City, the capital of Nangarhar Province, which is subdivided by 70 locus (Gozar), and four rural districts(Bihsud, Kuz Kunar, Kama and Surkh Rod districts) located in 20 km distance around the provincial capital. Six villages out of 66 from Bihsud District, 21 villages out of 95 from Surkh Rod District, 4 villages out of 68 from Kama District and 22 villages out of 65 from Kuz Kunar District were left out because of either security constraints or transportation problems (totally 53 out 294 villages were left out from the study). Therefore, sampling frame included 5 divisions (70“Gozars”-neighborhood unit directed by a reeve) of Jalalabad City and 241 villages, located in the four rural districts of Nangarhar Province.
The universe of the study composed of 50y and over population residing in the study area. Since, the proportion of 50y and over population was not known for each division of Jalalabad City and districts, it was assumed that these places have similar proportions as the whole province, which calculated as 10% for city center and 11% for districts[15].
The sample size was calculated, using![]() formula [n=55 735 -total study population aged 50y and over,P=17.7% which is the prevalence of VI in neighbor country,Pakistan[12], Q=1-P,Z=1.96 the value ofZtable atα=0.05 level,d=3%, design effect (DE)=2] as 1229.9≈1230. Considering the probable non-response rate as 10% of calculated sample size(1230), sample size increased to 1230+123=1353 people.
formula [n=55 735 -total study population aged 50y and over,P=17.7% which is the prevalence of VI in neighbor country,Pakistan[12], Q=1-P,Z=1.96 the value ofZtable atα=0.05 level,d=3%, design effect (DE)=2] as 1229.9≈1230. Considering the probable non-response rate as 10% of calculated sample size(1230), sample size increased to 1230+123=1353 people.
The study considered both urban and rural areas of Nangarhar Province. Jalalabad City as an urban and four districts as rural areas were listed separately. Calculated sample size was allocated to urban and rural strata, using probability proportion to size method.
Simple one stage cluster sampling method has been used for the selection of clusters. Eligible people from each cluster were requested by house to house visit to participate in the study. Inclusion criteria: people aged 50y and over, who lived in selected area for at least six months, had cooperation with the interviewer and accepted to participate in the study were included. Exclusion criteria: people not available during two successive visits, and accept the interview but rejected the eye examination were excluded from the study.
As there was no information about population size, characteristics of general population, socioeconomic conditions, geographical conditions and health service facilities of each village and“Gozar”, it was assumed that all above conditions were similar among the 241 villages of the four districts.
In Jalalabad City, one street from the streets of each “Gozar”was randomly selected, 8 eligible persons (cluster size) from 42 “Gozars” and 7 eligible persons (cluster size) from the remaining 28 “Gozars” were requested to participate in the study. Villages of each district listed as clusters separately and 3 clusters from Bihsud, 4 from Kama, 3 from Kuz Kunar and 5 from Surkh Rod District were randomly selected.
By inviting 8 people from 42 “Gozars” and 7 people from 28“Gozars” in Jalalabad City, 532 eligible people were invited to participate. Out of them, 520 accepted, 4 refused, 7 were not at home and one rejected eye examination. In Bihsud District,277 people were invited; 263 participated, 11 refused, one was absent and two did not accept eye examination. In Kama District, 194 eligible people were invited; 175 accepted, 15 refused, 3 were not at home and one refused eye examination.In Kuz Kunar District, 98 people invited to study; 93 accepted and 4 refused and one was not available. In Surkh Rod District,252 were requested to participate in the study; 230 accepted,16 refused and 6 were absent. Generally, in four districts,821 eligible people were invited to participate in the study;761 accepted, 46 refused, 10 were not at home, one was not available and 3 refused eye examination.
Totally, by requesting 532 people from all “Gozars” of Jalalabad City and 821 people from four districts (277 people from Bihsud District, 194 people from Kama District, 98 people from Kuz Kunar District, and 252 people from Surkh Rod District), a total of 1353 people achieved. Out of them 1281 accepted, 50 refused, 17 were not at home, 4 rejected eye examination and one was not available. At the end, the analysis was performed on 1281 participants.
A structured, pre-tested questionnaire developed by the researcher was used for data collection. In the questionnaire,some socio-demographic and personal characteristics of the person; chronic disease history; some characteristics related to VI were enquired. The visual acuity (VA) screening results,height and weight measurements were also recorded at the end of the questionnaire. The form was prepared in English,translated and implied in local language. The data collection instrument was reviewed by the researcher, advisor, and another ophthalmologist. After finalization of the survey form,it was pre-tested at one non-sampled village of the Bihsud District on 70 persons, and the necessary revisions were performed.
The WHO de finition criterion was used for VI (low vision and blindness). VI was used as presenting VA less than 6/18 but equal to or more than no light perception in the better eye using Snellen chart. Low vision (LV) was used as presenting VA of less than 6/18 but equal to or better than 3/60 in the better eye using Snellen chart. Blindness was used as presenting VA of less than 3/60 in the better eye using Snellen chart[16].
The calculated body mass indices (BMIs) were categorized according to WHO criteria[17]as underweight if BMI<18.50,normal weight if between 18.50-24.99, overweight if between 25.0-29.9, and obese if equal or more than 30.0. As the number of participants with under-weight (n=46) and obesity (n=57)were very low, underweight was combined with normal weight and obese was combined with overweight and BMI status was used as a two category in the bivariate and multivariate analysis.
Each of the chronic diseases stated by the participants was not analyzed separately because of insufficient sample size;they were analysis as a single variable of three categories “no chronic diseases”, “chronic diseases without hypertension”,and “hypertension with or without chronic disease”. The number of single participants was very few (n=5), and there were no divorce and separated participants in the study area.Therefore, marital status was classified as two categories,currently married and currently not married and the number of single participants was added to the category of currently not married. Moreover, the number of participants with university degree was very few (n=23), they were combined with the participants graduated from high school and not considered as a separate category in the analysis.
VA assessment, lens examination and examination for principle causes of presenting vision less than 6/18 were carried out based on manual developed for Rapid Assessment of Avoidable Blindness (RAAB)[18]. Both eyes (each eye separately) of the participants were screened by using “E”optotype of size 18 of the Snellen chart on one side and an “E”optotype of size 60 on the other side at 6- or 3-meters distance during household visits by ophthalmic nurses at outdoor under day light. Those, who scored 6/18 or greater in both eyes were in no need of further examination. Those, who scored less than 6/18 in either eye, were reexamined by ophthalmic nurse using a pinhole. In the case, VA could not be improved by the pinhole, the ophthalmologist completely examined the eyes, made the diagnosis related to VI and filled out the form.Those, who scored less than 6/18 in one or both eyes and their VA were improved to 6/18 by pinhole, they were recorded as uncorrected refractive error (URE) and were given a referral letter to the Ophthalmology Department of Nangarhar University Hospital for discrimination of the type of the URE.Height and weight of all the subjects were measured.Weight of the subject was measured with cloths only using bathroom scale and recorded to the nearest 0.1 kg and height was measured without shoes, on flat surface and recorded to the nearest 0.1 cm, using “drop down” tape measure.Reliable measurement was taken by marking a point (top of participant’s head) against a wall and measuring up to it.
Recruitment of the staff for data collection was done by the help of the Ophthalmology Department of Nangarhar University Hospital and effort was made for recruiting skilled and experienced staff for the study. Team members were trained with emphasis on familiarizing the survey objectives,methodology, recording the VA, measurement of height and weight and filling out the questionnaire. The field work was supervised by the team leader at all steps of field study.
Data was analyzed using IBM SPSS Statistics 21.0 at the Institute of Public Health, Hacettepe University, Ankara-Turkey.The prevalence of VI was estimated with 95% confidence interval (95%CI). Logistic regression analysis was used for determining the strength of the association between dependent and independent variables. All independent variables withP<0.20 and variables considered as medically signi ficant were put in the regression model, backward conditional method of logistic regression was selected. Odds ratio (OR) and 95%CI were calculated. Threshold for statistically significance was accepted atP<0.05.
From Oct. 01, 2015 to Oct. 27, 2015, 1384 people (532 in Jalalabad City and 821 in 4 districts) were requested to participate in the study. Out of 1353 people 1281 (94.7%)people accepted participation. Men were participated slightly higher (53.2%) than women. Less than one-fourth (23.5%)of the participants were aged 65y and over; almost two-thirds were illiterate; 73.1% were married at the time of the survey;59.4% resided at rural areas. According to self-evaluation,30.0% stated that their socioeconomic status as “bad” (Table 1).Generally, 170 (13.3%) of the participants reported their health status as poor, 48.4% fair and 38.3% good. Of the participants,27.8% were overweight/obese; 20.8% had hypertension (HTN)and 4.6% had diabetes mellitus (DM) already diagnosed by a physician; 30.0% were currently smoker. More than two-thirds(67.5%) spent more than 6h outdoor in a day, and only 11.2%were wearing sunglasses at outdoor for eye protection (Table 2).The prevalence of VI (VA<6/18 in the better eye on presentation) was determined as 22.6% (95%CI, 20%-25%).LV (VA<6/18 to ≥3/60 in the better eye on presentation) as 13.9% (n=178; 95%CI, 12%-16%) and blindness (VA<3/60 in the better eye on presentation) as 8.7% (n=112; 95%CI, 7.0%-10.0%).There are 61.4% of VI composed by LV and 38.6% by blindness.The most common causes of the VI were cataract (52.8%),followed by URE (26.9%), glaucoma (8.6%), other posterior segment disorders (4.8%), AMD (3.4%), corneal opacity(CO) and DR each at 1.4%, and cataract surgical complication and phthisis (each at 0.3%). Number one cause of LV was URE (42.0%) compared to the cataract for blindness at 72.0%. The second main cause of LV was cataract (40.4%)followed by glaucoma (7.9%), AMD (4.5%), DR (2.2%), CO(1.7%), other posterior segment disorders (1.1%) and cataract surgical complication (0.6%), whereas the second cause of the blindness was other posterior segment disorders (10.7%)followed by glaucoma (9.8%), URE (3.6%), AMD (1.8%), CO and phthisis each at 0.9%.
Table 1 Bivariate analysis of VI, low vision and blindness by some sociodemographic characteristics (Nangarhar-Afghanistan, 2015) %
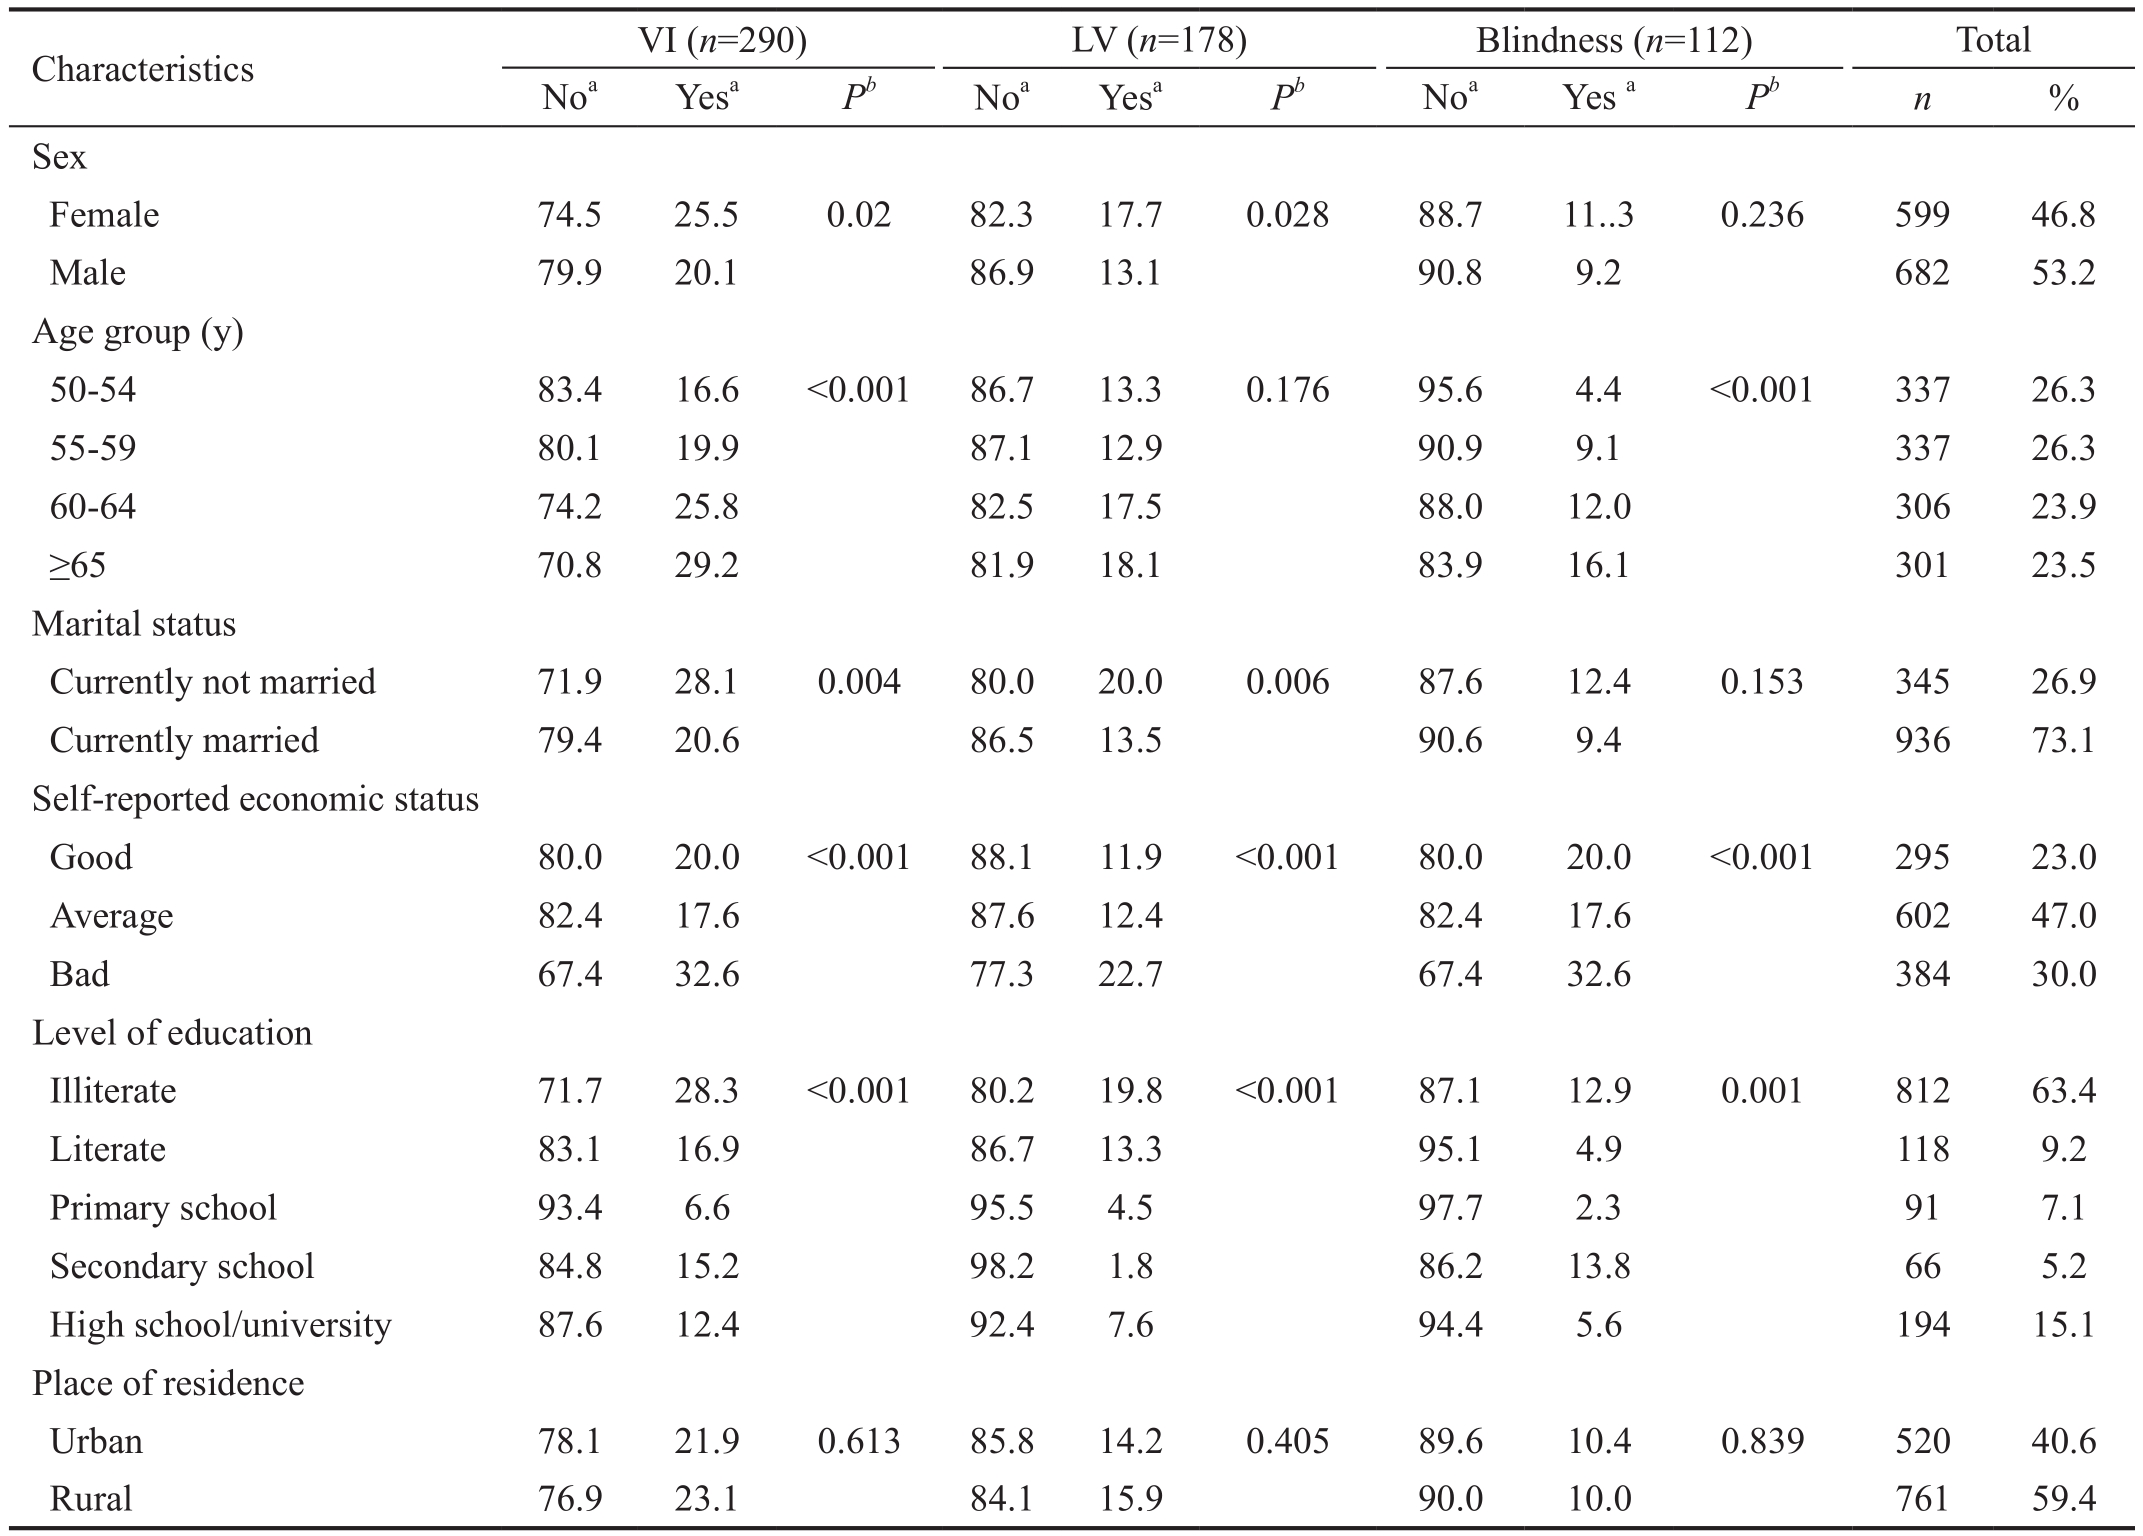
aRow percentage;bChi-square. VI: Visual impairment; LV: Low vision.
 Sex Female 74.5 25.5 0.02 82.3 17.7 0.028 88.7 11..3 0.236 599 46.8 Male 79.9 20.1 86.9 13.1 90.8 9.2 682 53.2 Age group (y)50-54 83.4 16.6 <0.001 86.7 13.3 0.176 95.6 4.4 <0.001 337 26.3 55-59 80.1 19.9 87.1 12.9 90.9 9.1 337 26.3 60-64 74.2 25.8 82.5 17.5 88.0 12.0 306 23.9≥65 70.8 29.2 81.9 18.1 83.9 16.1 301 23.5 Marital status Currently not married 71.9 28.1 0.004 80.0 20.0 0.006 87.6 12.4 0.153 345 26.9 Currently married 79.4 20.6 86.5 13.5 90.6 9.4 936 73.1 Self-reported economic status Good 80.0 20.0 <0.001 88.1 11.9 <0.001 80.0 20.0 <0.001 295 23.0 Average 82.4 17.6 87.6 12.4 82.4 17.6 602 47.0 Bad 67.4 32.6 77.3 22.7 67.4 32.6 384 30.0 Level of education Illiterate 71.7 28.3 <0.001 80.2 19.8 <0.001 87.1 12.9 0.001 812 63.4 Literate 83.1 16.9 86.7 13.3 95.1 4.9 118 9.2 Primary school 93.4 6.6 95.5 4.5 97.7 2.3 91 7.1 Secondary school 84.8 15.2 98.2 1.8 86.2 13.8 66 5.2 High school/university 87.6 12.4 92.4 7.6 94.4 5.6 194 15.1 Place of residence Urban 78.1 21.9 0.613 85.8 14.2 0.405 89.6 10.4 0.839 520 40.6 Rural 76.9 23.1 84.1 15.9 90.0 10.0 761 59.4
While analyzing LV, the number of blind people (n=112) was subtracted from the total and for blindness, the number of people with LV (n=178) was subtracted. In bivariate analysis,it was found that by increasing of the age, the prevalence of VI(P<0.001) and blindness (P<0.001) were also increased while for LV, the increment was not signi ficant (P=0.176). Similarly,the prevalence of VI was found to be higher in participants with reported bad economic status than the participants with fair and good (P<0.001), and this situation is the same for LV (P<0.001) and blindness (P<0.001). Furthermore, VI,LV and blindness were differently distributed among various levels of education and sex; however, the distributions were not significantly different among place of residence (Table 1).Distribution of VI, LV and blindness among participants by some health-related characteristics and behavior of the participants shown in Table 2.
Table 2 Bivariate analysis of VI, low vision and blindness by health-related characteristics and behaviors of the participants (Nangarhar-Afghanistan, 2015) %
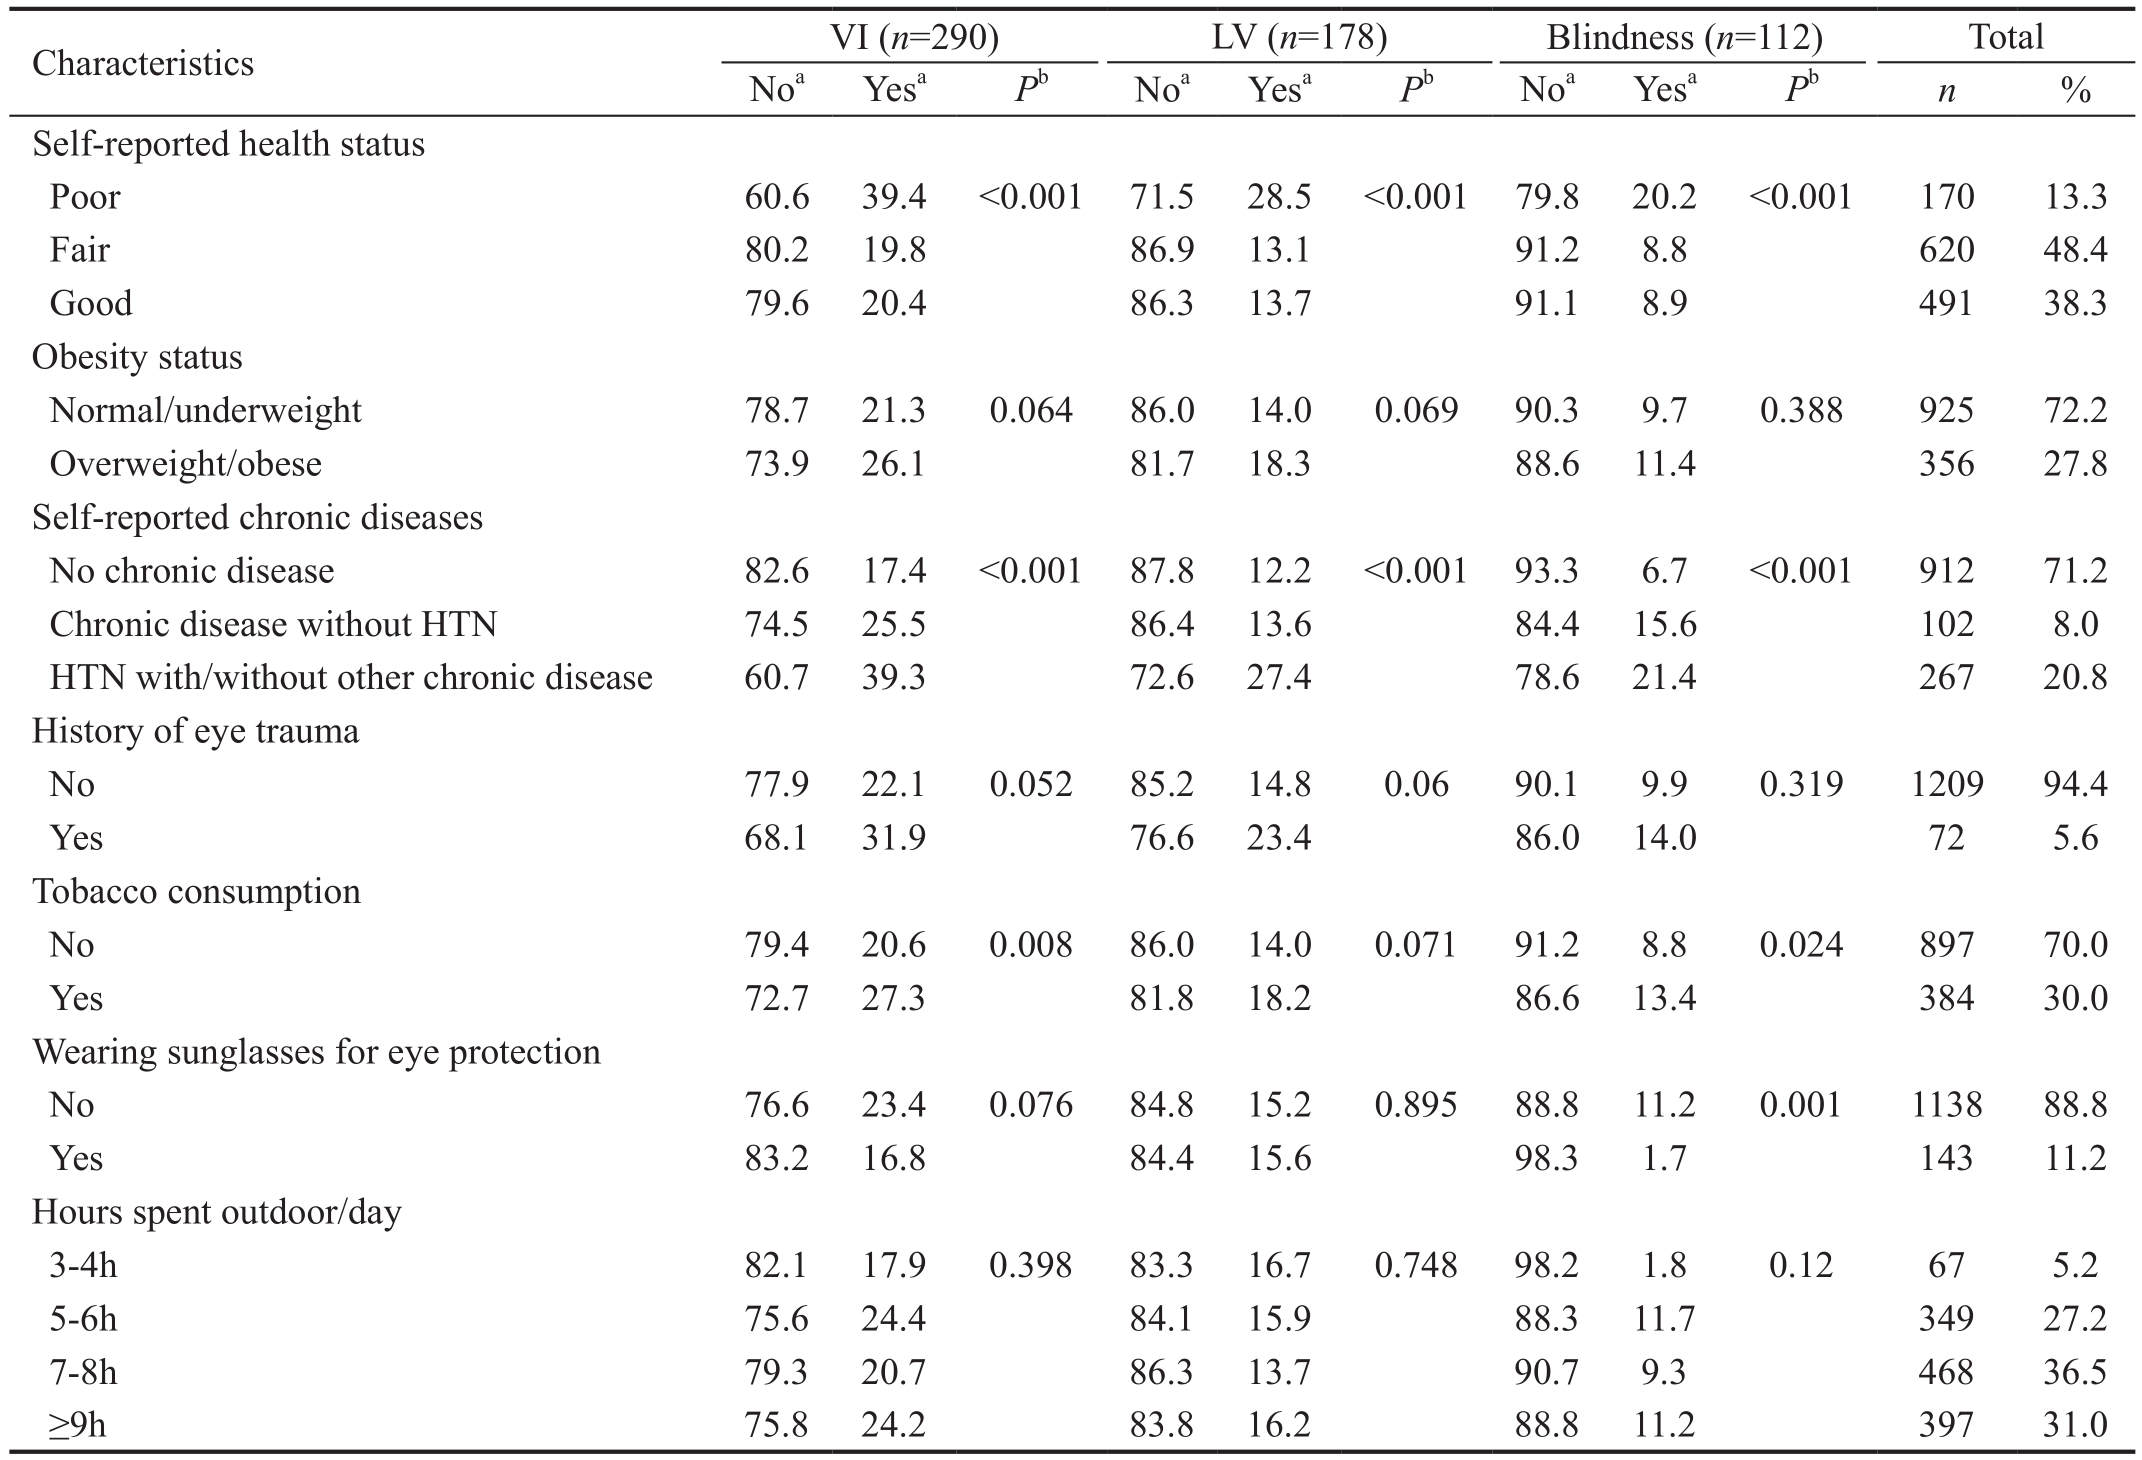
aRow percentage;bChi-square. VI: Visual impairment; LV: Low vision; HTN: Hypertension.
 Self-reported health status Poor 60.6 39.4 <0.001 71.5 28.5 <0.001 79.8 20.2 <0.001 170 13.3 Fair 80.2 19.8 86.9 13.1 91.2 8.8 620 48.4 Good 79.6 20.4 86.3 13.7 91.1 8.9 491 38.3 Obesity status Normal/underweight 78.7 21.3 0.064 86.0 14.0 0.069 90.3 9.7 0.388 925 72.2 Overweight/obese 73.9 26.1 81.7 18.3 88.6 11.4 356 27.8 Self-reported chronic diseases No chronic disease 82.6 17.4 <0.001 87.8 12.2 <0.001 93.3 6.7 <0.001 912 71.2 Chronic disease without HTN 74.5 25.5 86.4 13.6 84.4 15.6 102 8.0 HTN with/without other chronic disease 60.7 39.3 72.6 27.4 78.6 21.4 267 20.8 History of eye trauma No 77.9 22.1 0.052 85.2 14.8 0.06 90.1 9.9 0.319 1209 94.4 Yes 68.1 31.9 76.6 23.4 86.0 14.0 72 5.6 Tobacco consumption No 79.4 20.6 0.008 86.0 14.0 0.071 91.2 8.8 0.024 897 70.0 Yes 72.7 27.3 81.8 18.2 86.6 13.4 384 30.0 Wearing sunglasses for eye protection No 76.6 23.4 0.076 84.8 15.2 0.895 88.8 11.2 0.001 1138 88.8 Yes 83.2 16.8 84.4 15.6 98.3 1.7 143 11.2 Hours spent outdoor/day 3-4h 82.1 17.9 0.398 83.3 16.7 0.748 98.2 1.8 0.12 67 5.2 5-6h 75.6 24.4 84.1 15.9 88.3 11.7 349 27.2 7-8h 79.3 20.7 86.3 13.7 90.7 9.3 468 36.5≥9h 75.8 24.2 83.8 16.2 88.8 11.2 397 31.0
In multivariate analysis of the VI, all variables withP<0.20(age group; sex; level of education; marital status; self-reported economic status, self-reported health status, and chronic disease; eye trauma in the past; obesity status; consuming tobacco products; sunglass use for eye protection; place of residence) and that thought to be medically significant(hours spending outdoor per day) were put in the backward conditional regression analysis.
The results indicated that illiteracy, self-reported bad economic status, self-reported HTN and being overweight/obese were independently associated with the VI (Table 3).
Multivariate analysis of LV was performed by putting all explanatory variables that either statistically signi ficantP<0.20(sex, level of education, marital status, self-reported economic status, self-reported health status, self-reported chronic diseases, eye trauma in the past, consuming tobacco product,age group, and obesity status) or thought to be medically signi ficant (place of residence and hours spending outdoor per day) in to the backward conditional regression analysis.
Factors identified as independently related to LV were: level of education (illiterates compare to high school/university graduates), self-reported economic status (bad compared to good), self-reported chronic disease (self-reported HTN with/without other chronic disease compared to no chronic disease)and obesity status (overweight/obese compared to normal/underweight; Table 4).
Table 3 Multivariate analysis of independent variables and VI(Nangarhar-Afghanistan, 2015)
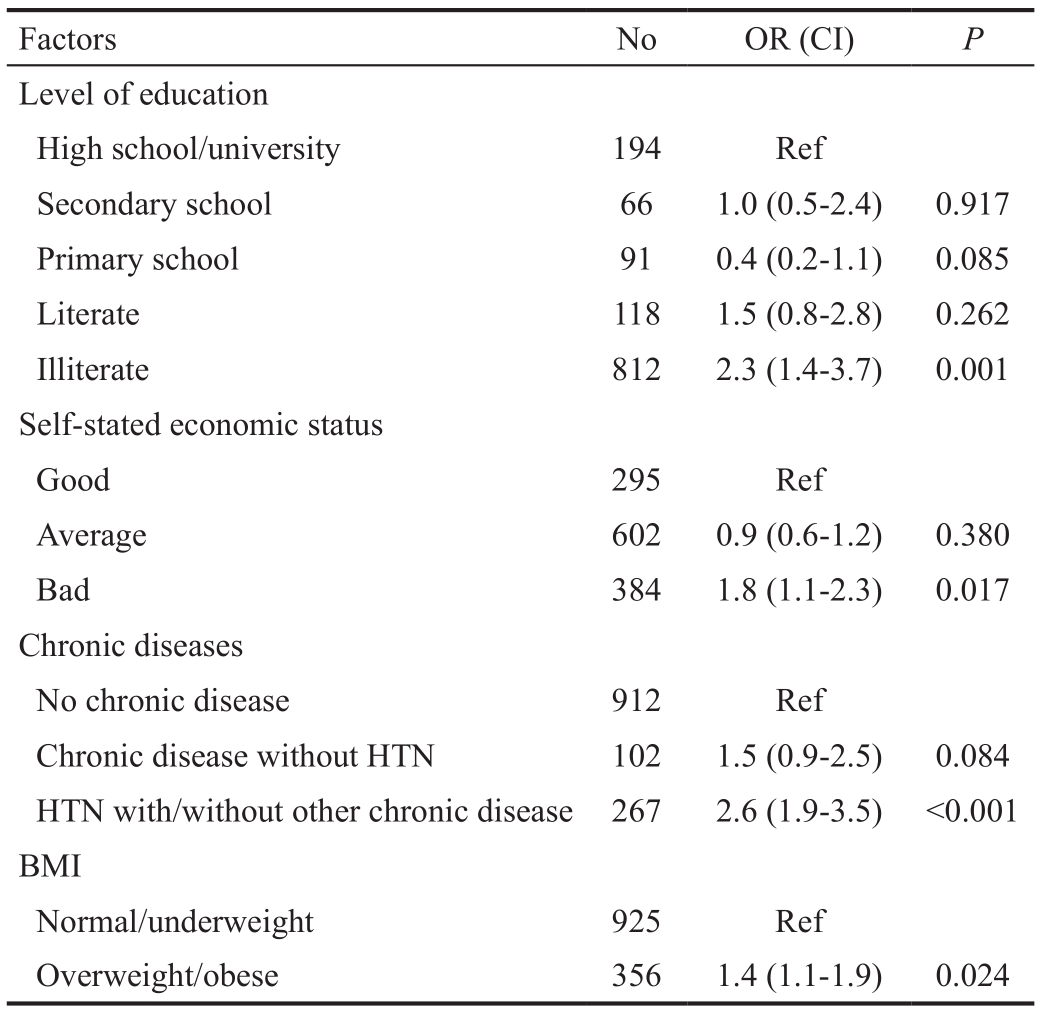
R square =0.084 (Cox and Snell), 0.128 (Nagelkerke), 0.892 (Hosmer and Lemeshow Test). Last step (10th); Backward: Conditional method.
?
Multivariate analysis of blindness was conducted by putting all explanatory variables with aP<0.20 (age group, level of education, self-reported economic status, self-reported health status, self-reported chronic disease, consuming tobacco product, using of sunglasses, marital status) in the bivariate analysis and variables thought to be medically significant(obesity status, hours spent outdoor per day, and sex) into the analysis of backward conditional logistic regression.
Increasing age, having hypertension with/without other chronic disease and using no sunglass were indicated to be independently associated with the blindness (Table 5).
A total of 1281 people participated in this study; 53.2% were males and 46.8% were females. Male/female ratio in this study was 1.14:1.00 which was meaningfully higher than the overall population male/female ratio 1.03:1.00 in Afghanistan[19].Overall female participation in the study is less than male,which might have pointed out the in fluence of cultural factors that inhibited the complete participation of women in such activities. However, generally, the sex ratio in this study follows the pattern of general male/female ratio in Afghanistan 1.03:1.00[19].
The overall literacy rate was found to be 36.6%. Literacy rate in this study is slightly higher than in Afghanistan which is 31.4%[20]. The reason for higher literacy rate in this study might be due to the relatively high security situation. Bihsud,Kama, Kuz Kunar and Surkh Rud districts are located around Jalalabad City (the capital of Nangarhar Province), which are in some extend being secured with better availability and accessibility of schools for both boys and girls. Afghanistan is one of the countries with lowest literacy rate, which comes at third after Burkina Faso and South Sudan in the list of top 10 countries with the worst literacy rate in the world[21]. According to the United Nations Educational, Scientific and Cultural Organization (UNESCO), literacy rate in some neighbor countries of Afghanistan are as follows: Pakistan 55.0%[22],Islamic Republic of Iran 87.2%[23], In Uzbekistan 100.0%[24],Turkmenistan and Tajikistan 99.6% and 99.7%. respectively[25].The prevalence of VI is higher (22.6%) than the result of study performed in Iran, which was 9.4% for 40-59y old and 53.1%for 60y old and over population[1]. It is also higher compared with the results of the “Pakistan National VI and Blindness Survey” 17.7%[12]. However, the de finition of VI was different in the Iranian study (best corrected VA), and in Pakistan study, 30y and older people were included[12]. The prevalence of VI was reported in different parts of China differed from 10.2% to 25.0%[26-29], which cover the prevalence of VI in this study. Furthermore, another study conducted in Sindhudurg District on the western coastal strip of India, indicated that the prevalence of VI was 48.3% among 50-year old and over population which is much higher than the prevalence of thecurrent study[30]. Although VI is unequally distributed in the world with lowest rate among AMR and EUR and the highest among EMR[3-4], approximately more than 90% of the world VI people lived in the developing countries[2,5]. Inadequate or lack of available, affordable and good quality eye care services in the developing countries along with human resource scarcity might responsible for the high prevalence of VI and blindness in developing countries. Afghanistan is one of the leastdeveloped countries located in the EMR with worst health indicators and worst health system compared to the adjacent countries. The situation as whole in developing countries can be applied for the Afghanistan as well.
Table 4 Multivariate analysis of independent variables and low vision (Nangarhar-Afghanistan, 2015)
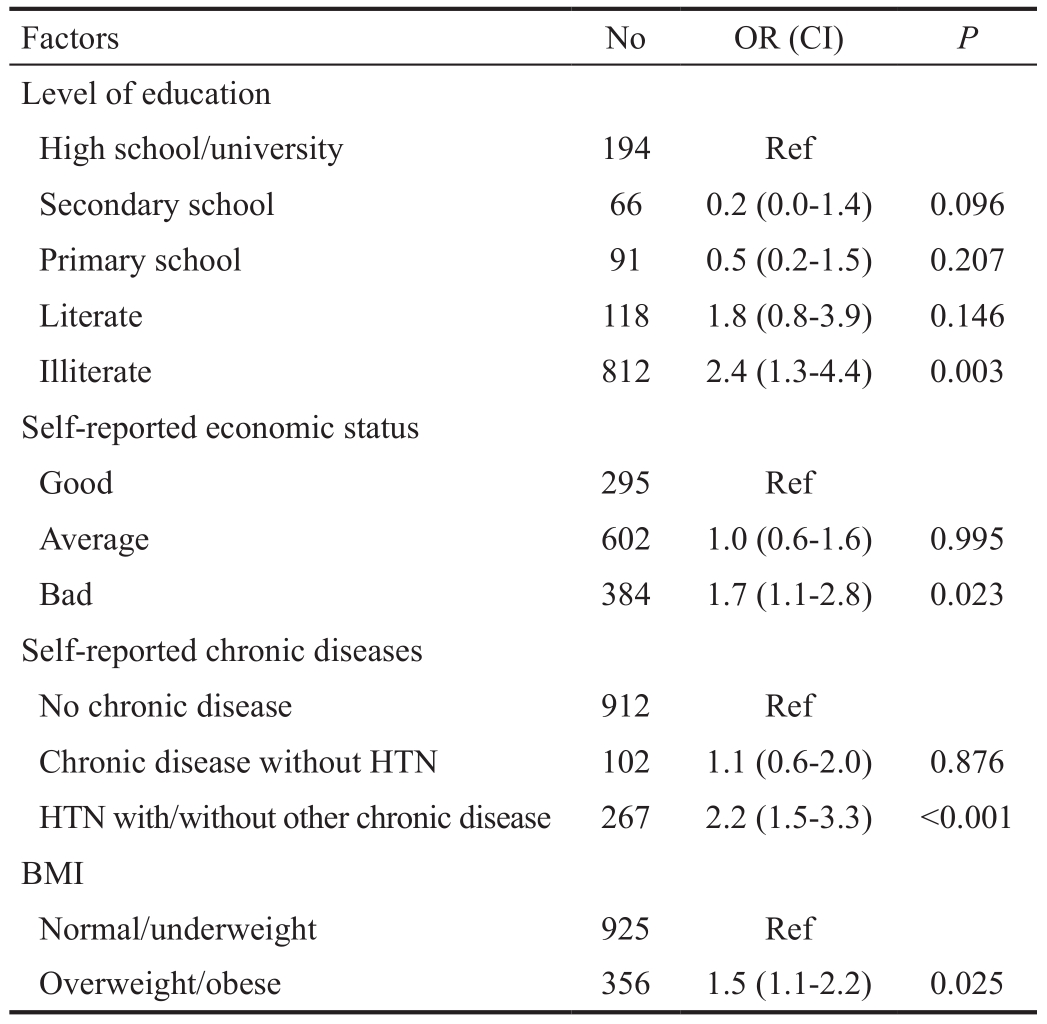
R square =0.066 (Cox and Snell), 0.115 (Nagelkerke), 0.045 (Hosmer and Lemeshow Test). Last step (9th); Backward: Conditional method.
?
Table 5 Multivariate analysis of independent variables and blindness (Nangarhar-Afghanistan, 2015)

R square =0.072 (Cox and Snell), 0.149 (Nagelkerke), 0.356 (Hosmer and Lemeshow Test). Last step (7th); Backward: Conditional method.
?
The ratio of LV and blindness (178/112) was almost 1.6 which is very low when it is compared with the world’s estimate(6.3)[31]and it is also very low compared with the regional estimates 2.4 to 5.8[4]. This low ratio might be due to the higher number of blindness which indicates either insuf ficiency or not affordability of eye care services in the region. Afghanistan is one of the EMR countries with the worst figures regarding the human resource for eye care; one ophthalmologist per 332 255.8 persons was estimated in 2006[32]. According to a survey, which was conducted in Afghanistan in 2007, the ophthalmologist per person ratio was one ophthalmologist per 200 000 person[33]indicative of the worst situation in terms of eye care services provision in Afghanistan.
The most common three causes of the VI were cataract(52.8%), URE (26.9%) and glaucoma (8.6%). According to WHO report, the first three global causes of VI and blindness are URE (42%) cataract (33%) and glaucoma (2%)[2]. In the year 2002, common causes of VI for developing countries were estimated as cataract at the top with 47.9%, followed by glaucoma (12.3%), AMD (8.7%), CO (5.1%), DR(4.8%), childhood blindness (3.9%), trachoma (3.6%) and onchocerciasis (0.8%)[34]. A Polish study illustrated completely different pattern for main causes of VI than developing countries: AMD (18.2%) was the leading cause followed by cataract and amblyopia[35]. According to the results of a study performed on older people in the United States of America,cataract was the leading cause of bilateral VI accounting for 42%, followed by AMD (20%), DR (12%)[36]. In the Scandinavian countries, the major cause of VI was cataract(35.9%), AMD (32.0%), and DR (9.7%)[37]. In this study,the main cause’s pattern of VI is approximately follows the patterns in developing countries.
In multivariate analysis, it was found that illiteracy, selfreported economic status, self-reported HTN, and overweight/obesity was independently associated with VI.
Tehran Eye Study also indicated that compared to college graduated participants, illiterate have 13 times higher risk of being visual impaired (OR=13.1. 95%CI, 5.1 to 33.6)[38].Educated people might have higher level of health literacy,more knowledge about eye care services’ locations and providers (government, charitable and private) along with more knowledge about preventability and curability of the major blinding disorders. As level of education, working and economic status are having interaction with each other,they might collectively have association with unequal distribution of VI among participants with various level of education. Furthermore, distribution of VI among people with different level of education might be related to the quality of public health services and lack of or limited availability of eye care services among population. Government policy is another factor, which could have an effect on distribution of VI among people with various levels of education. For example, preventive and curative services related to eye have not been integrated with primary health care in practice, yet.Therefore, eye care services are limited only to the provincial capital, Jalalabad City and access to the services is not too easy for the illiterate and economically disadvantaged people who reside in the remote rural areas. In the current study,prevalence of VI was 58.0% higher among self-reported bad economic status compared to good (OR=1.58, 95%CI, 1.1-2.3,P=0.017). While provision of health services including eye care, is the responsibility of the government and free of cost in Afghanistan[39], economic status has been observed to have link with the access of the health services[40]. The study conducted in Iran supported the results of the current study that the prevalence of VI was higher among people with poor economic status[41]. Another study conducted in South Africa also confirmed the results of this study, that the prevalence of VI was higher among people with low socio-economic status[42].
A Meta-analysis has shown that the risk of VI was 30.0%higher among hypertensives than non-hypertensives (OR=1.3,95%CI, 1.0-1.7)[43]. Likewise, it was found that in self-reported hypertensive participants, prevalence of VI was higher by 2.6-fold (OR=2.6, 95%CI, 1.9-3.5) than no chronic disease in this study. Association of HTN and the major blinding eye diseases have been observed in some studies; HTN and cataract[44-45],HTN and glaucoma[46-47], HTN and AMD[48], HTN and retinopathy[49], and HTN and DR[50-51]. Thus, in the current study, relation of HTN with VI might be due to positive and strong association of HTN with four common causes of VI.
Being overweight/obese was another independent associated factor for VI. In overweight/obese participants compared to participants with normal/underweight, the prevalence of VI was 40.0% higher (OR=1.4, 95%CI, 1.0-1.9,P=0.024). Due to association of obesity with cataract, glaucoma, AMD, DR and retinal artery occlusion[52-57], it is accounted as a strong associated factor of VI and blindness. However, there are some studies that found no association or even negative association with VI[58-59].
In multivariate analysis of LV, likewise the VI, illiteracy,self-reported economic status, self-reported HTN and being overweight were independently associated with LV. The model retained the same variables as in the VI model; however, the coefficients of the variables, CI and levels of significances were a little different.
Third model, which was built by multivariate analysis of the blindness and its explanatory variables, indicated that in addition to the variables signi ficantly associated with VI, age and using of sunglasses for eye protection were also associated with blindness. Age, illiteracy, self-reported economic status,self-reported HTN and sunglass use for protection were found to be independently associated with the high prevalence of blindness in the study. Compared to 50-54y age group, among 55-59 years old participants, the prevalence of blindness was almost 2 folds higher, among 60-64 years old it was also 2 folds higher and among 65 years old and over participants,more than two and a half folds higher. Age is one of the reknown non-modifiable risk factors for blindness and VI. In global scale, almost 32 million out of 39 million blindness occurred among people aged 50y and older[2]. The result of current study is in consistency with some other studies held in the developed as well as developing countries[12,60-63]. Among illiterates, compared to high school/university graduates, the prevalence of blindness was 61% higher, and among bad selfreported economic status, compared to good, it was 40%.However, the signi ficance of association of illiteracy and selfreported bad economic status was masked in the last model of blindness. Among self-reported hypertensives compared to no chronic disease, the prevalence of blindness was 2.8 times higher. Association of HTN with major blinding diseases such as cataract[44-45], glaucoma[46,64], AMD[55-57], retinopathy[49]and DR[50-51]have been reported and by this way the prevalence of blindness was found higher among participants with selfreported hypertension. Among non-users of sunglass as an eye protection, the prevalence is 4.9 times higher than users. Prevention and delaying of cataract formation by using sunglasses and other measures to protect the eye from ultraviolet B exposure has been confirmed[65]. A case control study conducted in Australia indicated that sunglass reduced the risk of cataract among occupational exposure to sun by 3-fold (OR=3.00; 95%CI, 1.23-7.12)[66]. In the current study,the proportion of sunglass users was very less at 11.2%, while more than 65% of the participants spent 7h or more of their day time outdoor in the work site. Exposure to ultraviolet rays and increasing the risk of blindness due to cataract was supported by The Beaver Dam Eye Study showed that the risk of cataract was increased by 36% (OR=1.36; 95%CI, 1.02-1.79) among the participants who spent more time outdoors[67]. The result of“A Review of the Epidemiologic Evidence Linking Ultraviolet Radiation and Cataracts” and a study conducted in the US was indicated the association of ultraviolet rays and cataract[68-69].
Since this was a cross-sectional study, the causal association between sociodemographic factors and outcome variables were not clear, whether the sociodemographic differences are the causes or the consequences. On the other hand, the study was based on mostly self-reported cross-sectional data, thus the study is in some extend subjected to recall bias. Moreover,as the study was conducted in Jalalabad City and four surrounding districts because of limited resources and security issues, the application of the results is confined to the study area only.
In conclusion, the results indicated difference between VI, blindness and normal subjects in terms of some sociodemographic factors. Illiteracy, poor economic status,having hypertension, and being overweight were associated with VI, and advanced age, illiteracy, poor economic status,being hypertensive and use of sunglasses for eye protection were associated with blindness. Based on the evidences obtained from this study, making eye health services accessible to older and economically deprived people at affordable cost in the area, increasing awareness regarding the factors threaten eye site by delivering eye health education in the area and applying primary prevention measures regarding the hypertension and overweight are recommended.
The authors thank to Israrullah Shinwari, Bahawodin Babakarkhil, Hayatullah Saleh, Elhamuddin Salarzai,Hameedulhaq Babakarkhil and Ra fiullah Behsodi staff at the Nangarhar University Hospital Ophthalmology Department,Nangarhar Regional Hospital Ophthalmology Department and Fred Hallows Foundation for their contributions on the data collection process.
Authors’ contributions:Both authors equally contributed from the planning stage to the analysis and preparing the manuscript. The data of the study was collected under the supervision of Dr. Mohammad Haris Abdianwall.
Conflicts of Interest:Abdianwall MH,None;Güçiz Doğan B,None.
1 Shahriari HA, Izadi S, Rouhani MR, Ghasemzadeh F, Maleki AR.Prevalence and causes of visual impairment and blindness in Sistanva-Baluchestan Province, Iran: Zahedan Eye Study.Br J Ophthalmol2007;91(5):579-584.
2 World Health Organization. GLOBAL DATA ON VISUAL IMPAIRMENTS 2010. Available at: http://www.who.int/blindness/GLOBALDATAFINAL forweb.pdf?ua=1. Accessed on 01.02. 2015.
3 World Health Organization. Blindness: Vision 2020 - The Global Initiative for the Elimination of Avoidable Blindness. Action plan 2006-2011.2015. Available at: http://www.who.int/mediacentre/factsheets/fs213/en/.Accessed on 01.02.2015.
4 Resnikoff S, Pascolini D, Etya’ale D, Kocur I, Pararajasegaram R,Pokharel GP, Mariotti SP. Global data on visual impairment in the year 2002.Bull World Health Organ2004;82(11):844-851.
5 West S, Sommer A. Prevention of blindness and priorities for the future.Bull World Health Organ2001;79(3):244-248.
6 World Health organization. Socio economic aspects of blindness and visual impairment: World Health organization; 2017. Available at: http://www.who.int/blindness/economy/en/. Accessed on 15.02.2017.
7 Gordois A, Pezzullo L, Cutler H.The Global Economic Cost of Visual Impairment. Australia, 2010. http://www.icoph.org/dynamic/attachments/resources/globalcostofvi_ finalreport.pdf. Accessed on 25.03.2015.
8 World Health Organization.The Global Burden of Disease: 2004 Update. World Health Organization, 2008 Available at: http://www.who.int/healthinfo/global_burden_disease/2004_report_update/en/. Accessed on 19.02.2017.
9 Hassell JB, Lamoureux EL, Keeffe JE. Impact of age related macular degeneration on quality of life.Br J Ophthalmol2006;90(5):593-596.
10 Khorrami-Nejad M, Sarabandi A, Akbari MR, Askarizadeh F. The impact of visual impairment on quality of life.Med Hypothesis Discov Innov Ophthalmol2016;5(3):96-103.
11 Siantar RG, Cheng CY, Gemmy Cheung CM, Lamoureux EL, Ong PG, Chow KY, Mitchell P, Aung T, Wong TY, Cheung CY. Impact of visual impairment and eye diseases on mortality: the singapore malay eye study (SiMES).Sci Rep2015;5:16304.
12 Jadoon MZ, Dineen B, Bourne RRA, Shah SP, Khan MA, Johnson GJ,Gilbert CE, Khan MD. Prevalence of blindness and visual impairment in pakistan: the pakistan national blindness and visual impairment survey.Invest Ophthalmol Vis Sci2006;47(11):4749-4755.
13 Soori H., Ali JM, Nasrin R. Prevalence and causes of low vision and blindness in Tehran Province, Iran.J Pak Med Assoc2011;61(6):544-549.
14 Huang S, Zheng Y, Foster PJ, Huang W, He M; Liwan Eye Study.Prevalence and causes of visual impairment in Chinese adults in urban southern China.Arch Ophthalmol2009;127(10):1362-1367.
15 Afghanistan Central Statics Organization (CSO).Estimated Settled Population by Civil Division, Urban, Rural and Sex 2014 - 2015Available at: http://cso.gov.af/en/page/demography-and-socile-statistics/demographstatistics/3897. Accessed on 21.02.2015.
16 WHO.International Statistical Classi fication of Diseases and Related Health Problems.2012. Available at: https://www.cihi.ca/en/icd_volume_one_2012_en.pdf. Accessed on 11.10. 2016.
17 World Health Organization.Global Database on Body Mass Index 2017.Available at: http://apps.who.int/bmi/index.jsp?introPage=intro_3.html.Accessed on 19.11.2017.
18 International Center for Eye Health.RAAB intstructional manual-A package for entry and analysis of data from population based Rapid Assessments of Avoidable Blindness2007. Available at: https://www.bicomalawi.org/manuals/_RAAB_instruction_manual.pdf. Accessed on 15.01.2018.
19 Mundi Index.Afghanistan Demographics Profile 2017Available at:http://www.indexmundi.com/afghanistan/demographics_profile.html.Accessed on 22.03.2017.
20 Central Statistics Organization.Afghanistan Living Conditions Survey (ALCS)- Central Statistics Organization 2011-2012. Available at: http://cso.gov.af/en/page/1500/1494/nrav-report. Accessed on 23.03.2017.
21 Kristina C. 10 Countries With The Worst Literacy Rates In The World | Care2 2013, updated 2013/09/08/. Available at: http://www.care2.com/causes/10-countries-with-the-worst-literacy-rates-in-the-world.html.Accessed on 23.03.2017.
22 Archivist Online Pakistan. Literacy rate of education of Pakistan 2016. [Internet] 2015/02/19/T13:20:09+00:00. Available at: http://www.archivistonline.pk/literacy-rate-in-pakistan/. Accessed on 20.02.2017.
23 United Nations Educational Scientific, and Cultural Organization.General information. Islamic Republic of Iran. UNESCO 2014. Available at: https://en.unesco.org/countries/iran-islamic-republic. Accessed on 23.03.2017.
24 United Nations Educational Scientific, and Cultural Organization.General information. Uzbekistan 2014. Updated 2014/11/04/T13:58:37+00:00. Available at: http://en.unesco.org/countries/uzbekistan.Accessed on 23.03.2017.
25 WorldAtlas. 25 Countries With The Highest Literacy Rates.WorldAtlas 2018. Available at: https://www.worldatlas.com/articles/thehighest-literacy-rates-in-the-world.html. Accessed on 23.03.2017.
26 Li Z, Cui H, Liu P, Zhang L, Yang H, Zhang L. Prevalence and causes of blindness and visual impairment among the elderly in rural southern Harbin, China.Ophthalmic Epidemiol2008;15(5):334-338.
27 Wu M, Yip JLY, Kuper H. Rapid assessment of avoidable blindness in Kunming, China.Ophthalmology2008;115(6):969-974.
28 Zhao JL, Ellwein LB, Cui H, Ge J, Guan HJ, Lv J, Ma XZ, Yin JL, Yin ZQ, Yuan YS, Liu H. Prevalence of vision impairment in older adults in rural China.Ophthalmology2010;117(3):409-416.e1.
29 Zhu RR, Shi J, Yang M, Guan HJ. Prevalences and causes of vision impairment in elderly Chinese: a socioeconomic perspective of a comparative report nested in Jiangsu Eye Study.Int J Ophthalmol2016;9(7):1051-1056.
30 Gogate P, Vora S, Ainapure S, Hingane R, Kulkarni A, Shammanna B,Patil S. Prevalence, causes of blindness, visual impairment and cataract surgical services in Sindhudurg district on the western coastal strip of India.Indian J Ophthalmol2014;62(2):240-245.
31 Pascolini D, Mariotti SP. Global estimates of visual impairment: 2010.Br J Ophthalmol2012;96(5):614-618.
32 Pakistan Institute of Community Ophthalmology.Global Human Resource Development Assessment for Comprehensive Eye Care. 2006.Available at: https://www.iapb.org/wp-content/uploads/Global-HRDevelopment-Assessment-for-Comprehensive-Eye-Care_2006.pdf.Accessed on 23.11.2015.
33 Husainzada R. Situation analysis of human resources in eye care in Afghanistan.Community Eye Health2007;20(61):12.
34 World Health Oraganization.Causes of Blindness and Visual Impairment 2017[Nov 23, 2017]. Available at: http://www.who.int/blindness/causes/en/. Accessed on 23.11.2017.
35 Nowak MS, Smigielski J. The prevalence and causes of visual impairment and blindness among older adults in the city of Lodz, Poland.Medicine2015;94(5):e505.
36 Muñoz B, West SK, Rubin GS, Schein OD, Quigley HA, Bressler SB, Bandeen-Roche K. Causes of blindness and visual impairment in a population of older Americans: The Salisbury Eye Evaluation Study.Arch Ophthalmol2000;118(6):819-825.
37 Buch H, Vinding T, La Cour M, Appleyard M, Jensen GB, Vesti Nielsen N. Prevalence and causes of visual impairment and blindness among 9980 Scandinavian adults.Ophthalmology2004;111(1):53-61.
38 Fotouhi A. The prevalence and causes of visual impairment in Tehran:the Tehran Eye Study.Br J Ophthalmol2004;88(6):740-745.
39 Islamic republic of Afghanistan Ministry of Justice.The Constitution of Afghanistan.Available at: http://moj.gov.af/en/page/1684. Accessed on 20.04.2015.
40 Harris B, Goudge J, Ataguba JE, McIntyre D, Nxumalo N, Jikwana S,Chersich M. Inequities in access to health care in South Africa.J Public Health Policy2011;32 Suppl 1:S102-123.
41 Katibeh M, Rajavi Z, Yaseri M, Hosseini S, Akbarian S, Sehat M.Association of socio-economic status and visual impairment: a populationbased study in Iran.Arch Iran Med2017;20(1):43-48.
42 Cockburn N, Steven D, Lecuona K, Joubert F, Rogers G, Cook C,Polack S. Prevalence, causes and socio-economic determinants of vision loss in cape town, south africa.PLoS One2012;7(2):e30718.
43 Dinuzzo AR, Black SA, Lichtenstein MJ, Markides KS. Prevalance of functional blindness, visual impairment, and related functional de ficits among elderly mexican americans.J Gerontol A: Biol Sci Med Sci2001;56(9):M548-M551.
44 Yu XN, Lyu DN, Dong XR, He JL, Yao K. Hypertension and risk of cataract: a meta-analysis.PLoS One2014;9(12):e114012.
45 Mehta R, Patil M, Page S. Comparative study of cataract in hypertensive patients and non-hypertensive patients.Indian Journal of Clinical and Experimental Ophthalmology2016;2(2):153.
46 Bae HW, Lee N, Lee HS, Hong SM, Seong GJ, Kim CY. Systemic hypertension as a risk factor for open-angle glaucoma: a meta-analysis of population-based studies.PLoS One2014;9(9):e108226.
47 Zarei R, Ghasemi H, Jamshidi S,et al. The association of primary open angle glaucoma and systemic hypertension in patients referred to Farabi Eye Hospital.Iran J Ophthalmol2011;23(2):31-34.
48 Miyazaki M, Nakamura H, Kubo M, Kiyohara Y, Oshima Y, Ishibashi T, Nose Y. Risk factors for age related maculopathy in a Japanese population: the Hisayama Study.Br J Ophthalmol2003;87(4):469-472.
49 Bhargava M, Ikram MK, Wong TY. How does hypertension affect your eyes?J Hum Hypertens2012;26(2):71-83.
50 Wat N, Wong RL, Wong IY. Associations between diabetic retinopathy and systemic risk factors.Hong Kong Med J2016;22(6):589-599.
51 Srivastava BK, Rema M. Does hypertension play a role in diabetic retinopathy?J Assoc Physicians India2005;53:803-808.
52 Howard KP, Klein BE, Lee KE, Klein R. Measures of body shape and adiposity as related to incidence of age-related eye diseases:observations from the Beaver Dam Eye Study.Invest Ophthalmol Vis Sci2014;55(4):2592-2598.
53 Wu SY, Leske MC. Associations with intraocular pressure in the Barbados Eye Study.Arch Ophthalmol1997;115(12):1572-1576.
54 Delcourt C, Michel F, Colvez A, Lacroux A, Delage M, Vernet MH,POLA Study Group. Associations of cardiovascular disease and its risk factors with age-related macular degeneration: the POLA study.Ophthalmic Epidemiol2001;8(4):237-249.
55 Schaumberg DA. Body mass index and the incidence of visually significant age-related maculopathy in men.Arch Ophthalmol2001;119(9):1259-1264.
56 van Leiden HA, Dekker JM, Moll AC, Nijpels G, Heine RJ, Bouter LM, Stehouwer CDA, Polak BCP. Blood pressure, lipids, and obesity are associated with retinopathy: the hoorn study.Diabetes Care2002;25(8):1320-1325.
57 Wong T, Larsen E, Klein R, Mitchell P, Couper D, Klein B, Hubbard L, Siscovick D, Sharrett A. Cardiovascular risk factors for retinal vein occlusion and arteriolar EmboliThe atherosclerosis risk in communities & cardiovascular health studies.Ophthalmology2005;112(4):540-547.
58 Yang F, Yang CM, Liu YZ, Peng SZ, Liu B, Gao XD, Tan XD.Associations between body mass index and visual impairment of school students in central China.Int J Environ Res Public Health2016;13(10).
59 Ernest-Nwoke IO, Ozor MO, Akpamu U, Oyakhire MO. Relationship between body mass index, blood pressure, and visual acuity in residents of esan west local government area of edo state, nigeria.Physiology Journal2014;2014:1-5.
60 Guo C, Wang ZJ, He P, Chen G, Zheng XY. Prevalence, causes and social factors of visual impairment among Chinese adults: based on a national survey.Int J Environ Res Public Health2017;14(9):1034.
61 Hu JY, Yan L, Chen YD, Du XH, Li TT, Liu DA, Xu DH, Huang YM,Wu Q. Population-based survey of prevalence, causes, and risk factors for blindness and visual impairment in an aging Chinese metropolitan population.Int J Ophthalmol2017;10(1):140-147.
62 Hashemi H, Khabazkhoob M, Saatchi M, Ostadimoghaddam H,Yekta A. Visual impairment and blindness in a population-based study of Mashhad, Iran.J Curr Ophthalmol2018;30(2):161-168.
63 Varma R, Vajaranant TS, Burkemper B, Wu S, Torres M, Hsu C,Choudhury F, McKean-Cowdin R. Visual impairment and blindness in adults in the United States: demographic and geographic variations from 2015 to 2050.JAMA Ophthalmol2016;134(7):802-809.
64 Langman MJ, Lancashire RJ, Cheng KK, Stewart PM. Systemic hypertension and glaucoma: mechanisms in common and co-occurrence.Br J Ophthalmol2005;89(8):960-963.
65 Roberts JE. Ultraviolet radiation as a risk factor for cataract and macular degeneration.Eye Contact Lens2011;37(4):246-249.
66 Neale RE, Purdie JL, Hirst LW, Green AC. Sun exposure as a risk factor for nuclear cataract.Epidemiology2003;14(6):707-712.
67 Cruickshanks KJ, Klein BE, Klein R. Ultraviolet light exposure and lens opacities: the Beaver Dam Eye Study.Am J Public Health1992;82(12):1658-1662.
68 West SK, Longstreth JD, Munoz BE, Pitcher HM, Duncan DD. Model of risk of cortical cataract in the US population with exposure to increased ultraviolet radiation due to stratospheric ozone depletion.Am J Epidemiol2005;162(11):1080-1088.
69 McCarty CA, Taylor HR. A review of the epidemiologic evidence linking ultraviolet radiation and cataracts.Dev Ophthalmol2002;35:21-31.