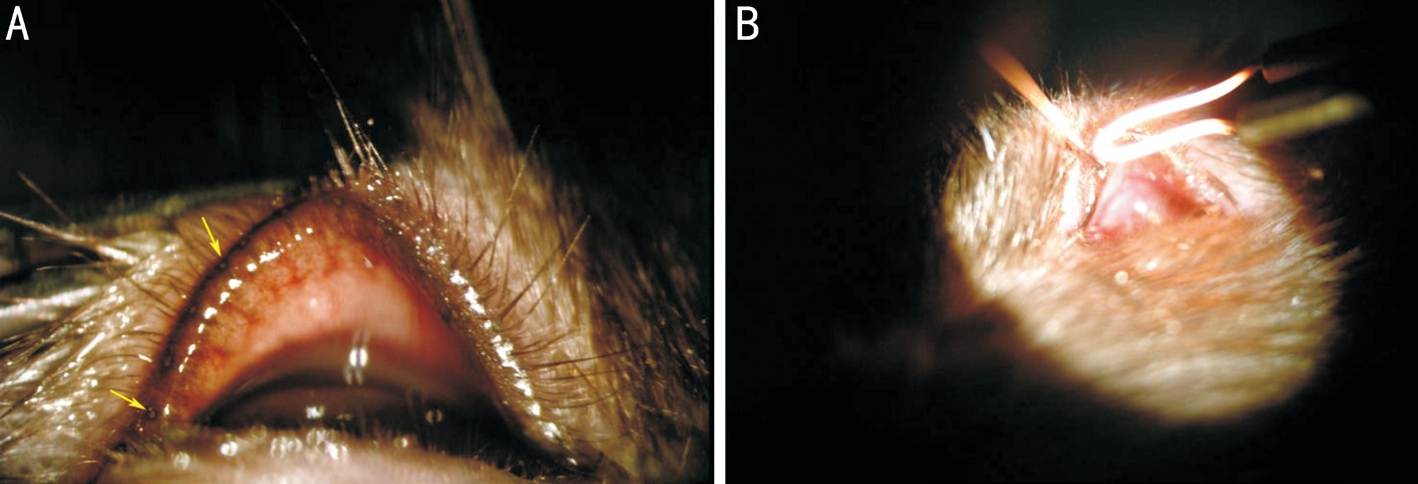
Figure 1 Model preparation A: Meibomian gland orifices of BN rats were observed clearly by slit-lamp examination. Yellow arrows show the meibomian gland orifices; B: Wires were inserted into the orifices 1-2 mm and every guidewire was fulgurized.
·Basic Research·
Zi-Yi Dong1, Ming Ying2, Jie Zheng1, Lan-Jun Hu1, Jiang-Yan Xie1, Yi Ma1
1Department of Ophthalmology, Tianjin Union Medical Center,Tianjin 300121, China
2Tianjin Eye Hospital, Tianjin Eye Institute, Tianjin Key Lab of Ophthalmology and Visual Science, Tianjin 300020, China
M eibomian gland dysfunction (MGD) is a lead cause of dry eye syndrome. MGD has drawn increasing attention as the incidence of dry eye has increased considerably in the past few years[1-2]. However, in spite of the need for research of MGD, methods for producing MGD animal models are still controversial. Gibard et al[3]reported that an MGD rabbit model induced by meibomian gland orifice fulgurization is feasible; they occluded the opening by cauterization so that meibomian gland lipids could not be discharged. Since the lipids could not attach to the eyeball surface to form the tearfilm lipid layer, it produced dry eye because the tear film was easily ruptured. The success rate of the experiment was high,and obvious and stable dry eye manifested in the sixth week after surgery. However, in dry eye research, especially for the basic study of inflammation or immunity, rats and mice have more available antibodies than rabbits as experimental animals[4]. Therefore, we chose rats as the experimental animals in this research. We hypothesized that meibomian gland orifice electrocauterization could successfully establish a rat MGD model.
Experimental SubjectsAll procedures involving rats in this study were approved by Tianjin Union Medical Center Medical Ethics Committee, and were in accordance with the guidelines of the Association for Research in Vision and Ophthalmology(ARVO) Statement for the Use of Animals in Ophthalmic and Vision Research. Twelve 8-week-old Brown Norway (BN) rats(male, body weight: 175-200 g; Vital River Laboratory Animal Technology Corp., Beijing, CHN) were used for the experiments.We excluded rats that had an ocular surface disease, such as blepharomorphic abnormalities, keratitis, conjunctivitis, or dry eye syndrome (determined by slit-lamp examination).
Figure 1 Model preparation A: Meibomian gland orifices of BN rats were observed clearly by slit-lamp examination. Yellow arrows show the meibomian gland orifices; B: Wires were inserted into the orifices 1-2 mm and every guidewire was fulgurized.
Model preparationAll of the rats were housed kept at 24℃±2℃, in a relatively humid environment (50%), with alternating 12-12-h light/dark cycles. We administered levofloxacineye drops (santen Corp., Higashiyodogawa-Ku,Osaka, JPN) to all of the rats’ eyes to prevent infection at 3d pre-operation, 3 times per day, 1 drop each time. The 12 rats were divided into model groups (left eye) and control groups(right eye), and 10% chloral hydrate (JIMEI Corp., Beijing,CHN) 0.3 mL/100 g was adminstered by intraperitoneal injection to all the rats. The rats were fixed on the platform after successfully administering anesthesia. We located meibomian gland orifices using a slit lamp (SL-7F, TOPCON Corp., Itabashi-ku, Tokyo, JPN; Figure 1A), and then inserted slim mental guidewires (0.25 mm in diameter) 1-2 mm into the upper and lower meibomian gland orifices and fulgurized every guidewire for 0.1s to destroy part of the meibomian gland (Figure 1B). We administered ofloxacin oculentum(SinQi Corp., Shenyang, CHN) to all of the eyes at 3d postoperation, 3 times per day.
Data collectionWe examined the rats using the Schirmer I Test (SIT), tear breakup time (TBUT), and corneal fluorescein sodium staining scores, and observed any changes in the form of the eyelids and meibomian gland orifices at 1, 2, 4, and 6wk after the operations. All rats were killed by an overdose of anesthetics (10% chloral hydrate 1 mL/100 g was administered by intraperitoneal injection). We randomly selected 10 rats and then analyzed the results of real-time polymerase chain reaction(PCR) of epidermal growth factor (EGF), interleukin-6 (IL-6),IL-8, tumor necrosis factor-α (TNF-α) and Ki67 of the corneal,conjunctival, and meibomian tissues. We removed the eyeballs and eyelids from the remaining 2 rats, and after paraffin imbedding we observed the histomorphological changes by hematoxylin-eosin (H&E) staining and periodic acid-Schiff(PAS) staining.
Schirmer I testAccording to the test standard of Fujihara et al[5], a strip (Schirmer Tear Test Strips, Jingming new Technological Development Corp., Tianjin, CHN) was inserted into the outer one-third of the lower eyelid, and the rat was released on the table for 1min. The strip-wetting length was measured to an accuracy of 0.1 mm by a vernier caliper. The same examiners finished all of the tests at the same time (8:00-12:00 a.m.) in the same environment, room temperature,humidity, and light conditions.
Tear breakup timeWe inserted a fluorescein strip (Fluor Strip, Jingming New Technological Development Corp.,Tianjin, CHN) into the conjunctival sac of the rats for 1s,rubbed the eyelids for a moment, then observed the corneas using cobalt-blue light by a slim lamp. We started the timer after the rats blinked 3 times. The time of the first rupture of the black spot of the cornea is considered to be the TBUT. We tested the rats 3 times and calculated the average.
Fluorescein sodium staining scoreAfter TBUT examination,we observed the corneas using cabalt-blue light by a slim lamp,and then graded them. Based on the method of Koh et al[6], the scoring criteria were as follows. After dividing the cornea into four quadrants and scoring them respectively, the scores are added to the final score: 0 points, no stain; 1 point, dotted with dye ≤30; 2 points, dotted with dye >30 but not diffuse; 3 points,dots are serious but not fused; and 4 points, the dye is patchy.
Meibomian gland observationWe observed the morphological changes in the eyelid margin and meibomian gland orifices.
Immediately after the eyeballs and eyelids were resected,they were fixed in 4% paraformaldehyde (Leagen Corp.,Beijing, CHN) for 24h. Then, all specimens were prepared and selected under the guide of two pathological investigators who performed dehydration and clearing steps following our previous protocols. The paraffin tissues blocks were serially cut into 7-μm slices and put onto glass slides, and then dried at 65℃ for 2h. They were then dipped into xylene (ZSGBBIO Corp., Beijing, CHN) for 10min twice to remove paraf fin,then dipped in serial concentrations of ethanol (Yingda Rare Chemical Reagents Factory, Tianjin, CHN) to remove xylene(100%, 95%, 80% and 70% ethanol for 5min each). We stained the slides with hematoxylin (H&E Stain Kit; Solarbio,Beijing, CHN) for 5min, and then rinsed them with warm tap water for 3min to remove the hematoxylin. Then, we dipped them in eosin containing 0.01% HCL for 1min, and finally rinsed them with tap water for 10min. We mounted the slides with PermountTMmounting medium (ZSGB-BIO Corp.,Beijing, CHN) and covered them with cover-slides. Similarly,we performed PAS staining (Periodic Acid Schiff Stain Kit;Abcam, Cambridge, MA, USA) via the manufacturer’s protocols. Finally, we observed the pathological changes of the cornea, conjunctiva, and meibomian gland.
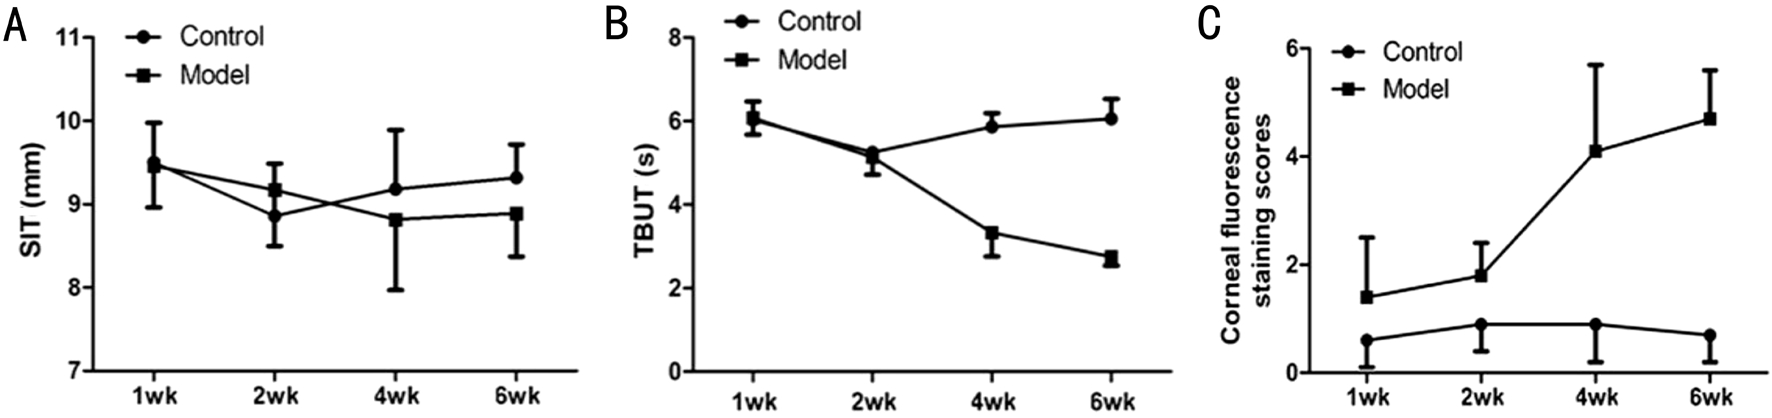
Figure 2 Comparison of SIT, TBUT, and corneal fluorescence staining scores in the model group with the control group along with the timeline A: SIT; B: TBUT; C: Corneal fluorescence staining scores.
Table 1 Comparison of SIT and TBUT data and corneal fluorescence staining scores mean±SD
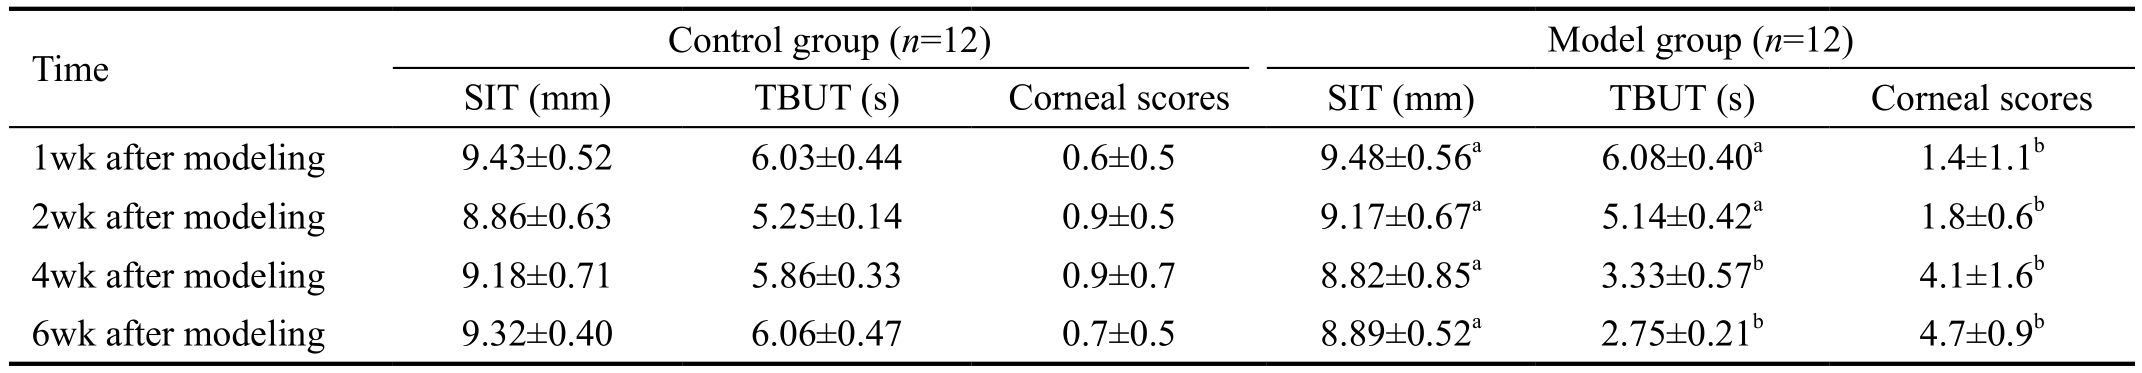
aP>0.05 vs the control group;bP<0.05 vs the control group. SIT: Schirmer I test; TBUT: Tear breakup time.
Real-time polymerase chain reactionTotal RNA was extracted from the corneal, conjunctival, and meibomian gland samples by TRIzol™ LS Reagent (Invitrogen, Carlsbad,CA, USA), and reverse transcribed into cDNA after the concentration was determined, and stored at -20℃. According to the published sequence in GenBank, Primer 5 was used to design primers, and GAPDH was chosen as the internal reference. All primers were synthesized by Sangon Biotech(Shanghai, CHN). EGF: forward 5’-TCGGTGCTGTGCGATTTA-3’,reverse 5’-TTTCTGGCAGTTCTCCTC-3’; IL-8: forward 5’-CCCCCATGGTTCAGAAGATTG-3’, reverse 5’-TTGTCAGAAGCCAGCGTTCAC- 3’; IL-6: forward 5’-CAGTTGCCTTCTTGGGACT-3’, reverse 5’-GCTCTGAATGACTCTGGCTT-3’; TNF-α: forward 5’-CACGTCGTAGCAAACCACCAA-3’, reverse 5’-GTTGGTTGTCTTTGAGATCCAT-3’; Ki67:forward 5’CTTTATGGCTGCTGGGTGCT-3’, reverse 5’GAGGTTGAAGCCGGACACAC-3’; GAPDH:forward 5’-GTGCCAGCCTCGTCTCATAG-3’, reverse 5’-CTTTGTCACAAGAGAAGGCAG-3’. The real-time PCR reaction conditions were as follows: SYBR premix Ex Taq I(Takara BIO, Kusatsu, Shiga, JPN) 10 μL, Rox (Takara BIO)0.4 μL, ddH2O (Tianjin Eye Hospital, Tianjin, CHN) 7.6 μL,forward primer 0.5 μL, reverse primer 0.5 μL, and cDNA 1 μL.The template was amplified with the following parameters in a StepOnePlus Real-time PCR System (Applied Biosystems Corp., Carlsbad, CA, USA): 95℃ pre-degeneration for 10min, then 45 cycles of 95℃ degeneration for 15s and 60℃annealing and extension for 1min. The PCR products were dissociated after amplification: 95℃ degeneration for 15s,60℃ annealing for 1min, then slow heating to 95℃ for 15s.The melting curve was analyzed to determine the specificity of the reaction. StepOnePlus Real-time PCR System software was used to collect the experimental data according to the compared threshold method (2-ΔΔCt) to analyze the relative quantitative change of gene expression.
Data and statistics processingStatistical results were analyzed using SPSS (Version 19.0; IBM, Armonk, New York,USA). The measurement data are expressed as mean±standard deviation (SD). Comparisons between the model and control groups were tested by paired t tests. Data that did not meet the normal distribution were tested by paired rank test. P<0.05 was considered to be statistically significant.
Schirmer I TestAfter preparing the model, tear secretion showed no obvious change during the experiment, and the model group had no statistical differences compared with the control group (P>0.05, respectively) (Table 1; Figure 2A).
Tear Breakup TimeTBUT had no obvious change in the first and second week, and the model group had no statistical differences compared with the control group (first week,P>0.05; second week, P>0.05). In the fourth week, the TBUT of the model group began to decrease significantly, compared with the control group (P<0.05). Then, TBUT continuously and significantly decreased until the sixth week (P<0.05)(Table 1; Figure 2B).
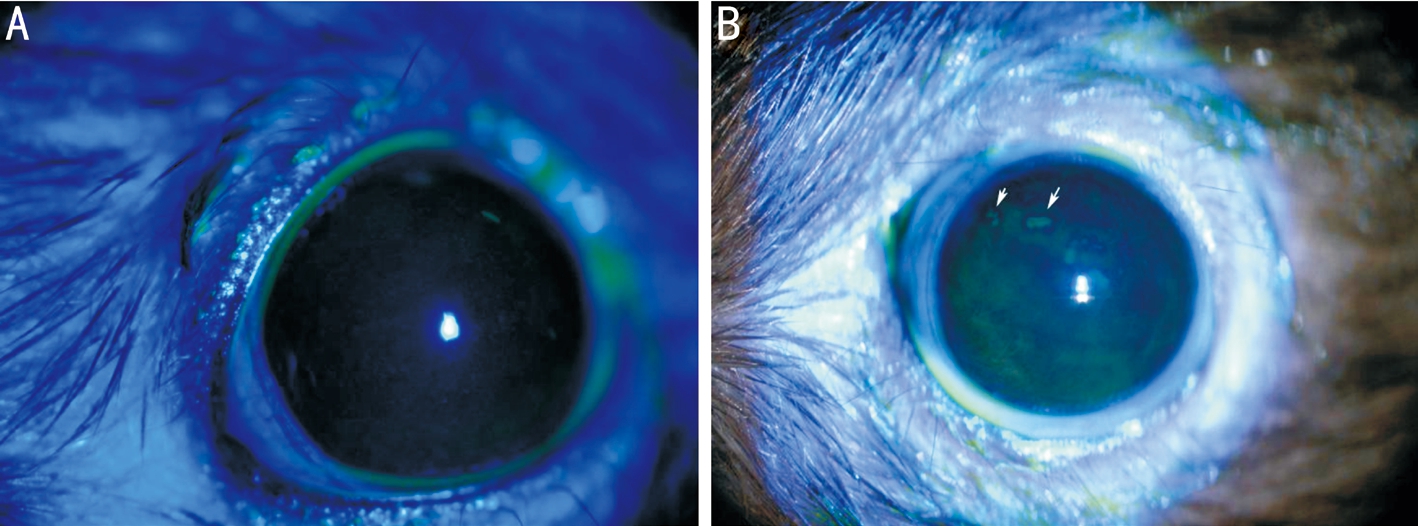
Figure 3 Corneal fluorescein sodium staining A: Corneal epithelium was smooth and not stained with fluorescence in the control group; B:Model group TBUT was significantly shorter than the control group and clearly stained; white arrows show the dye is patchy at the sixth week.
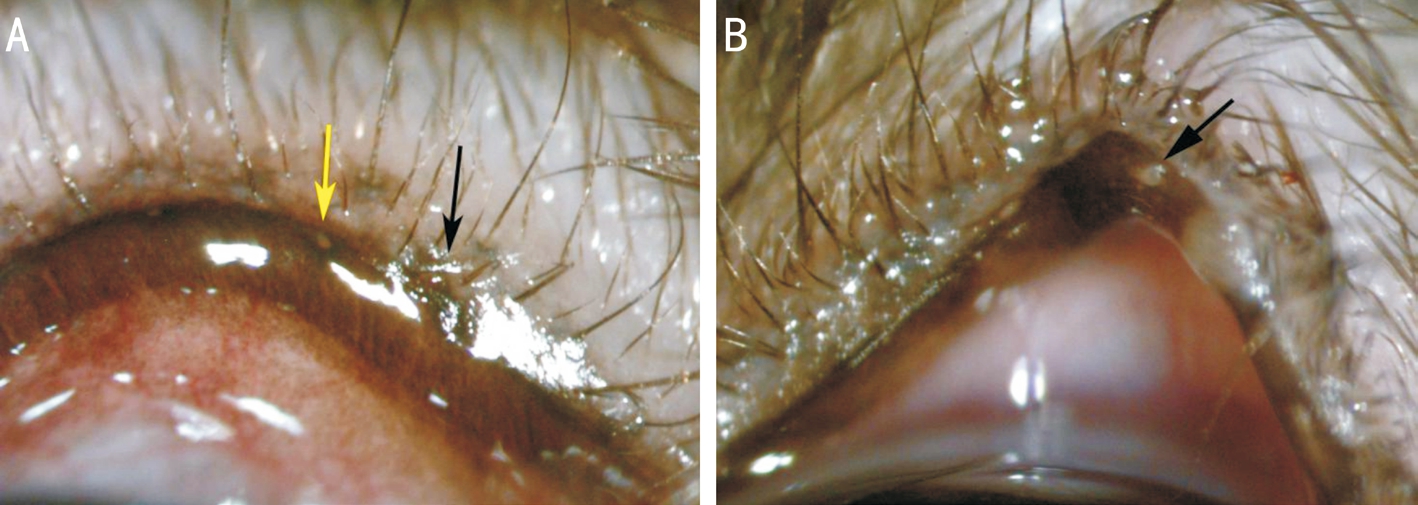
Figure 4 Morphological changes in the eyelid margin by slit-lamp observation A: Meibomian gland orifices were blocked after generating the model (black arrows). The wound was confined to the orifices. Yellow arrows show the meibomian gland orifices before generating the model; B: Black arrows show meibomian gland openings with hoary secretions blocked at the fourth week.
Corneal Fluorescence Staining and ScoresThe corneal epithelium was smooth in the control group, and it was occasionally independently dotted with dye after sodium fluorescein staining; not all of the members of the control group saw a diffuse dotting with dye (Figure 3A). The number of corneal epithelium samples with dotted staining in the model group was significantly increased in the first week, and it was rough, but no obvious fusion was seen. The scores in the model group were significantly higher than in the control group (P<0.05). There was a significant increase of dot dyeing in the second week (P<0.05). Corneal dots were significantly increased in the fourth week, and fusion began to appear. The local performance of the cornea in the sixth week was approximately the same as the fourth week(fourth week, P<0.05; sixth week, P<0.05), and the difference was statistically significant (Table 1, Figures 2C, 3B). The fluorescein stain of the cornea was diffuse and did not touch the eyelid margin scar formed from the electrocauterization.
Meibomian Gland ObservationMeibomian gland orifices were destroyed immediately after electrocauterization.Blepharons experienced hyperemia, and partial eyelid tissues showed signs of edema (Figure 4A). The blepharoedema was alleviated in the first week after establishing the model. Eyelid marginal hyperemia was less than before, and partial palpebral margins could be seen with hyperplasia in the second week. In the fourth week, partial meibomian gland openings had hoary secretions blocked with orifice expansion and partial convex deformation, the palpebral margin could be seen with extensive blood vessels, and the partial blepharopia became thickened(Figure 4B). The condition in the sixth week was similar to that of the fourth week.
Hematoxylin-eosin and Periodic Acid-Schiff StainingH&E staining showed that the corneal epithelium cells in the control group were normal, regularly arranged, and the epithelial layer was intact. The basal cells were closely and orderly aligned(Figure 5A). In the model group, the corneal epithelial layer was thickened and the epithelial cells were irregular. The epithelium was detached and rough in the sixth week. There was focal epithelial squamous metaplasia with layer separation.The basal cell sizes were increased. The normal orientation was lost, and there was some nuclear pycnosis (Figure 5B).
PAS staining showed that in the model group, the number of conjunctival goblet cells was decreased in the sixth week, and the cell body atrophy and the size were decreased compared with the control group (Figure 5C, 5D).
The meibomian gland is a specially differentiated sebaceous tubular gland. In the model group, the meibomian glands were mostly destroyed. Few normal glandular tissues remained,and had squamous metaplasia. Main duct dilatations were severe and accompanied by inflammation. The walls of the gland ducts thickened and were accompanied by fibrosis(Figure 5E, 5F).
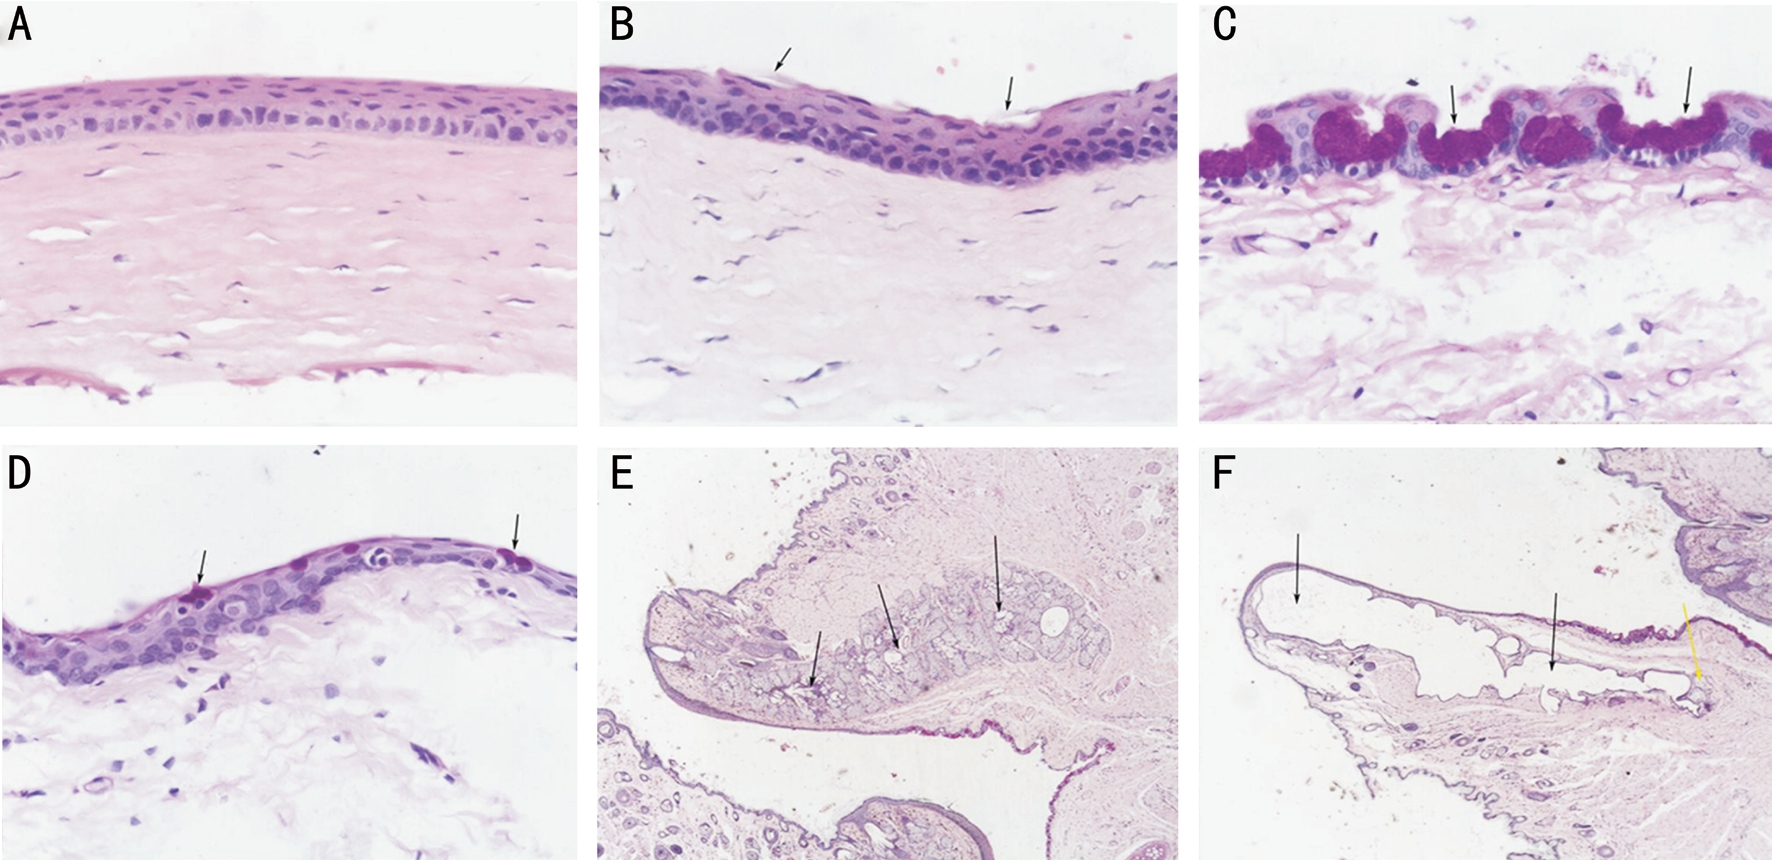
Figure 5 H&E and PAS staining A: Epithelium was intact in the control group (×200); B: Black arrows show the epithelium was detached in the model group (×200); C: Black arrows show the conjunctival goblet cells in the control group (×200); D: Black arrows show the conjunctival goblet cells were significantly fewer than in the control group (×200); E: Black arrows show normal gland tissues (×20); F: Black arrows show that the meibomian glands were mostly destroyed. The yellow arrow shows residual gland tissues (×20).
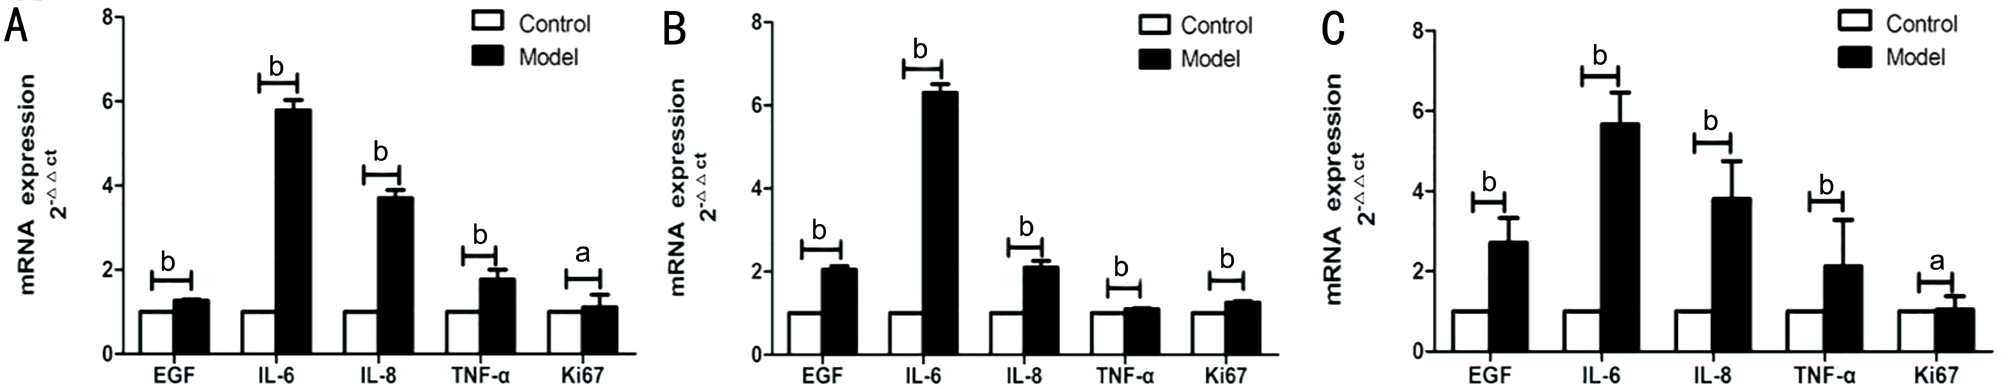
Figure 6 Comparison of EGF, IL-6, IL-8, TNF-α, and Ki67 mRNAs expression in the model and control groups A: Corneal tissue; B:Meibomian tissue; C: Conjunctival tissue.aP>0.05;bP<0.05.
Real-time Polymerase Chain ReactionThe melting curves of all primers showed only single peaks, indicating that the reaction was specific. In the corneal tissue, the relative quantitative expressions of EGF, IL-6, IL-8, and TNF-α mRNAs in the model group were significantly higher than those in the control group (P<0.05). Ki67 expression was not statistically different between groups (P>0.05; Figure 6A). In meibomian tissue, the relative quantitative expressions of EGF,IL-6, IL-8, TNF-α, and Ki67 mRNAs in the model group were significantly higher than those in the control group (P<0.05;Figure 6B). In conjunctival tissue, the relative quantitative expressions of EGF, IL-6, IL-8, and TNF-α mRNAs in the model group were significantly higher than those in the control group (P<0.05). Ki67 expression was not statistically different between groups (P>0.05; Figure 6C).
Dry eye syndrome is also known as keratoconjuctivitissicca.The International Dry Eye Workshop[7]defined it as a multifactorial disease caused by inflammation of the ocular surface and the instability of tear film in 2007. MGD is one of the main causes of dry eye, and it has become a popular topic in recent years with the increase in the incidence of dry eye.As basic research of MGD gradually increases, methods for producing an MGD animal model have become the primary problem. From the beginning of the 1980s, there have been many methods of producing animal models of aqueousdeficient dry eye, but producing a model of evaporative dry eye has been a problem that has puzzled ophthalmologists. In the early 1980s, Jester et al[8]proposed that epinephrine injected on the palpebral edge of rabbits to induce the keratinization of the meibomian gland catheter, thus obtaining the MGD model.This modeling method was later adopted by other scholars[9-10],but in recent years, researchers have come to suspect that if the keratinization of meibomian gland ducts is a fundamental cause of MDG[11-12]. However, it took six months or more for this method to produce a model, and the success rate was very low. Gene-deficient mice[13-18]can be used as an ideal model for the MGD animal; for example, mev-1 gene mutation mice,STGD3 mice, TSP-1-null mice, sod1-deficient mice, KLF5-deficient mice, and APOC1 transgenosis rats can all experience an abnormality of the meibomian gland function. However,the cost of the gene-deficient rat and the demanding feeding requirement has prevented researchers from using these animals.
Meibomian gland orifices are very tiny openings in humans and rabbits that can be observed clearly via slit-lamp examination at high magnification; this is performed so that surgey under bright light is executed efficiently. We determined that the meibomian gland orifices in albino rats (such as Sprague-Dawley rats) and mice are dif ficult to find and locate,while the meibomian gland orifices of rats with colored hair(such as BN rats) can be seen very clearly with a slit-lamp microscope. In this study, we inserted slender guidewires into meibomian gland orifices, and using electric guidewires, we damaged parts of the meibomian gland ducts and glands via guidewire transfer heat to prepare an MGD model. Using an accurate guidewire location prevented the wound surface from being too large, irreversible damage to the postoperative eyelid edge, and excessively long postoperative recovery time, all of which would in fluence observation of therapeutic effects.
After preparing the model, the meibomian gland openings were mildly expanded, parts of the openings were blocked by secreta, there was normal lacrimal gland function, TBUT was significantly shortened, the corneal epithelium became coarse and eroded, and there were dots and even patches.Because fluorescein stainings of the corneas were diffuse and did not touch the eyelid margin scar formed from the electrocauterization, we considered the epithelial defects to be the result of dry eye. This suggested that the model obtained in this study conformed to the clinical features[7]of tearhyperactive dry eye by MGD.
The etiology of MGD is very complicated; it is currently believed to be associated with in flammation[19], and hyperkeratinization or atrophy of the meibomian gland and catheters[8,11-12], and with age[12,20]. Several studies have shown that inflammation plays a key role in the pathogenesis of MGD, and a variety of inflammatory factors[21-22], especially IL-6, IL-8, and TNF-α,have been shown to be involved in MGD disease processes.These play an important role in damaging the corneal epithelial structure and in damaging tear film stability. At the same time,IL-6, IL-8, and TNF-α are also often used as indicators to reflect therapeutic effects[23-24]. Enríquez-de-Salamanca et al[21]found that IL-6, IL-8, and TNF-α were highly expressed in the tears and conjunctival and lacrimal gland tissues of patients with evaporative dry eye. Therefore, in the present study,we also determined the expression changes of these three factors when assessing the success of the model. The results showed that IL-6, IL-8, and TNF-α were highly expressed in conjunctival, corneal, and meibomian tissues, which is consistent with their expression in MGD patients.
EGF is a factor that can repair epithelial tissue and combat damage. In previous studies, EGF expression was decreased significantly in tears, the lacrimal gland, and the salivary gland[25]of patients with dry eyes, especially in patients with Sjögren Syndrome (SS)[26]and in patients with chronic graftversus-host disease[27], but without MGD. However, many studies[21,28]have shown that the expression of EGF in patients with MGD is elevated and consistent with the results of our experiment. Rao et al[29]compared the changes in EGF expression in tears between MGD and SS patients, and found that EGF expression was increased in patients with MGD and decreased in SS patients. This experiment may have developed a method of modeling absent damage to the animals’ lacrimal and salivary glands. There needs to be follow-up experiments to determine whether the electric bright closing of meibomian gland openings promotes lachrymal compensatory function and stimulates the EGF expression-associated action.
Ki67 is a factor that marks the cell in the proliferative cycle.Nien et al[30]used this method to assess the cell proliferation potential of meibomian glands and found that the expression was negatively correlated with age in patients with MGD.Parfitt et al[11]found that the expression of Ki67 in 2-yearold rats was significantly lower than that of 5-month-old rats,and the expression of Ki67 in MGD was negatively correlated with age in the animals. The variation in Ki67 indirectly demonstrates that the pathogenesis of MGD is related to the premigration of the skin and the mucosa boundary of the eyelid and the atrophy caused by cell loss. In our experiment,the expression of Ki67 in the corneal and conjunctival tissue was not significantly different, this may be related to the rats being the same age.
In summary, we produced an MGD rat model via electrocauterization of the meibomian gland orifices that matched the clinical manifestations and cytokines of MGD, providing a new method for the preparation of an MGD animal model.
Foundation:Supported by Tianjin Union Medical Center Hospital Level Project (No.2016YJ023).
Conflicts of Interest: Dong ZY,None;Ying M,None;Zheng J,None;Hu LJ,None;Xie JY,None;Ma Y,None.
REFERENCES
1 Na KS, Han K, Park YG, Na C, Joo CK. Depression, stress, quality of life, and dry eye disease in Korean women: a population-based study.Cornea2015;34(7):733-738.
2 Tan LL, Morgan P, Cai ZQ, Straughan RA. Prevalence of and risk factors for symptomatic dry eye disease in Singapore.Clin Expe Optom2015;98(1):45-53.
3 Gilbard JP, Rossi SR, Heyda KG. Tear film and ocular surface changes after closure of the meibomian gland orifices in the rabbit.Ophthalmology1989;96(8):1180-1186.
4 Schrader S, Mircheff AK, Geerling G. Animal models of dry eye.Dev Ophthalmol2008;41:298-312.
5 Fujihara T, Murakami T, Fujita H, Nakamura M, Nakata K.Improvement of corneal barrier function by the P2Y(2) agonist INS365 in a rat dry eye model.Invest Ophthalmol Vis Sci2001;42(1):96-100.
6 Koh S, Watanabe H, Hosohata J, Hori Y, Hibino S, Nishida K, Maeda N, Tano Y. Diagnosing dry eye using a blue-free barrier filter.Am J Ophthalmol2003;136(3):513-519.
7 DEWS. The definition and classification of dry eye disease: report of the De finition and Classification Subcommittee of the International Dry Eye WorkShop (2007).Ocular Surf2007;5(2):75-92.
8 Jester JV, Rife L, Nii D, Luttrull JK, Wilson L, Smith RE. In vivo biomicroscopy and photography of meibomian glands in a rabbit model of meibomian gland dysfunction.Invest Ophthalmol Vis Sci1982;22(5):660-667.
9 Lambert R, Smith RE. Hyperkeratinization in a rabbit model of meibomian gland dysfunction.Am J Ophthalmol1988;105(6):703-705.
10 Jester JV, Nicolaides N, Kiss-Palvolgyi I, Smith RE. Meibomian gland dysfunction. II. The role of keratinization in a rabbit model of MGD.Invest Ophthalmol Vis Sci1989;30(5):936-945.
11 Par fitt GJ, Xie Y, Geyfman M, Brown DJ, Jester JV. Absence of ductal hyper-keratinization in mouse age-related meibomian gland dysfunction(ARMGD).Aging(Albany NY)2013;5(11):825-834.
12 Jester JV, Parfitt GJ, Brown DJ. Meibomian gland dysfunction:hyperkeratinization or atrophy?.BMC Ophthalmol2015;15(Suppl 1):156.
13 Uchino Y, Kawakita T, Ishii T, Ishii N, Tsubota K. A new mouse model of dry eye disease: oxidative stress affects functional decline in the lacrimal gland.Cornea2012;31(Suppl 1):S63-S67.
14 Mcmahon A, Lu H, Butovich IA. A role for ELOVL4 in the mouse meibomian gland and sebocyte cell biology.Invest Ophthalmol Vis Sci2014;55(5):2832-2840.
15 Contreras-Ruiz L, Mir FA, Turpie B, Krauss AH, Masli S. Sjögren’s syndrome associated dry eye in a mouse model is ameliorated by topical application of integrin α4 antagonist GW559090.Exp Eye Res2016;143:1-8.
16 Ibrahim OM, Dogru M, Matsumoto Y, Igarashi A, Kojima T, Wakamatsu TH, Inaba T, Shimizu T, Shimazaki J, Tsubota K. Oxidative stress induced age dependent meibomian gland dysfunction in Cu, Zn-superoxide dismutase-1 (Sod1) knockout mice.PLoS One2014;9(7):e99328.
17 Kenchegowda D, Swamynathan S, Gupta D, Wan H, Whitsett J,Swamynathan SK. Conditional disruption of mouse Klf5 results in defective eyelids with malformed meibomian glands, abnormal cornea and loss of conjunctival goblet cells.Dev Biol2011;356(1):5-18.
18 Jong MC, Gijbels MJ, Dahlmans VE, Gorp PJ, Koopman SJ, Ponec M,Hofker MH, Havekes LM. Hyperlipidemia and cutaneous abnormalities in transgenic mice overexpressing human apolipoprotein C1.J Clin Invest1998;101(1):145-152.
19 Hessen M, Akpek EK. Dry eye: an inflammatory ocular disease.J Ophthamic Vis Res2014;9(2):240-250.
20 Nien CJ, Paugh JR, Massei S, Wahlert AJ, Kao WW, Jester JV. Age-related changes in the meibomian gland.Exp Eye Res2009;89(6):1021-1027.
21 Enríquez-de-Salamanca A, Castellanos E, Stern ME, Fernández I,Carreño E, García-Vázquez C, Herreras JM, Calonge M. Tear cytokine and chemokine analysis and clinical correlations in evaporative-type dry eye disease.Mol Vis2010;16:862-873.
22 Jung JW, Han SJ, Nam SM, Kim TI, Kim EK, Seo KY. Meibomian gland dysfunction and tear cytokines after cataract surgery according to preoperative meibomian gland status.Clin Exp Ophthalmol2016;44(7):555-562.
23 Liu R, Rong B, Tu P, Tang Y, Song W, Rolando T, Melissa T, Yan X.Analysis of cytokine levels in tears and clinical correlations after intense pulsed light treating meibomian gland dysfunction.Am J Ophthalmol2017;183:81-90.
24 Lee H, Chung B, Kim KS, Seo KY, Choi BJ, Kim TI. Effects of topical loteprednol etabonate on tear cytokines and clinical outcomes in moderate and severe meibomian gland dysfunction: randomized clinical trial.Am J Ophthalmol2014;158(6):1172-1183.
25 Azuma N, Katada Y, Kitano S, Nishioka A, Sekiguchi M, Kitano M,Hashimoto N, Matsui K, Iwasaki T, Sano H. Salivary epidermal growth factor (EGF) in Sjögren’s syndrome: association between salivary EGF levels and the severity of intraoral manifestations.Nihon Rinsho Meneki Gakkai Kaishi2016;39(1):42-50.
26 P flugfelder SC, Jones D, Ji Z, Afonso A, Monroy D. Altered cytokine balance in the tear fluid and conjunctiva of patients with Sjögren’s syndrome keratoconjunctivitis sicca.Curr Eye Res1999;19(3):201-211.
27 Cocho L, Fernández I, Calonge M, Martínez V, González-García MJ,Caballero D, López-Corral L, García-Vázquez C, Vázquez L, Stern ME,Enríquez-de-Salamanca A. Biomarkers in ocular chronic graft versus host disease: tear cytokine- and chemokine-based predictive model.Invest Ophthalmol Vis Sci2016;57(2):746-758.
28 Lam H, Bleiden L, De Paiva CS, Farley W, Stern ME, P flugfelder SC.Tear cytokine profiles in dysfunctional tear syndrome.Am J Ophthalmol2009;147(2):198-205.
29 Rao K, Farley WJ, Pflugfelder SC. Association between high tear epidermal growth factor levels and corneal subepithelial fibrosis in dry eye conditions.Invest Ophthalmol Vis Sci2010;51(2):844-849.
30 Nien CJ, Massei S, Lin G, Nabavi C, Tao J, Brown DJ, Paugh JR,Jester JV. Effects of age and dysfunction on human meibomian glands.Arch Ophthalmol2011;129(4):462-469.
Correspondence to:Zi-Yi Dong. Department of Ophthalmology,Tianjin Union Medical Center, Tianjin 300121, China.dong10001984@hotmail.com
Received:2017-11-01 Accepted: 2018-04-23
Abstract ● AlM: To find a stable, inexpensive, and reliable method to produce a rat meibomian gland dysfunction (MGD) model.● METHODS: We inserted slim guidewires into the meibomian gland orifices of twelve Brown Norway rats and fulgurized every guidewire to destroy part of the meibomian gland. We then observed the morphological changes in the eyelid margin, and compared the data of tear breakup time (TBUT), Schirmer l test, and the corneal fluorescence staining scores at different times (1, 2, 4, and 6wk). We observed pathological changes of the cornea,conjunctiva and meibomian gland, and we used real-time polymerase chain reaction to analyze epithelial growth factor (EGF), interleukin-6 (lL-6), lL-8, tumor necrosis factor-α (TNF-α), and Ki67.● RESULTS: ln the fourth week, compared with the control group, the TBUT of the model group began to decreased(P<0.05). The tear secretion remained stable (P>0.05). The corneal dots were significantly increased in the fourth week when the fusion stain began to appear (P<0.05). ln the fourth week, partial meibomian gland openings had hoary secretions blocked, orifices were expanded, and there was a partial convex deformation. ln the sixth week,the tissue section showed that the number of conjunctival goblet cells was decreased, epithelial cells were irregular,the epithelium was detached and rough, and meibomian glands were lost. The expressions of EGF, lL-6, lL-8, and TNF-α in corneal, conjunctival, and meibomian tissues were highly increased (P<0.05), but no statistical difference was found in the expression of Ki67 in corneal and conjunctival tissues (P>0.05).● CONCLUSlON: The MGD rat model, produced via electrocauterization of meibomian gland orifices, matched clinical manifestations and cytokine levels. Our research provides a new method of achieving an MGD animal model.
● KEYWORDS:meibomian gland dysfunction; animal model;epithelial growth factor; interleukin-6; interleukin-8; tumor necrosis factor-α; Ki67
DOl:10.18240/ijo.2018.07.01
Citation:Dong ZY, Ying M, Zheng J, Hu LJ, Xie JY, Ma Y. Evaluation of a rat meibomian gland dysfunction model induced by closure of meibomian gland orifices. Int J Ophthalmol 2018;11(7):1077-1083