Analysis of peripapillary retinal nerve fiber layer and inner macular layers by spectral-domain optical coherence tomography for detection of early glaucoma
Pei-Wen Lin1, Hsueh-Wen Chang2, Jih-Pin Lin1, Ing-Chou Lai1
1Department of Ophthalmology, Kaohsiung Chang Gung Memorial Hospital and Chang Gung University College of Medicine, Kaohsiung, Taiwan
2Department of Biological Sciences, Sun Yat-Sen University,Kaohsiung, Taiwan
INTRODUCTION
Glaucomatous optic neuropathy is characterized by progressive loss of retinal ganglion cells (RGCs) and their axons, thinning of retinal nerve fiber layer (RNFL),increased optic disc cup or notching of optic nerve head (ONH),and characteristic visual field (VF) defects. The structural changes are evaluated by ONH changes and peripapillary retinal nerve fiber layer (pRNFL) defects. However, there are a wide range of optic disc and cup sizes, variable configuration of the blood vessels, variable angle of the optic nerve tilt and peripapillary changes in the general population[1]. Variable optic disc size and peripapillary optic disc atrophy can result in errors in measurements of the pRNFL thickness, especially in highly myopic patients[2-3]. Because 50% of the RGCs are located within the macula[4]and the macula shape is generally less variable than the ONH, macular thickness assessment has been considered for evaluating structural changes of glaucoma.Zeimer et al[5]first suggested imaging of the macula as a potential location for glaucoma evaluation. Macular thickness measurements by optical coherence tomography (OCT) have been shown in previous studies to be significantly thinner in glaucomatous eyes compared to healthy eyes[6-12].
The RGCs and their axons constitute the inner retina layers and are specifically affected by glaucomatous damage.Because some of the retinal layers are not involved in the glaucomatous process, measurement of the total macular layer(TML) thickness may reduce the sensitivity and specificity for glaucoma diagnosis. Time-domain optical coherence tomography (TD-OCT) measures TML thickness, which includes thickness of all retinal layers. Segmentation of the inner macular layers (IML) may provide better discrimination between healthy and glaucomatous eyes than the TML measurements. With the advent of spectral-domain optical coherence tomography (SD-OCT), higher scan resolution and scan speed have been achieved than TD-OCT, and segment the TML by analysis algorithm software can be also performed.Recent advances in segmentation algorithms have enabled better quantitative macular ganglion cell complex (mGCC)or macular ganglion cell-inner plexiform layer (mGCIPL)assessment for effective diagnosis and evaluation of glaucoma progression[9,13-14]. Seong et al[9]reported that mGCC thickness was comparable to pRNFL thickness in glaucoma diagnosis.Kim et al[13]showed that mGCC and pRNFL thicknesses had similar diagnostic performances in detecting early, moderate and severe glaucoma. Jung et al[14]reported that the diagnostic ability of the mGCIPL thickness was comparable to that of the pRNFL thickness in patients with normal tension glaucoma (NTG) or primary open angle glaucoma (POAG).The segmented IML thickness performed better than the TML thickness and was similar to the pRNFL thickness in glaucoma diagnosis.
The commercially available SD-OCTs measure the macular thickness as mGCC or mGCIPL, which consist of macular RNFL, ganglion cell layer, and/or inner plexiform layer, for effective diagnosis of glaucoma. Loss of RGCs was commonly seen in early glaucoma, so segmentation of IML for isolated retinal layer can help for early diagnosis of glaucoma.Spectralis OCT (Heidelberg Engineering, Dossenheim Heidelberg, Germany) provides analysis algorithm which can automatically segment the macular thickness into ten retinal layers. Isolated retinal layer can be measured for assessing of only RGCs or their axons, which are damaged in early stage of glaucoma. Ctori et al[15]demonstrated excellent repeatability and reproducibility for individual measurements of macular layer thickness by Spectralis OCT segmentation software. In this study, we investigated the differences of pRNFL thickness,TML thickness and segmented thicknesses of IML in normal subjects and patients with early stage of POAG and NTG, and evaluated the diagnostic capabilities of all the parameters for early detection of glaucoma.
SUBJECTS AND METHODS
This cross-sectional study investigated 53 patients with POAG, 60 patients with NTG, and 32 normal control subjects who attended the Glaucoma Clinic of Kaohsiung Chang Gung Memorial Hospital. The design of this study adhered to the tenets of the Declaration of Helsinki and was reviewed and approved by the Institutional Review Board and Ethics Committee at Chang Gung Memorial Hospital. Informed consent was obtained from all participants.
All patients underwent a thorough ophthalmologic examination,including best-corrected visual acuity, refraction, slit-lamp biomicroscopy, gonioscopy, central corneal thickness (CCT),ophthalmoscopy, red-free fundus photography (TRC-50EX,TOPCON, Japan), standard automatic perimetry (SAP) and OCT exam. The IOP was measured with Perkins applanation tonometry because some of the patients have difficulty in taking up the correct position at the slit lamp during IOP measurement. The refraction was expressed as spherical equivalence (SE), which was calculated as sphere plus half of the cylinder. To be included, patients had to have a bestcorrected visual acuity of 20/40 or better, spherical refraction within ±6.0 diopters, cylinder correction within ±3.0 diopters,open angle on gonioscopy and the IOP less than 21 mm Hg under medication control. All glaucoma patients were at early stage with a mean deviation (MD) value greater than -6.0 dB on SAP exam. Patients who had corneal lesions, chronic uveitis,secondary glaucoma, optic neuropathy other than glaucoma,retinal pathology, maculopathy and previous ocular trauma history were excluded from this study.
CCT was measured by non-contact specular microscope (SP-3000P, TOPCON, Tokyo, Japan) and SAP examination was performed with Swedish Interactive Threshold Algorithm(SITA) standard 30-2 Humphrey field analyzer (HFA, Carl Zeiss Meditec, Dublin, CA, USA). Unreliable VF test with fixation loss of more than 20% and false positive or false negative rates of more than 15% were excluded. A glaucomatous VF defect was defined as 3 or more significant(P<0.05) non-edge contiguous points with at least 1 at the P<0.01 level on the same side of the horizontal meridian in the pattern deviation plot and graded outside normal limits in the glaucoma hemifield test. Glaucomatous VF defects were confirmed by two reliable VF exams. Glaucomatous optic nerve damage was defined as the vertical cup-to-disc ratio>0.6, or the vertical cup-to-disc ratio >0.2 between the two eyes, or focal notching or generalized loss of the neuroretinal rim, excavation of the optic disc, or localized/diffuse RNFL defects on stereoscopic color fundus photographs. POAG was defined as an IOP greater than 21 mm Hg on more than two occasions without medication, a glaucomatous optic disc,RNFL defects with corresponding glaucomatous VF defects and open anterior chamber angles on gonioscopy. NTG was similar to POAG except that the IOP was less than 21 mm Hg without treatment. The normal subjects were from patients coming for routine ophthalmic examination and hospital staff who had no ocular disease and had not received ocular surgery or laser procedures. All the normal subjects had normal anterior segments, open angles, and normal posterior segment findings,as well as a normal ONH in the ophthalmic examination. The IOP measurements were lower than 21 mm Hg, and SITA 30-2 HFA were within normal limits.
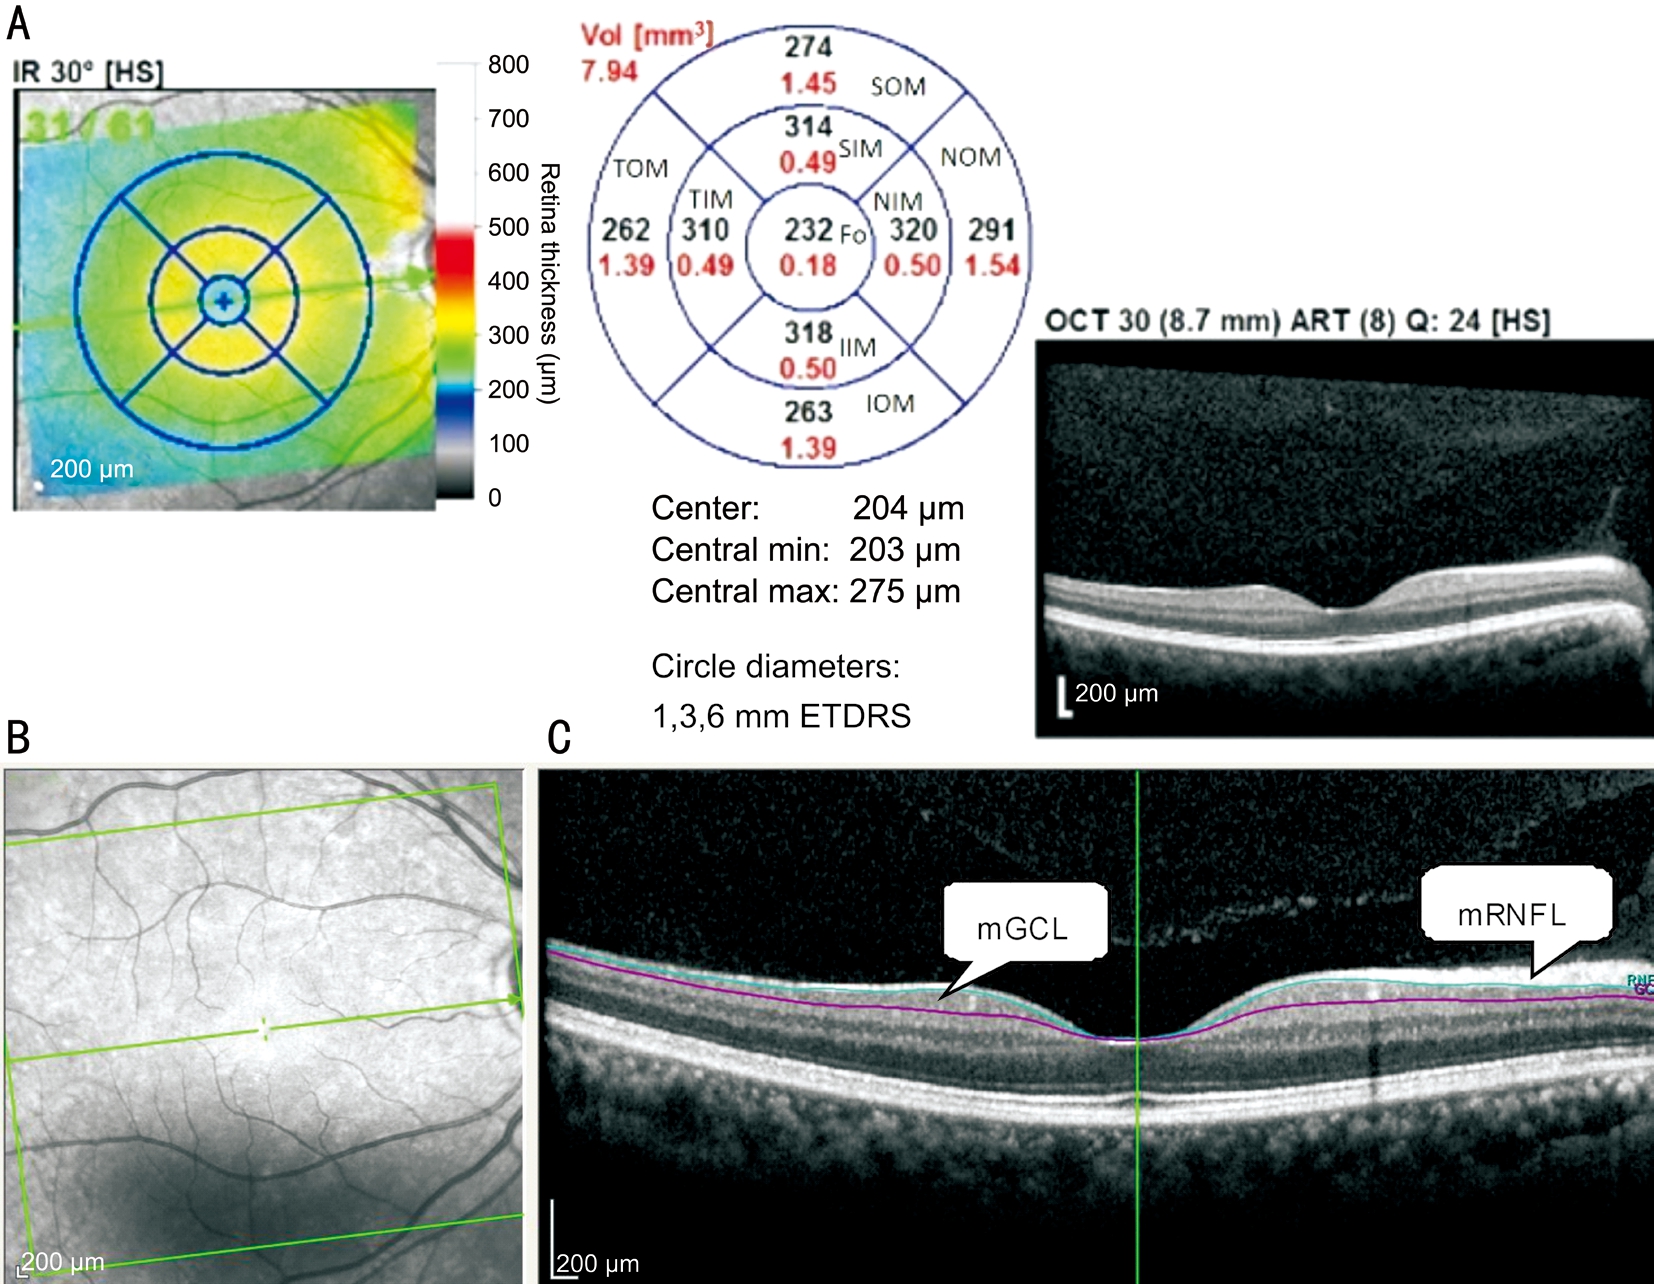
Figure 1 Macular sectors in Spectral-domain optical coherence tomography (A), infrared reflectance image of the macular region (B)and segmented macular layers in B scan images (C) mRNFL: Macular retinal nerve fiber layer; mGCL: Macular ganglion cell layer.
Spectral-domain imaging was performed with the Spectralis OCT (Heidelberg Engineering, Dossenheim Heidelberg,Germany). The fast RNFL thickness protocol was used for calculating the pRNFL thickness. The scan circle was 3.6 mm in diameter. The pRNFL thickness values were divided into 4 quadrants. The superior and inferior quadrants were further divided into nasal and temporal sectors. The OCT parameters,including global pRNFL thickness and average pRNFL thicknesses in four quadrants were generated automatically in the analysis reports. For TML thickness measurement,retinal thickness map analysis was used to display thickness measurements. The average retinal thickness of 1 mm diameter circle within the central fovea on the Early Treatment Diabetic Retinopathy Study grid was calculated. Two concentric circles with diameters of 3 mm and 6 mm outside the fovea central circle represented the inner and outer sectors of macula,respectively. The concentric circles were further divided into superior, temporal, inferior, and nasal quadrants. The automatic delineation and measurement were used for assessments of TML. After the TML thickness data were obtained, the TML were segmented automatically using the software-Multi-Layer Segmentation Tools provided by manufacturer of Spectralis OCT to generate the isolated IML (Figure 1).Only image quality of at least 20 was used for this study. Each patient underwent scans to measure the pRNFL and macular thicknesses at the same visit.
All examinations were completed within a 6-month period for each patient. If both eye fulfilled the inclusion criteria, only the eye with better OCT image quality was used for analysis.Because the superior and inferior quadrants were commonly affected in early stage of glaucomatous optic neuropathy, we chose the parameters at superior and inferior quadrants for statistical analysis. The superior macular thickness was the average macular thickness of the superior-inner and superiorouter sectors, and the inferior macular thickness was the average macular thickness of the inferior-inner and inferiorouter sectors.
Statistical AnalysisThe characteristics of participants were assessed by using Chi-square test for categorical data and one-way analysis of variance (ANOVA) for continuous data.The Bonferroni’s pairwise comparison was used to determine significance between any two of the groups. The one-way ANOVA was also conducted to assess the thicknesses of pRNFL, TML, mRNFL, and mGCL among the groups and the significance between any two of the groups was assessed by Bonferroni’s pairwise comparison. The correlations between VF parameters and different retinal layers were analyzed by Pearson’s correlation coefficient. Receiver operating characteristic (ROC) curves and sensitivities at 80% and 90%specificity were generated for various pRNFL and macularthickness parameters. An area under the ROC curve (AROC)value of 1.0 represented perfect discrimination, whereas an AROC value of 0.5 represented discrimination no better than chance. The method of DeLong was used to evaluate statistical differences of AROCs between the pRNFL and macular thickness parameters. All the statistics analyses were performed by SPSS statistical software (Version 18.0; SPSS,Inc., Chicago, IL, USA), and the DeLong test was done by Med Calc statistical software (Version 16.8.4). A P value less than 0.05 was considered to be statistically significant.
Table 1 Demographic data of normal subjects, primary open angle glaucoma and normal tension glaucoma patients
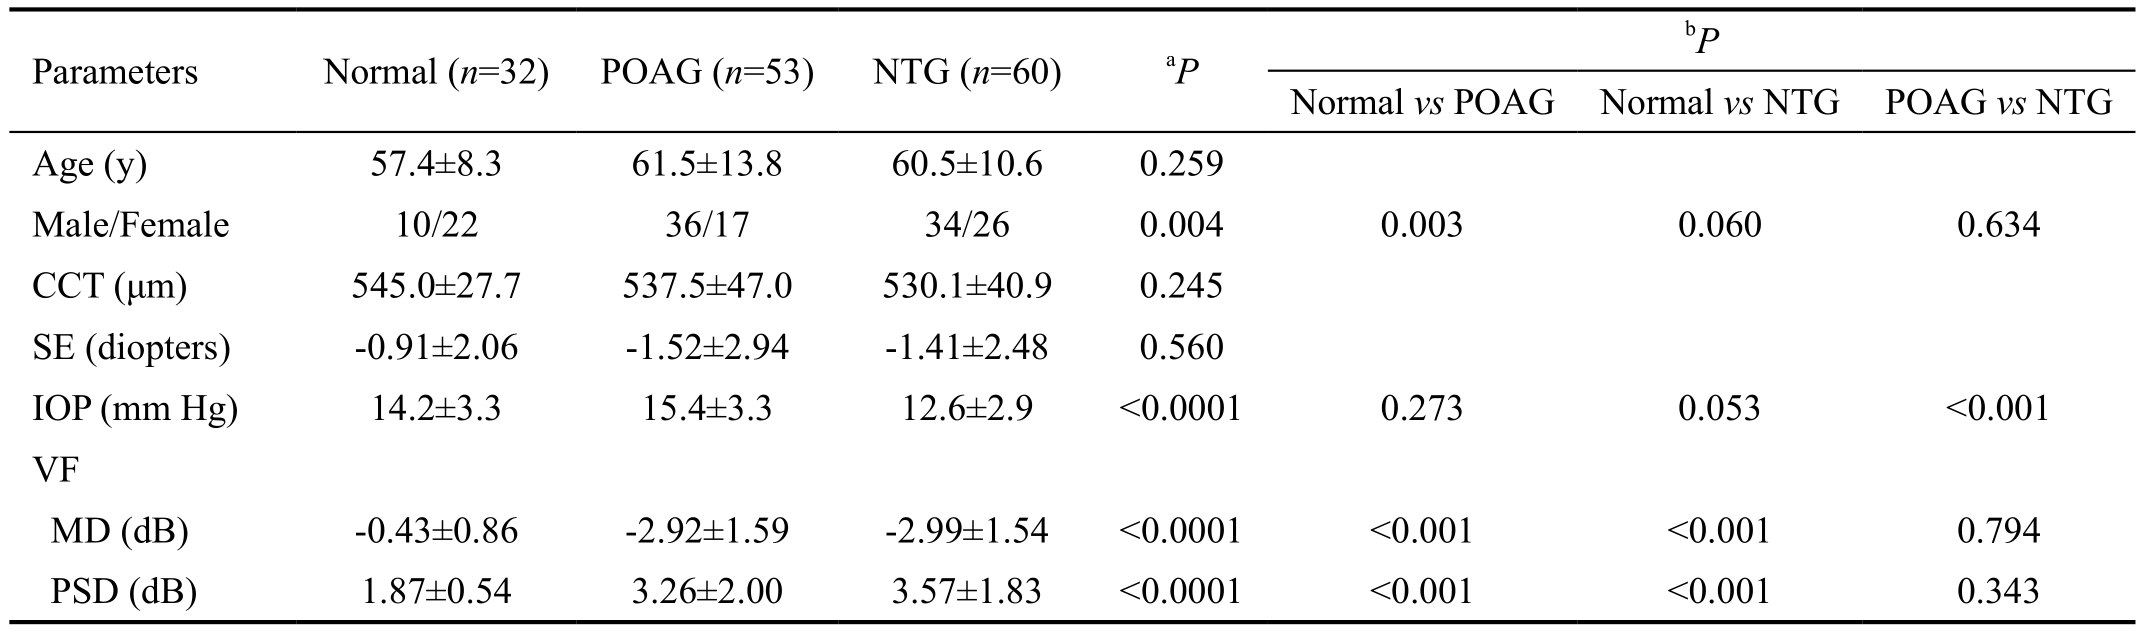
CCT: Central corneal thickness; SE: Spherical equivalence; IOP: Intraocular pressure; VF: Visual field; MD: Mean deviation; PSD: Pattern standard deviation; POAG: Primary open angle glaucoma; NTG: Normal tension glaucoma.aContinous data were analyzed using one-way ANOVA, and categorical data using Chi-square test;bBonferroni’s pairwise comparison.
Normal vs POAG Normal vs NTG POAG vs NTG Age (y) 57.4±8.3 61.5±13.8 60.5±10.6 0.259 Male/Female 10/22 36/17 34/26 0.004 0.003 0.060 0.634 CCT (μm) 545.0±27.7 537.5±47.0 530.1±40.9 0.245 SE (diopters) -0.91±2.06 -1.52±2.94 -1.41±2.48 0.560 IOP (mm Hg) 14.2±3.3 15.4±3.3 12.6±2.9 <0.0001 0.273 0.053 <0.001 VF MD (dB) -0.43±0.86 -2.92±1.59 -2.99±1.54 <0.0001 <0.001 <0.001 0.794 PSD (dB) 1.87±0.54 3.26±2.00 3.57±1.83 <0.0001 <0.001 <0.001 0.343 Parameters Normal (n=32) POAG (n=53) NTG (n=60)aP bP
RESULTS
The mean ages were 57.4±8.3y in the normal control group,61.5±13.8y in the POAG group, and 60.5±10.6y in the NTG group. The demographic data were shown in Table 1. The MD and PSD showed significant differences between patients with glaucoma and normal control groups (P<0.0001), but there were no significant differences between the POAG and NTG groups.
All the pRNFL thickness parameters and the TML thickness parameters except the fovea were significantly greater in the normal control group than in the NTG and POAG groups, but there were no significant differences between the NTG and POAG groups. In comparison of the thickness parameters of macular ganglion cell layer (mGCL) among three groups,all except the fovea were significantly greater in the normal control group than in the NTG and POAG groups, but there were no significant differences between the NTG and POAG groups. In comparison of the thickness parameters of macular RNFL (mRNFL) among three groups, the thicknesses of superior-outer and inferior-outer sectors were significantly greater in the normal control group than in the NTG and POAG groups, but there were no significant differences between the NTG and POAG groups (Table 2).
The correlations between MD and pRNFL, between MD and mGCL and between MD and mRNFL were shown in Figure 2. The thicknesses of superior and inferior mGCL significantly correlated with MD. The correlations between pRNFL and mGCL and between pRNFL and mRNFL were shown in Figure 3. Both the mGCL and mRNFL thicknesses significantly correlated with the pRNFL in superior and inferior quadrants (all P≤0.001).
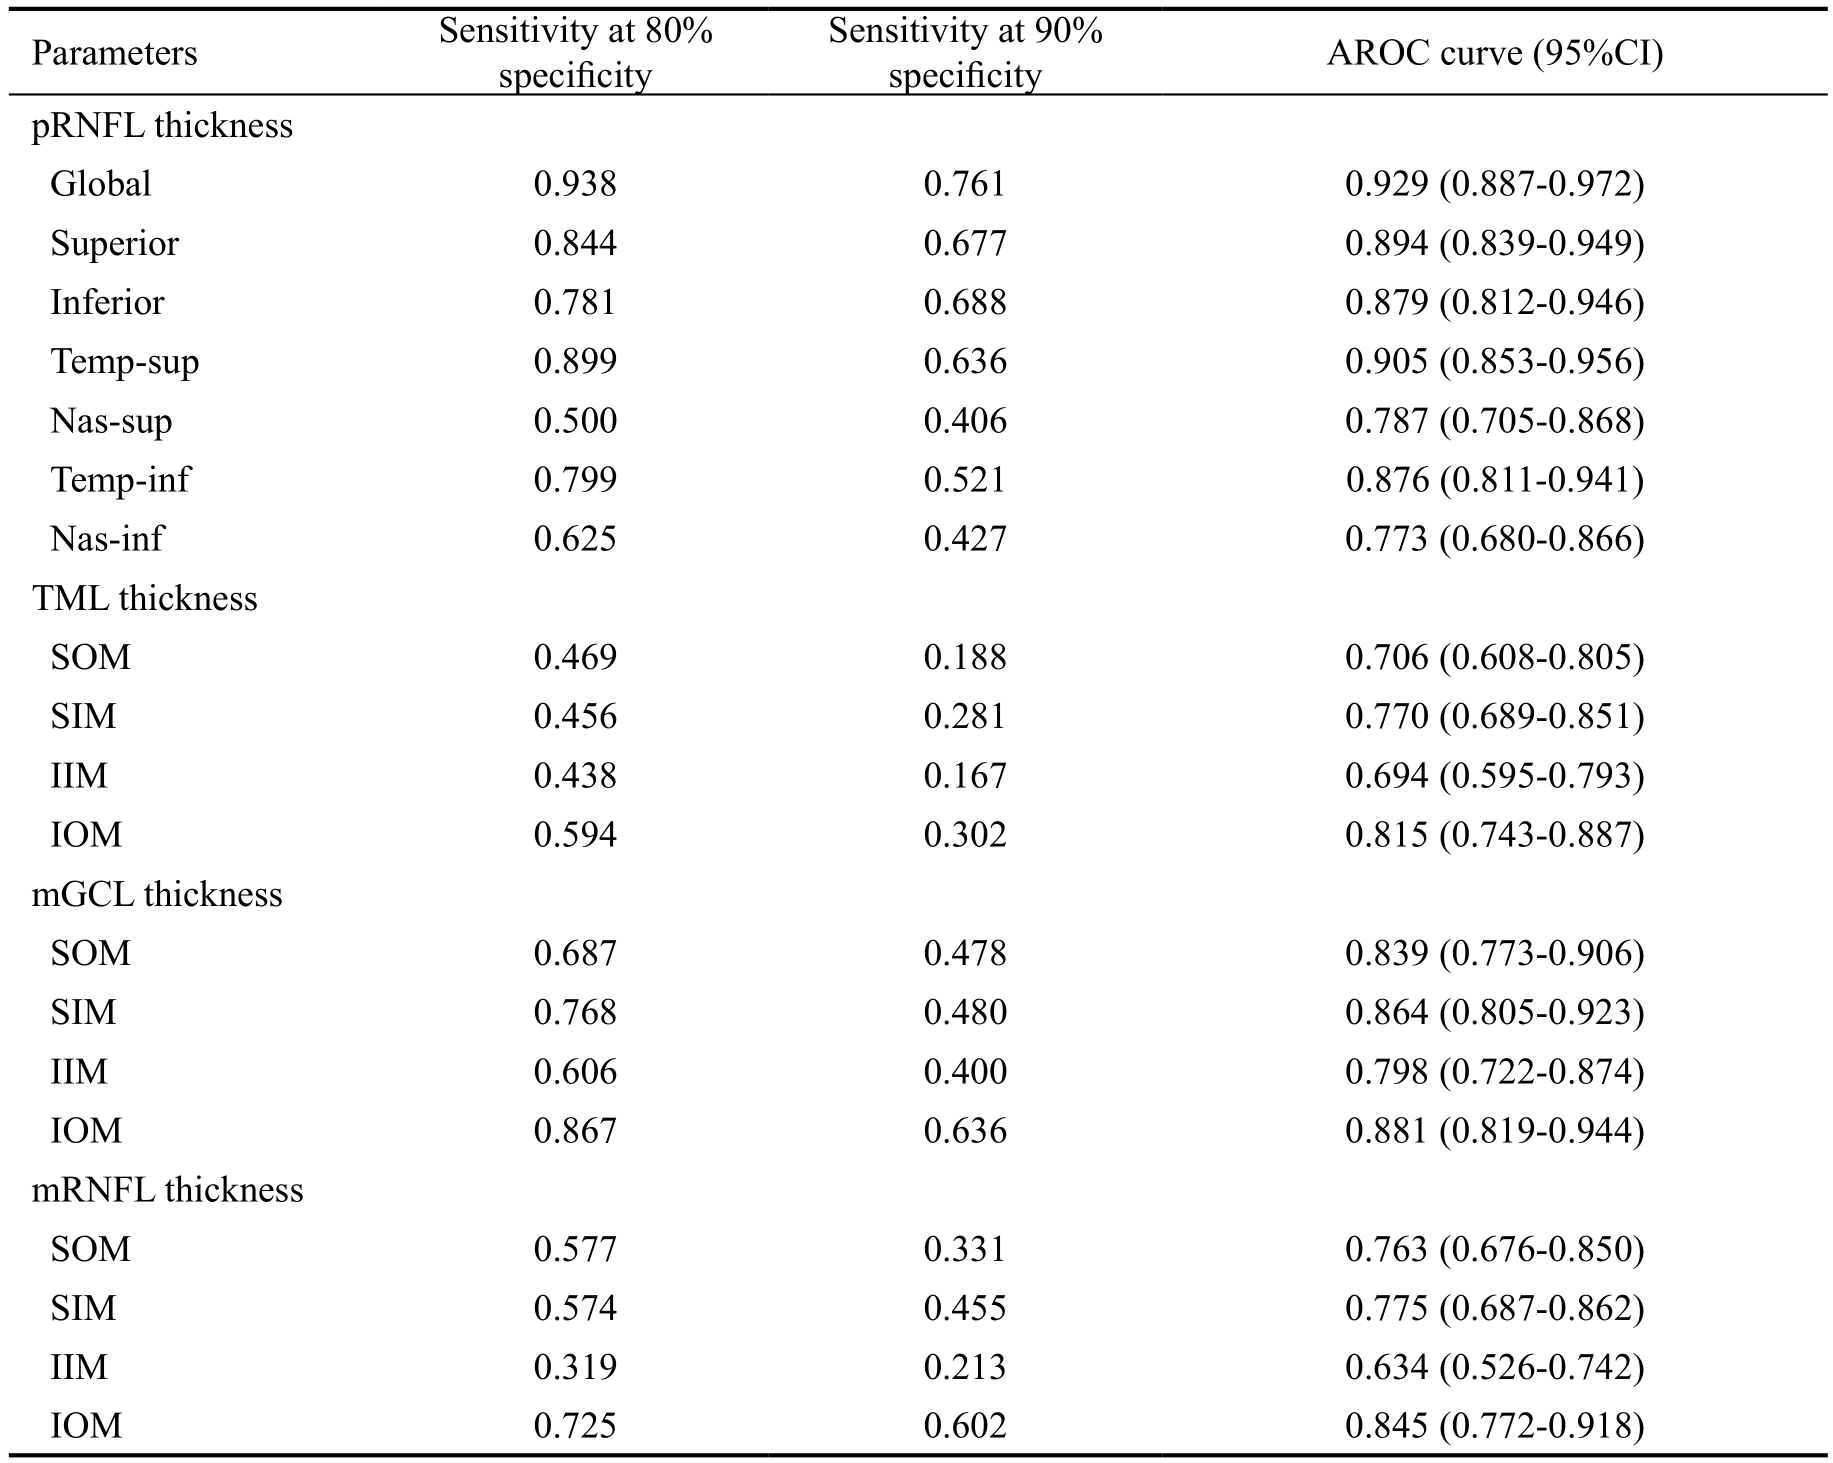
The AROCs for thicknesses of pRNFL, TML, mGCL and mRNFL and sensitivities at 80% and 90% specificity for differentiating early glaucoma from normal eyes were shown in Table 3 and Figure 4. The AROC for pRNFL showed the highest discriminating ability in global thickness (0.929).Regarding the TML, mGCL and mRNFL parameters, the inferior-outer sector thickness of mGCL had the highest AROC(0.881). The thicknesses of inferior-outer sectors had higher AROCs than those of inferior-inner sectors in the TML, mGCL and mRNFL thickness evaluation.
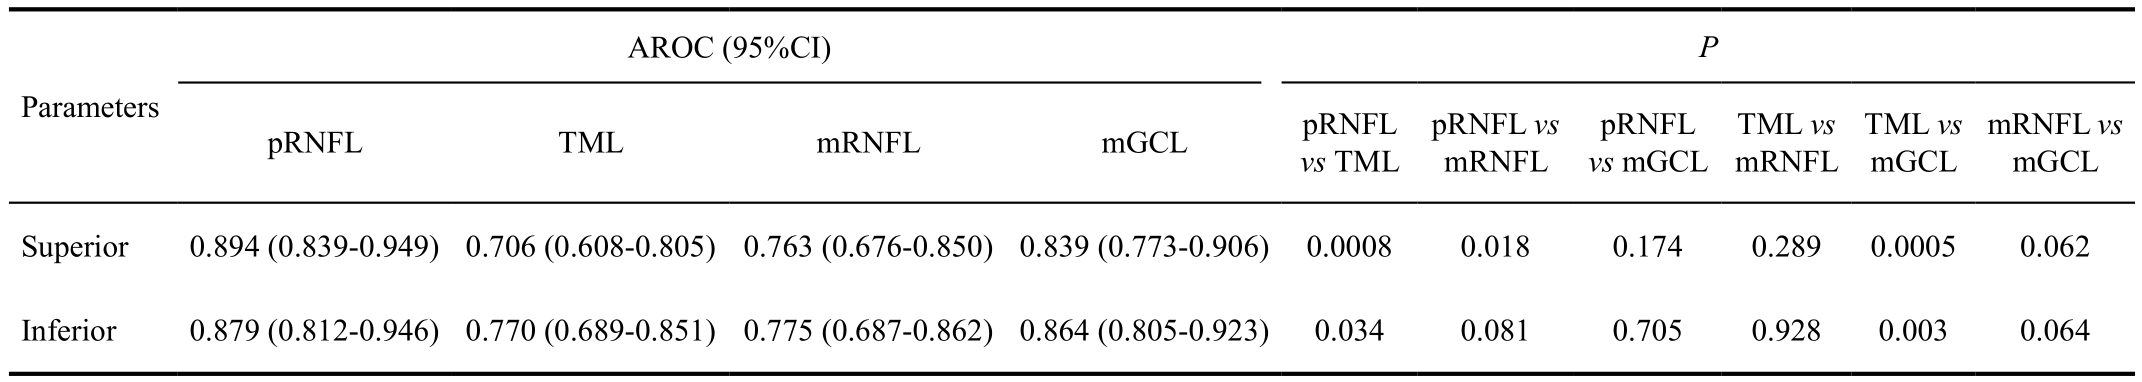
In comparison of the glaucoma diagnostic capabilities of pRNFL and IML parameters, there were no significant differences between pRNFL and mGCL in the superior and inferior quadrants (P=0.174 and 0.705, respectively). The diagnostic capability of the mGCL thickness was comparable to that of the pRNFL thickness. There were also no significant differences in glaucoma diagnostic capabilities between TML thickness and mRNFL thickness in the superior and inferior quadrants (P=0.289 and 0.928, respectively) (Table 4).
DISCUSSION
In the present study, POAG and NTG patients had thinner pRNFL, TML, mRNFL and mGCL thicknesses than normal control group, but there were no significant differences in the pRNFL, TML, mGCL and mRNFL thickness parameters between POAG and NTG groups. Abnormal susceptibility to normal IOP is assumed as the pathogenesis of NTG.Vascular etiologies such as reduced ocular blood flow caused by vasospasm, systemic hypotension, and abnormal blood coagulation have also been proposed as the mechanisms for NTG[16-17]. Some studies showed that the average, superior and inferior pRNFL thicknesses were thinner in the POAG patientsthan in the NTG patients[18-19]. Other studies showed that NTG showed more localized inferior or inferotemporal pRNFL defects compared with POAG[20-21]. Kim et al[21]compared the mGCC between POAG and NTG patients with MD of -7.70 dB and -7.09 dB, respectively. They found that the mGCC parameters in the POAG group were consistently lower than in the NTG group. They also found that the mGCC loss was more localized in inferior hemifield in the NTG group than in the POAG group. Jung et al[14]compared the mGCIPL between NTG and POAG patients with MD of -5.89 dB and -5.95 dB,respectively. They showed that the superior, superotemporal,and superonasal mGCIPL thicknesses in patients with POAGwere significantly thinner in comparison with those with NTG.As the glaucoma severity increases, the mGCIPL thickness decreases in a localized area in NTG but diffusely decreases in POAG. Firat et al[19]also compared early stage of POAG and NTG and found that there were no significant differences in TML in the four quadrants between the POAG and NTG patients, however, the mGCC was significantly thicker in patients with NTG than in patients with POAG. The different results found in the present study may be attributable to the severity of glaucoma in different studies. Our patients were in very early stage and there were no differences between POAG and NTG in the pRNFL, TML, mGCL and mRNFL thickness parameters, but there may be different structural damages as the disease progresses. Further studies on the pRNFL, TML and IML assessment are required to investigate the relationship between POAG and NTG in different stages of glaucoma.
Table 2 Thickness of pRNFL, TML, mGCL and mRNFL measured by SD-OCT in normal control subjects, POAG and NTG patients
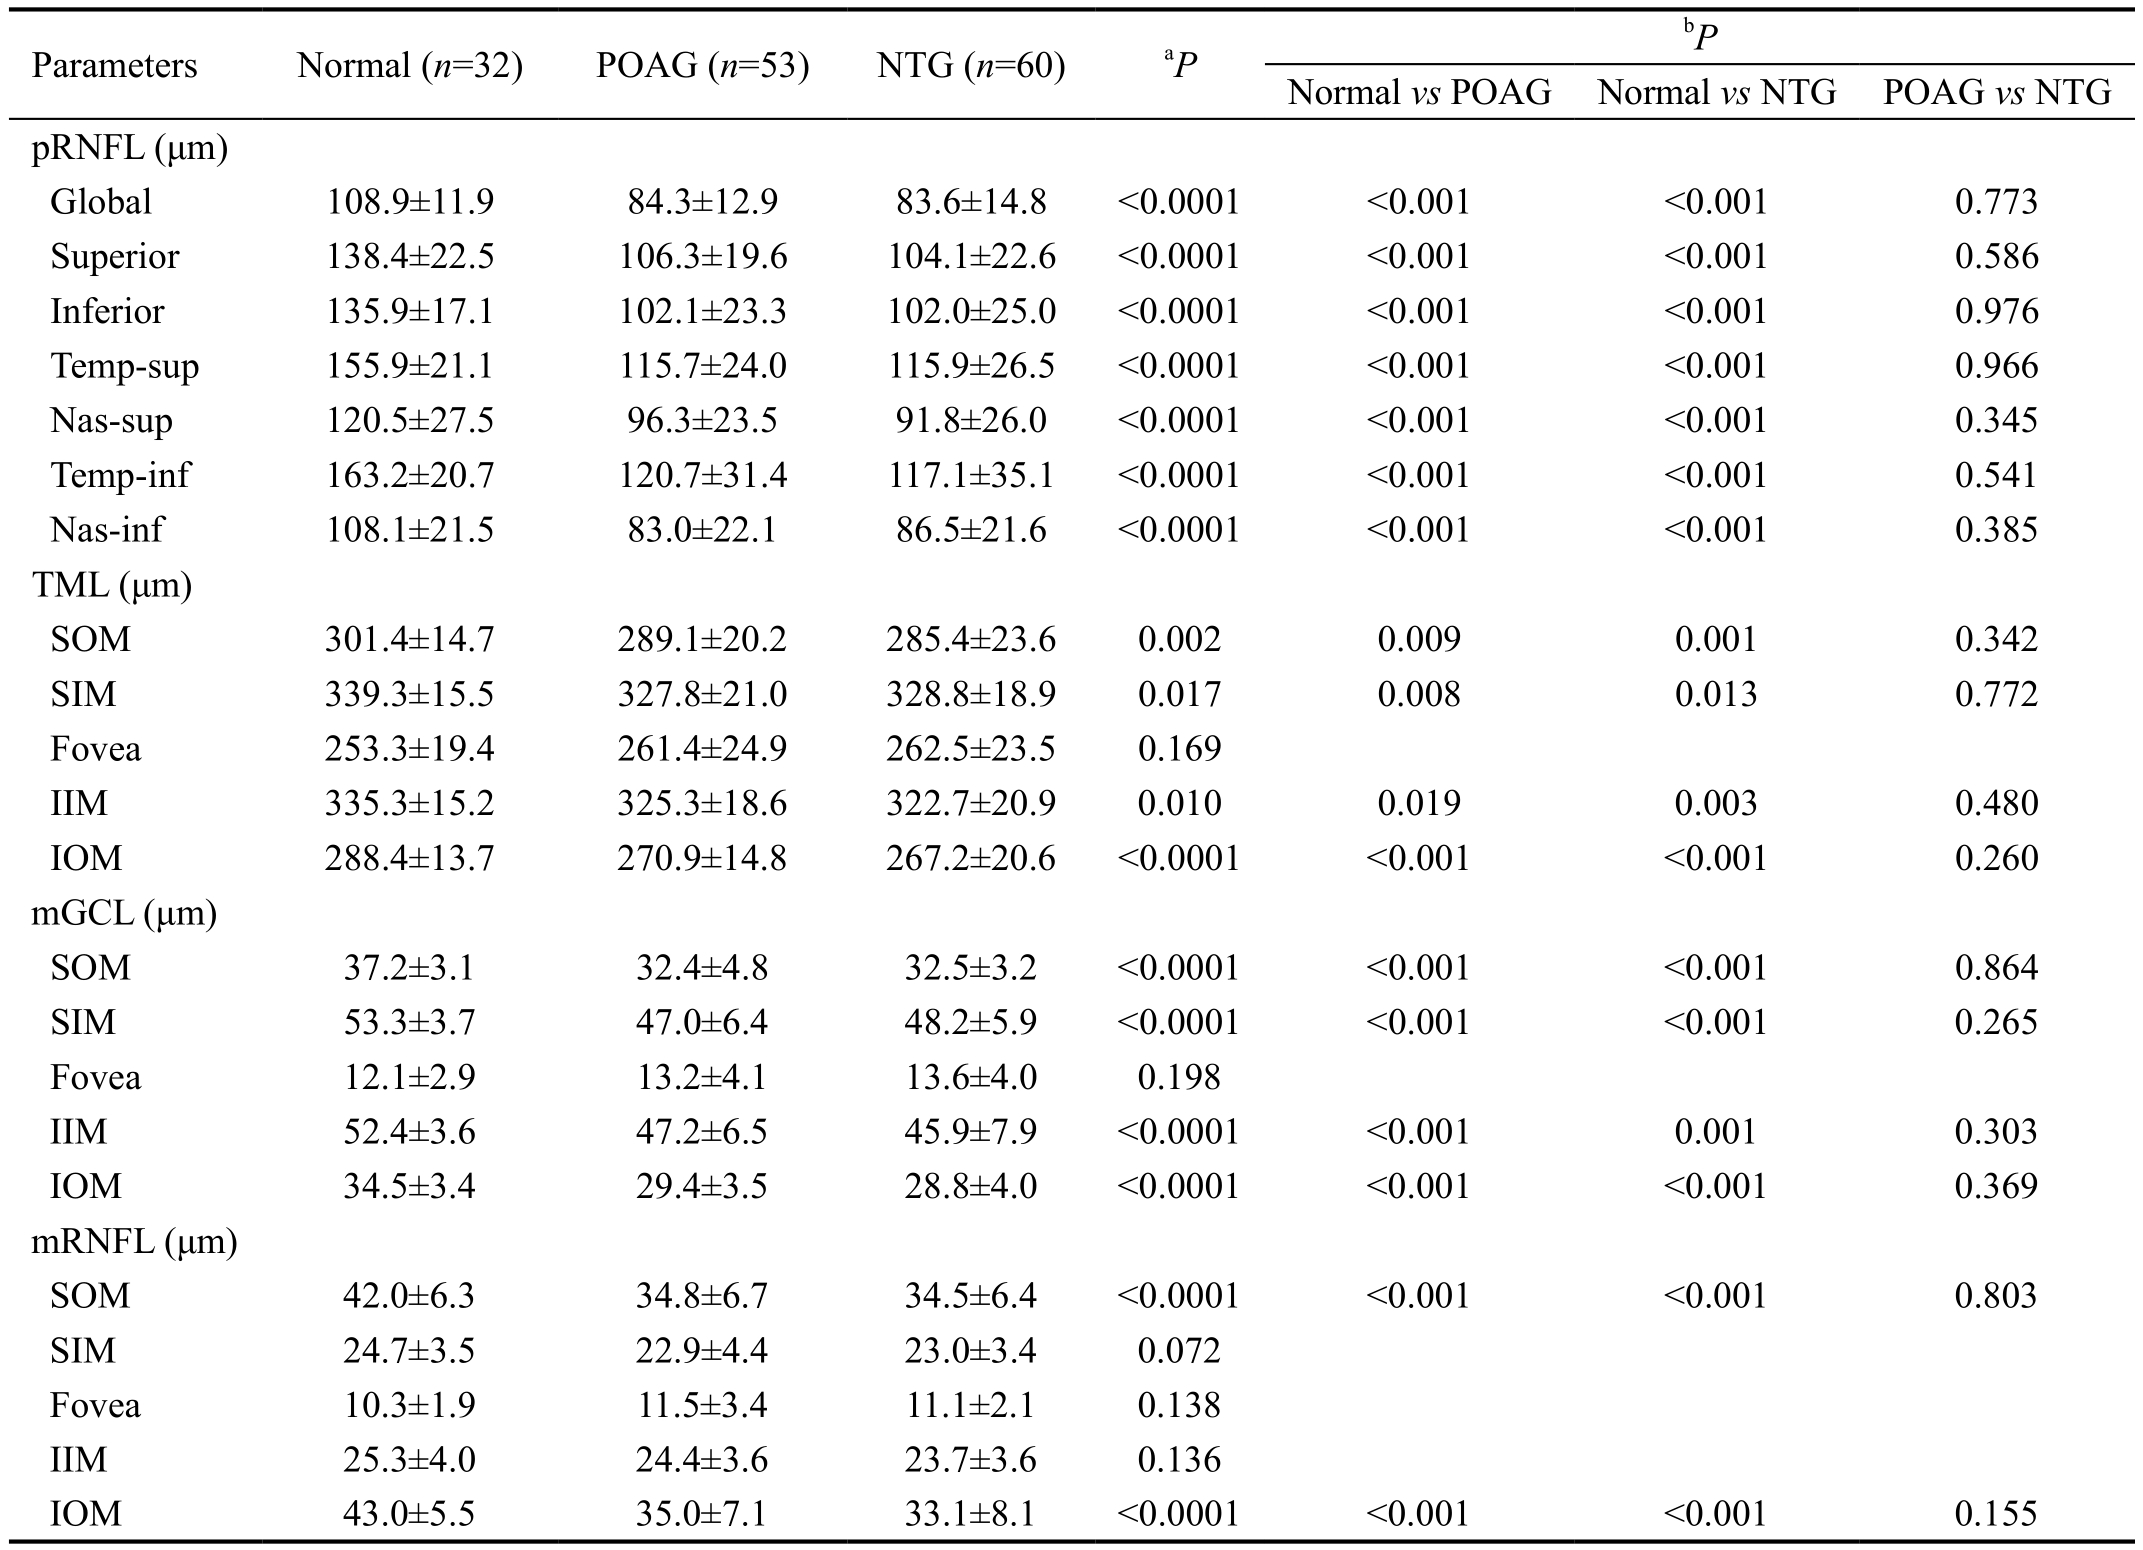
POAG: Primary open angle glaucoma; NTG: Normal tension glaucoma; pRNFL: Peripapillary retinal nerve fiber layer; mRNFL: Macular retinal nerve fiber layer; mGCL: Macular ganglion cell layer; Temp-sup: Temporal-superior; Temp-inf: Temporal-inferior; Nas-sup: Nasal-superior;Nas-inf: Nasal-inferior; SOM: Superior outer macula; SIM: Superior inner macula; IIM: Inferior inner macula; IOM: Inferior outer macula.aOne-way ANOVA;bBonferroni’s pairwise comparison.
Normal vs POAG Normal vs NTG POAG vs NTG pRNFL (μm)Global 108.9±11.9 84.3±12.9 83.6±14.8 <0.0001 <0.001 <0.001 0.773 Superior 138.4±22.5 106.3±19.6 104.1±22.6 <0.0001 <0.001 <0.001 0.586 Inferior 135.9±17.1 102.1±23.3 102.0±25.0 <0.0001 <0.001 <0.001 0.976 Temp-sup 155.9±21.1 115.7±24.0 115.9±26.5 <0.0001 <0.001 <0.001 0.966 Nas-sup 120.5±27.5 96.3±23.5 91.8±26.0 <0.0001 <0.001 <0.001 0.345 Temp-inf 163.2±20.7 120.7±31.4 117.1±35.1 <0.0001 <0.001 <0.001 0.541 Nas-inf 108.1±21.5 83.0±22.1 86.5±21.6 <0.0001 <0.001 <0.001 0.385 TML (μm)SOM 301.4±14.7 289.1±20.2 285.4±23.6 0.002 0.009 0.001 0.342 SIM 339.3±15.5 327.8±21.0 328.8±18.9 0.017 0.008 0.013 0.772 Fovea 253.3±19.4 261.4±24.9 262.5±23.5 0.169 IIM 335.3±15.2 325.3±18.6 322.7±20.9 0.010 0.019 0.003 0.480 IOM 288.4±13.7 270.9±14.8 267.2±20.6 <0.0001 <0.001 <0.001 0.260 mGCL (μm)SOM 37.2±3.1 32.4±4.8 32.5±3.2 <0.0001 <0.001 <0.001 0.864 SIM 53.3±3.7 47.0±6.4 48.2±5.9 <0.0001 <0.001 <0.001 0.265 Fovea 12.1±2.9 13.2±4.1 13.6±4.0 0.198 IIM 52.4±3.6 47.2±6.5 45.9±7.9 <0.0001 <0.001 0.001 0.303 IOM 34.5±3.4 29.4±3.5 28.8±4.0 <0.0001 <0.001 <0.001 0.369 mRNFL (μm)SOM 42.0±6.3 34.8±6.7 34.5±6.4 <0.0001 <0.001 <0.001 0.803 SIM 24.7±3.5 22.9±4.4 23.0±3.4 0.072 Fovea 10.3±1.9 11.5±3.4 11.1±2.1 0.138 IIM 25.3±4.0 24.4±3.6 23.7±3.6 0.136 IOM 43.0±5.5 35.0±7.1 33.1±8.1 <0.0001 <0.001 <0.001 0.155 Parameters Normal (n=32) POAG (n=53) NTG (n=60)aP bP
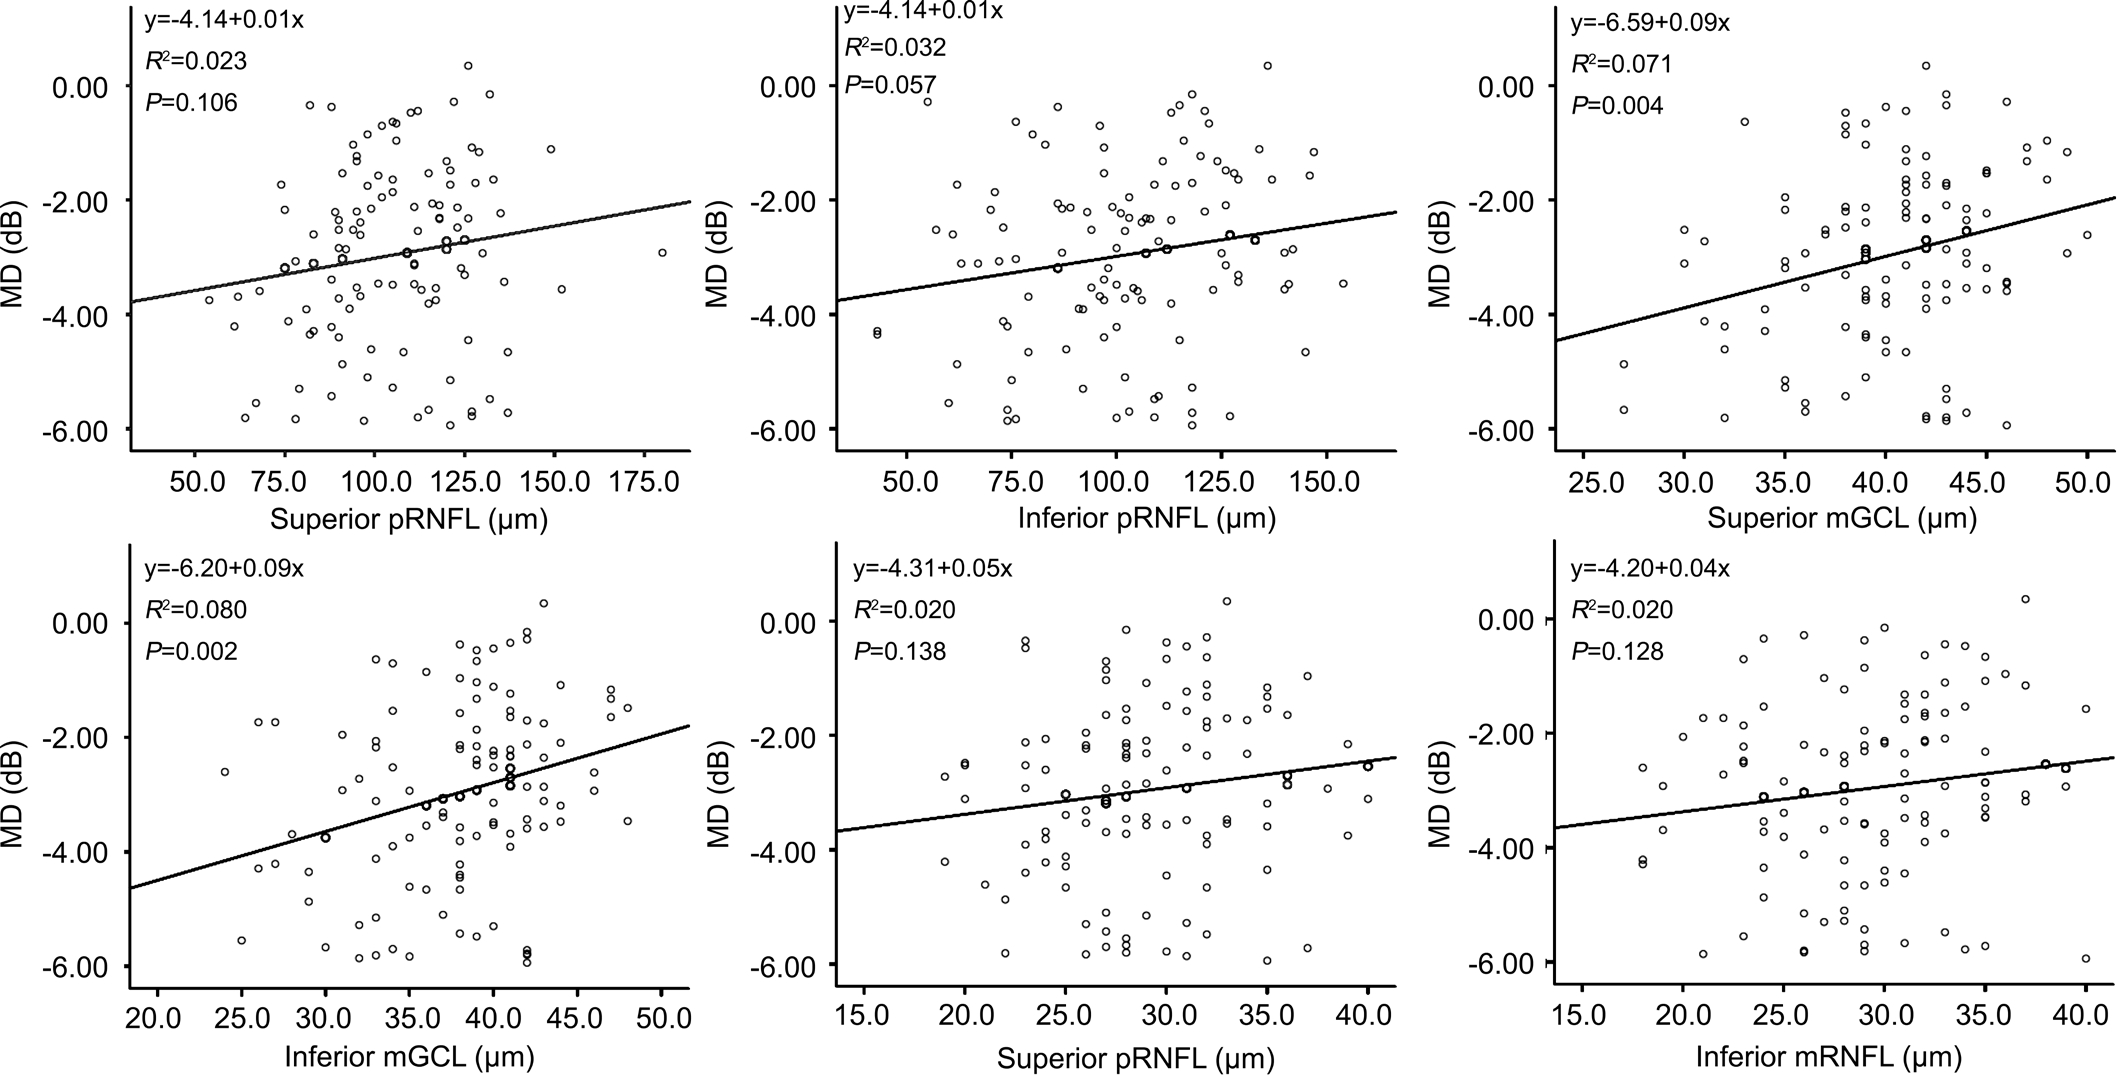
Figure 2 Correlations between OCT parameters and mean deviation of visual field The thicknesses of superior mGCL and inferior mGCL significantly correlated with mean deviation. MD: Mean deviation; pRNFL: Peripapillary retinal nerve fiber layer; mGCL: Macular ganglion cell layer; mRNFL: Macular retinal nerve fiber layer.
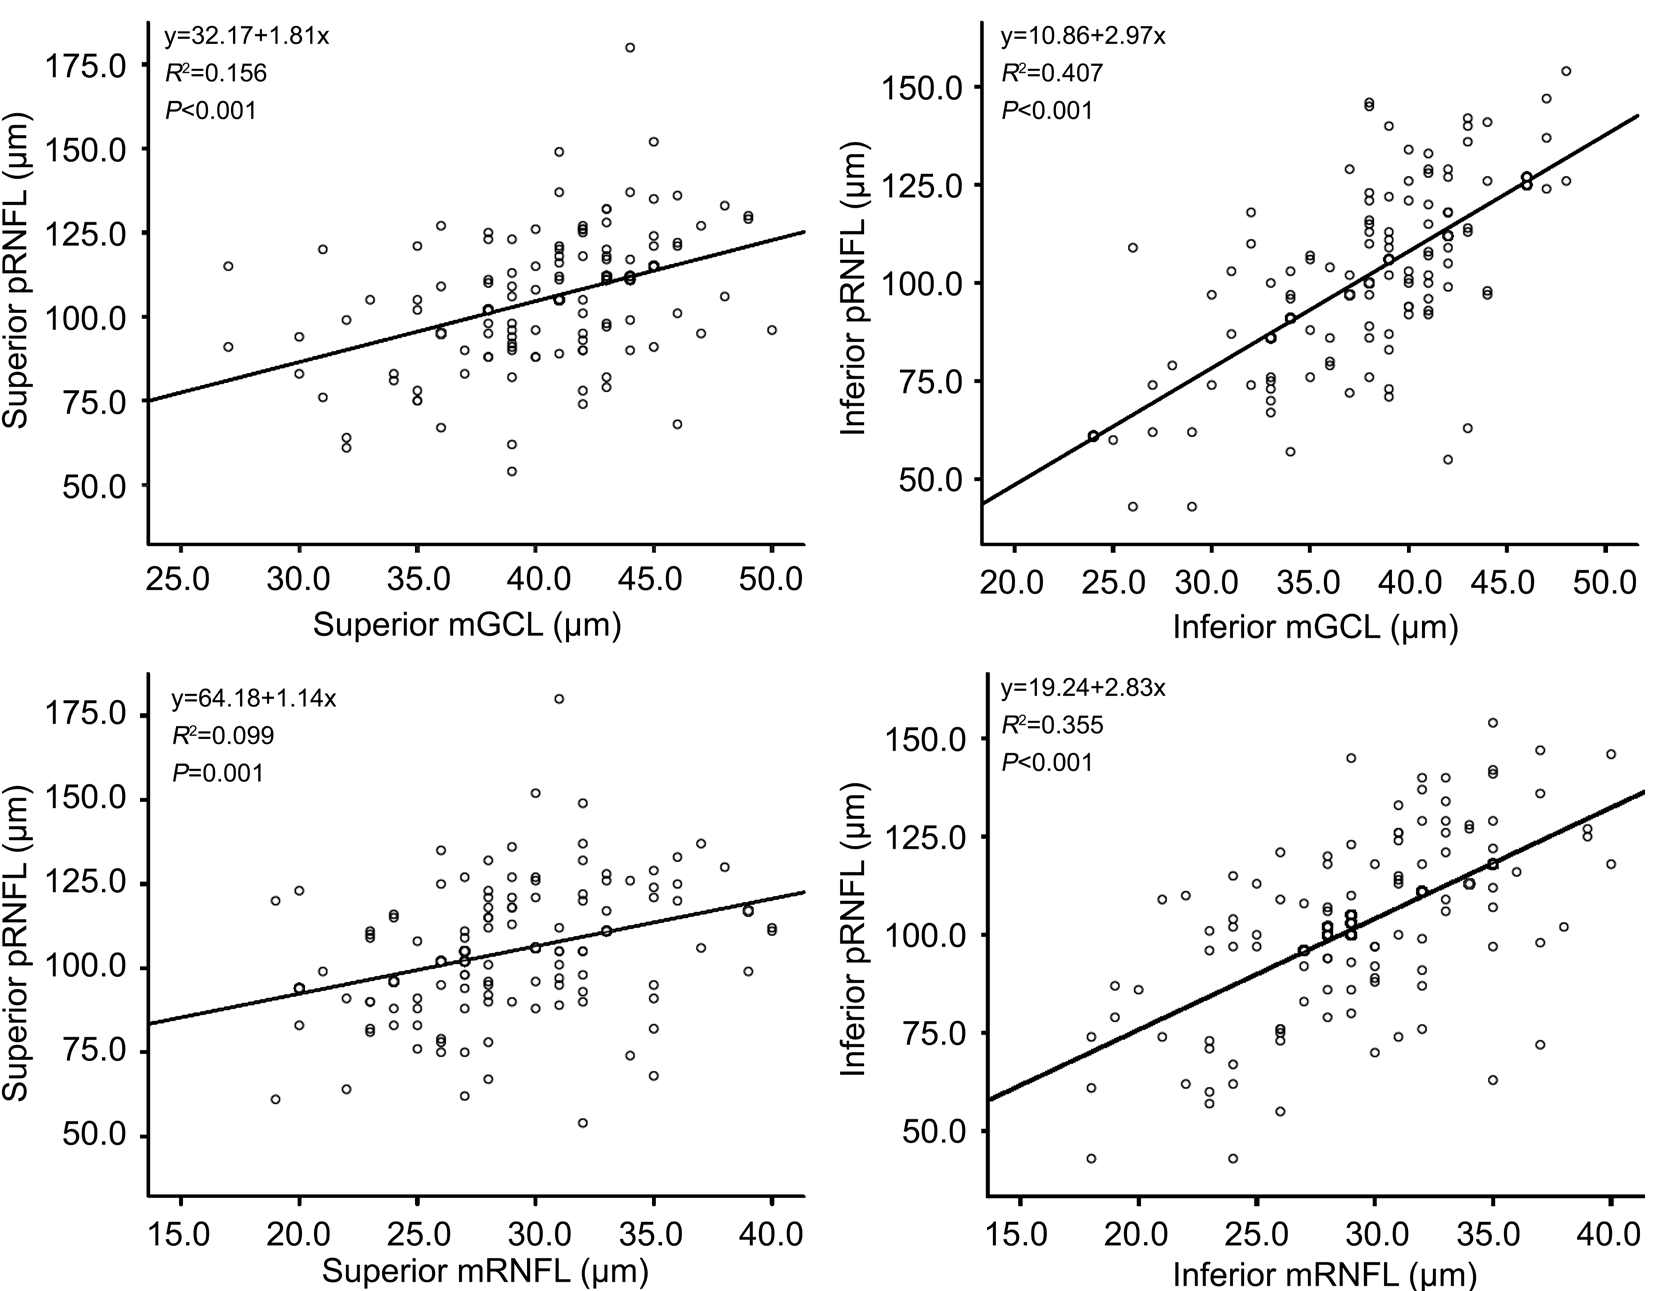
Figure 3 Correlations between pRNFL and mGCL, and between pRNFL and mRNFL in the superior and inferior quadrants pRNFL:Peripapillary retinal nerve fiber layer; mGCL: Macular ganglion cell layer; mRNFL: Macular retinal nerve fiber layer.
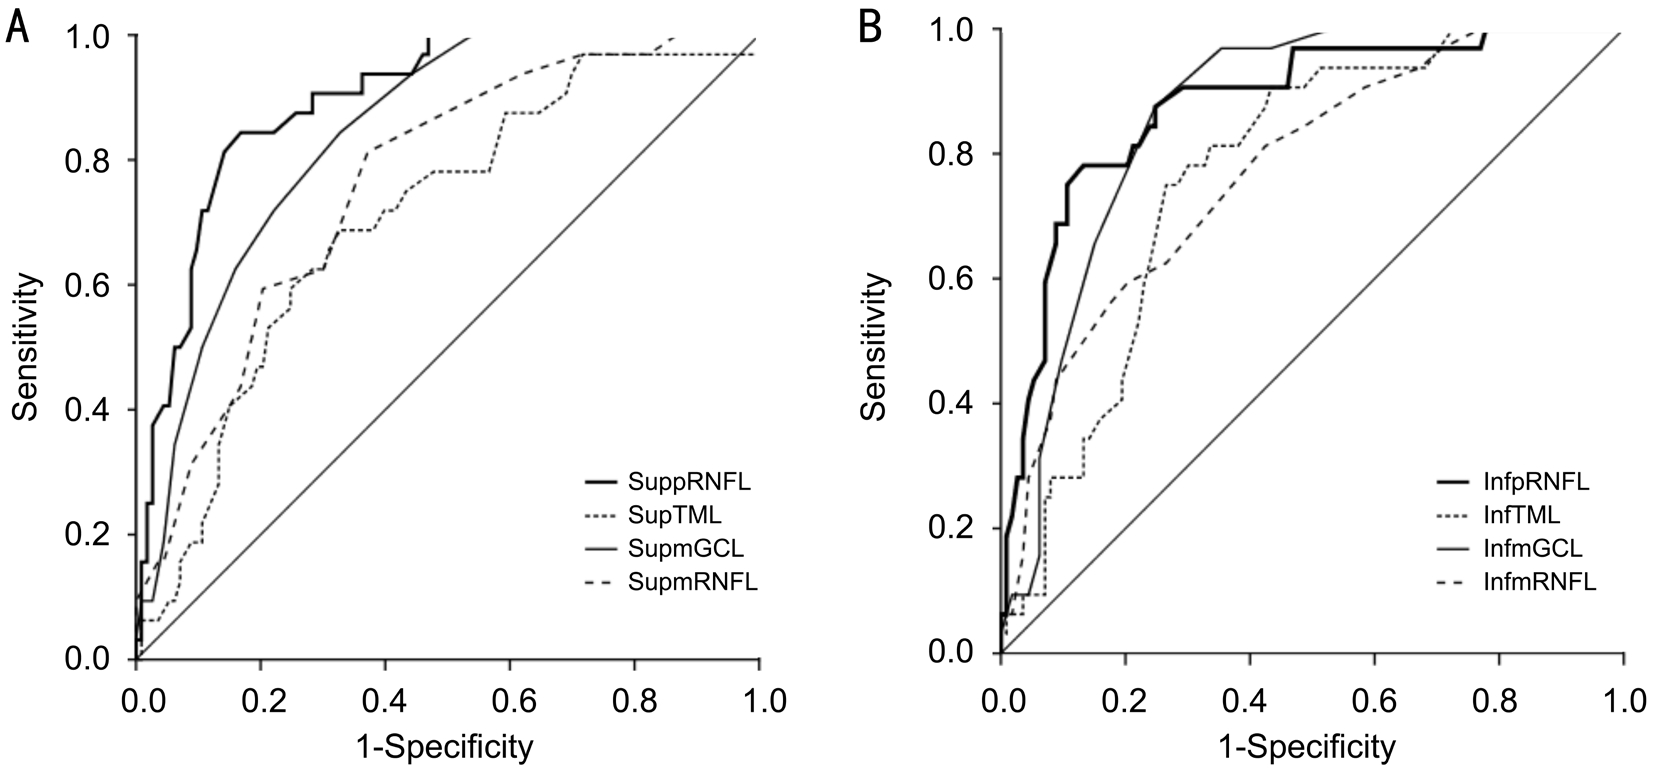
Figure 4 ROC curves of pRNFL and macular layer thicknesses in superior and inferior quadrants for discriminating between normal and glaucoma patients A: AROCs for superior quadrant thicknesses of pRNFL, TML, mRNFL and mGCL were 0.894, 0.706, 0.763, and 0.839, respectively; B: AROCs for inferior quadrant thicknesses of pRNFL, TML, mRNFL and mGCL were 0.879, 0.770, 0.775, and 0.864,respectively. sup pRNFL: Superior peripapillary retinal nerve fiber layer; sup TML: Superior total macular layer; sup mGCL: Superior macular ganglion cell layer; sup mRNFL: Superior macular retinal nerve fiber layer; inf pRNFL: Inferior peripapillary retinal nerve fiber layer; inf TML:Inferior total macular layer; inf mGCL: Inferior macular ganglion cell layer; inf mRNFL: Inferior macular retinal nerve fiber layer.
Table 3 Diagnostic capabilities for pRNFL, TML, mGCL and mRNFL for differentiating early glaucoma from normal eyes
pRNFL: Peripapillary retinal nerve fiber layer; mGCL: Macular ganglion cell layer; mRNFL: Macular retinal nerve fiber layer; Temp-sup: Temporal-superior; Temp-inf: Temporal-inferior; Nas-sup: Nasal-superior; Nas-inf: Nasal-inferior; SOM:Superior outer macula; SIM: Superior inner macula; IIM: Inferior inner macula; IOM: Inferior outer macula.
Parameters Sensitivity at 80%specificity Sensitivity at 90%specificity AROC curve (95%CI)pRNFL thickness Global 0.938 0.761 0.929 (0.887-0.972)Superior 0.844 0.677 0.894 (0.839-0.949)Inferior 0.781 0.688 0.879 (0.812-0.946)Temp-sup 0.899 0.636 0.905 (0.853-0.956)Nas-sup 0.500 0.406 0.787 (0.705-0.868)Temp-inf 0.799 0.521 0.876 (0.811-0.941)Nas-inf 0.625 0.427 0.773 (0.680-0.866)TML thickness SOM 0.469 0.188 0.706 (0.608-0.805)SIM 0.456 0.281 0.770 (0.689-0.851)IIM 0.438 0.167 0.694 (0.595-0.793)IOM 0.594 0.302 0.815 (0.743-0.887)mGCL thickness SOM 0.687 0.478 0.839 (0.773-0.906)SIM 0.768 0.480 0.864 (0.805-0.923)IIM 0.606 0.400 0.798 (0.722-0.874)IOM 0.867 0.636 0.881 (0.819-0.944)mRNFL thickness SOM 0.577 0.331 0.763 (0.676-0.850)SIM 0.574 0.455 0.775 (0.687-0.862)IIM 0.319 0.213 0.634 (0.526-0.742)IOM 0.725 0.602 0.845 (0.772-0.918)
Table 4 Comparison of AROCs between pRNFL and inner macular layer parameters by DeLong test
pRNFL: Peripapillary retinal nerve fiber layer; TML: Total macular layer; mGCL: Macular ganglion cell layer; mRNFL: Macular retinal nerve fiber layer; AROC:Area under the receiver operating characteristic curve.
AROC (95%CI)P Parameters pRNFL TML mRNFL mGCL pRNFL vs TML pRNFL vs mRNFL pRNFL vs mGCL TML vs mRNFL TML vs mGCL mRNFL vs mGCL Superior 0.894 (0.839-0.949)0.706 (0.608-0.805)0.763 (0.676-0.850)0.839 (0.773-0.906) 0.0008 0.018 0.174 0.289 0.0005 0.062 Inferior 0.879 (0.812-0.946)0.770 (0.689-0.851)0.775 (0.687-0.862)0.864 (0.805-0.923) 0.034 0.081 0.705 0.928 0.003 0.064
Significant structure-function relationships were found in eyes with glaucomatous damages. Leung et al[22]reported a strong association between MD and pRNFL thickness using the Stratus OCT. Horn et al[23]reported significant correlation between pRNFL thinning and VF defect as measured by SDOCT. Leite et al[24]found that the pRNFL thinning measured by SD-OCT was associated with correspondent visual field loss in early glaucoma. Ajtony et al[25]reported that the structurefunction relationship showed strong curvilinear regression in POAG eyes with PSD>1.9 dB and average pRNFL thickness below 70 µm, whereas no correlation was detectable above these values. Moreover, Greenfield et al[12]reported that macular thickness changes correlated with changes in visual function and pRNFL in glaucoma and may be an indicator of RGC loss. The mGCIPL and mGCC thicknesses were also reported to be correlated with the global or regional SAP sensitivity in glaucomatous eyes[13,26-27]. In this study, we found that the superior and inferior quadrants of mGCL were significantly correlated with MD. The structural damage in glaucoma occurs primarily in the RGC and the RGC bodies are predominantly located in the macula, so the structural change in the mGCL thickness significantly correlates with functional loss in VF of the early glaucomatous eyes. Though the thicknesses of pRNFL and mRNFL did not significantly correlated with MD in early glaucomatous eyes in this study,the diagnostic capability of a test becomes better as patients with more severe glaucoma are included.
The measurement of the pRNFL thickness has better diagnostic capability in distinguishing glaucomatous eyes from normal eyes than the measurement of TML thickness. Medeiros et al[28]reported that the pRNFL thickness and ONH assessments had better discriminating abilities than TML measurements. Leung et al[22]showed that the pRNFL thickness performed better than both TML and mRNFL thickness in glaucoma detection and visual function correlation. Bussel et al[29]reported that pRNFL thickness measurement was the most diagnostically accurate analysis for detecting glaucoma, though macular evaluation showed comparable performance. In this study, the pRNFL thickness measurements also had better discriminating abilities than the TML thickness measurements. Glaucomatous optic neuropathy mainly affected the RGCs and their axons. Some retinal layers are not involved in the glaucomatous damage process, so measurement of the TML thickness could reduce the sensitivity and specificity for glaucoma diagnosis.
Regarding the IML for glaucoma diagnosis, some studies reported that the glaucoma diagnostic capability of mGCC or mGCIPL is comparable or superior to that of pRNFL. Seong et al[9]showed that IML thickness had glaucoma discrimination ability comparable to that of pRNFL thickness in patients with early NTG. Jung et al[14]found that the minimum thickness of mGCIPL and the average thickness of pRNFL had the highest AROCs for glaucoma discrimination. Moreno et al[30]found that the mGCC had a similar or even a slightly better ability to discriminate between eyes with early glaucoma and healthy eyes compared to the pRNFL. Kim et al[31]reported that the diagnostic ability of mRNFL and mGCL for detecting glaucoma is high and comparable to that of pRNFL thickness.Chien et al[32]also found that mGCL appears to be as good as mGCC and mGCIPL in glaucoma diagnosis and the AROC of mRNFL was lower than that of mGCL. In this study, we found that the diagnostic capability of mGCL for detecting glaucoma was comparable to that of pRNFL, and both the diagnostic capabilities of mGCL and pRNFL were superior to that of TML in discriminating early glaucoma. The mGCL is composed predominantly of RGC bodies which are damaged in glaucoma, so measurement of mGCL thickness can have good diagnostic capability for detecting early glaucoma.
In this study, the thickness of the TML, mGCL and mRNFL in the inferior quadrant had higher AROCs than in the superior quadrant, and the thickness of the TML, mGCL and mRNFL in the inferior-outer sector also had higher AROCs than in the inferior-inner sector. Mechanism of glaucomatous damage is probably not the same between the upper and lower half of the optic disc. Macular damage is typically arcuate in nature and often associated with local thinning of RNFL which runs toward a narrow area of the disc. This area is susceptible to glaucomatous damage and located largely in the inferior quadrant of the disc[33]. The mRNFL in the inferior arcuate area project to the inferior vulnerable area of optic disc and can be affected in early glaucoma damage. The mRNFL in the superior macula and in the central area of the inferior macula project to the temporal quadrant of the optic disc are less susceptible to damage[33]. The structural vulnerability would have more evident effects in the lower half of the macula,so the inferior quadrants of TML, mGCL and mRNFL were susceptible to glaucomatous damage and had higher AROCs than the superior quadrants.
There were some limitations in our study. First, this study is limited by a small sample size. We have calculated the sample size needed for the one-way ANOVA with the three pairwise comparisons between groups. As from the previous data analyzed with thickness of pRNFL measurements of glaucoma patients, we calculated that a sample size of 31 patients for each group would have 80% power and an alpha level of 0.05(2-sided) to detect a minimum difference between population means at least 15.0 and a standard deviation of 18.0 among the POAG, NTG and healthy control groups. However, with the same estimates and a power of 85%, and an alpha level of 0.05, a sample size of 34 patients is needed for each group.Further studies with a larger sample size can be carried out to provide more statistical certainty. Second, we included only the Taiwanese population and the results might be different in different populations. Moreover, our study was a crosssectional evaluation for patients with early glaucoma. Patients with moderate and severe glaucoma may represent different changes in mGCL and mRNFL. Further studies include different stages of glaucoma are needed to identify the changes in the IML.
In conclusion, there were no differences in thickness parameters of pRNFL and IML between early stage of NTG and POAG. The diagnostic capability of the mGCL thickness was comparable to that of the pRNFL thickness in patients with early NTG and POAG. The inferior-outer sector of IML thickness had a better diagnostic capability than the inferior-inner sector of IML thickness for detection of early glaucoma.
ACKNOWLEDGEMENTS
The authors thank Dr. Hsin-Ching Lin and Mr. Evan Taylor for help in manuscript preparation.
Foundation:Supported by grants CMRPG8E1251 from Chang Gung Memorial Hospital, Taiwan.
Conflicts of Interest: Lin PW,None;Chang HW,None;Lin JP,None;Lai IC,None.
REFERENCES
1 Sung KR, Wollstein G, Kim NR, Na JH, Nevins JE, Kim CY, Schuman JS. Macular assessment using optical coherence tomography for glaucoma diagnosis.Br J Ophthalmol2012;96(12):1452-1455.
2 Melo GB, Libera RD, Barbosa AS, Pereira LM, Doi LM, Melo LA Jr. Comparison of optic disk and retinal nerve fiber layer thickness in nonglaucomatous and glaucomatous patients with high myopia.Am J Ophthalmol2006;142(5):858-860.
3 Shoji T, Sato H, Ishida M, Takeuchi M, Chihara E. Assessment of glaucomatous changes in subjects with high myopia using spectral domain optical coherence tomography.Invest Ophthalmol Vis Sci2011;52(2):1098-1102.
4 Van Buren JM.The Retinal Ganglion Cell Layer Spring fieldIL: Charles C Thomas; 1963:36-64.
5 Zeimer R, Asrani S, Zou S, Quigley H, Jampel H. Quantitative detection of glaucomatous damage at the posterior pole by retinal thickness mapping. A pilot study.Ophthalmology1998;105(2):224-231.
6 Medeiros FA, Zangwill LM, Alencar LM, Bowd C, Sample PA, Susanna R Jr, Weinreb RN. Detection of glaucoma progression with stratus OCT retinal nerve fiber layer, optic nerve head, and macular thickness measurements.Invest Ophthalmol Vis Sci2009;50(12):5741-5748.
7 Nakatani Y, Higashide T, Ohkubo S, Takeda H, Sugiyama K. Evaluation of macular thickness and peripapillary retinal nerve fiber layer thickness for detection of early glaucoma using spectral domain optical coherence tomography.J Glaucoma2011;20(4):252-259.
8 Tan O, Chopra V, Lu AT, Schuman JS, Ishikawa H, Wollstein G,Varma R, Huang D. Detection of macular ganglion cell loss in glaucoma by Fourier-domain optical coherence tomography.Ophthalmology2009;116(12):2305-2314.
9 Seong M, Sung KR, Choi EH, Kang SY, Cho JW, Um TW, Kim YJ, Park SB, Hong HE, Kook MS. Macular and peripapillary retinal nerve fiber layer measurements by spectral domain optical coherence tomography in normal-tension glaucoma.Invest Ophthalmol Vis Sci2010;51(3):1446-1452.
10 Parikh RS, Parikh SR, Thomas R. Diagnostic capability of macular parameters of Stratus OCT 3 in detection of early glaucoma.Br J Ophthalmol2010;94(2):197-201.
11 Tan O, Li G, Lu AT, Varma R, Huang D; Advanced Imaging for Glaucoma Study Group. Mapping of macular substructures with optical coherence tomography for glaucoma diagnosis.Ophthalmology2008;115(6):949-956.
12 Greenfield DS, Bagga H, Knighton RW. Macular thickness changes in glaucomatous optic neuropathy detected using optical coherence tomography.Arch Ophthalmol2003;121(1):41-46.
13 Kim NR, Lee ES, Seong GJ, Kim JH, An HG, Kim CY. Structurefunction relationship and diagnostic value of macular ganglion cell complex measurement using Fourier-domain OCT in glaucoma.Invest Ophthalmol Vis Sci2010;51(9):4646-4651.
14 Jung HH, Sung MS, Heo H, Park SW. Macular inner plexiform and retinal nerve fiber layer thickness in glaucoma.Optom Vis Sci2014;91(11):1320-1327.
15 Ctori I, Huntjens B. Repeatability of foveal measurements using spectralis optical coherence tomography segmentation software.PLoS One2015;10(6):e0129005.
16 Flammer J, Orgül S, Costa VP, Orzalesi N, Krieglstein GK, Serra LM,Renard JP, Stefánsson E. The impact of ocular blood flow in glaucoma.Prog Retin Eye Res2002;21(4):359-393.
17 Flammer J, Mozaffarieh M. What is the present pathogenetic concept of glaucomatous optic neuropathy?Surv Ophthalmol2007;52(Suppl 2):S162-S173.
18 Kubota T, Khalil AK, Honda M, Ito S, Nishioka Y, Inomata H.Comparative study of retinal nerve fiber layer damage in Japanese patients with normal- and high-tension glaucoma.J Glaucoma1999;8(6):363-366.
19 Firat PG, Doganay S, Demirel EE, Colak C. Comparison of ganglion cell and retinal nerve fiber layer thickness in primary open-angle glaucoma and normal tension glaucoma with spectral-domain OCT.Graefes Arch Clin Exp Ophthalmol2013;251(3):831-838.
20 Yamazaki Y, Koide C, Miyazawa T, Kuwagaki N, Yamada H.Comparison of retinal nerve-fiber layer in high- and normal-tension glaucoma.Graefes Arch Clin Exp Ophthalmol1991;229(6):517-520.
21 Kim NR, Hong S, Kim JH, Rho SS, Seong GJ, Kim CY. Comparison of macular ganglion cell complex thickness by Fourier-domain OCT in normal tension glaucoma and primary open-angle glaucoma.J Glaucoma2013;22(2):133-139.
22 Leung CK, Chan WM, Yung WH, Ng AC, Woo J, Tsang MK, Tse RK.Comparison of macular and peripapillary measurements for the detection of glaucoma: an optical coherence tomography study.Ophthalmology2005;112(3):391-400.
23 Horn FK, Mardin CY, Laemmer R, Baleanu D, Juenemann AM, Kruse FE, Tornow RP. Correlation between local glaucomatous visual field defects and loss of nerve fiber layer thickness measured with polarimetry and spectral domain OCT.Invest Ophthalmol Vis Sci2009;50(5):1971-1977.
24 Leite MT, Zangwill LM, Weinreb RN, Rao HL, Alencar LM, Medeiros FA. Structure-function relationships using the Cirrus spectral domain optical coherence tomograph and standard automated perimetry.J Glaucoma2012;21(1):49-54.
25 Ajtony C, Balla Z, Somoskeoy S, Kovacs B. Relationship between visual field sensitivity and retinal nerve fiber layer thickness as measured by optical coherence tomography.Invest Ophthalmol Vis Sci2007;48(1):258-263.
26 Cho JW, Sung KR, Lee S, Yun SC, Kang SY, Choi J, Na JH, Lee Y,Kook MS. Relationship between visual field sensitivity and macular ganglion cell complex thickness as measured by spectral-domain optical coherence tomography.Invest Ophthalmol Vis Sci2010;51(12):6401-6407.
27 Shin HY, Park HY, Jung KI, Park CK. Comparative study of macular ganglion cell-inner plexiform layer and peripapillary retinal nerve fiber layer measurement; structure-function analysis.Invest Ophthalmol Vis Sci2013;54(12):7344-7353.
28 Medeiros FA, Zangwill LM, Bowd C, Vessani RM, Susanna R Jr,Weinreb RN. Evaluation of retinal nerve fiber layer, optic nerve head, and macular thickness measurements for glaucoma detection using optical coherence tomography.Am J Ophthalmol2005;139(1):44-55.
29 Bussel II, Wollstein G, Schuman JS. OCT for glaucoma diagnosis,screening and detection of glaucoma progression.Br J Ophthalmol2014;98(Suppl 2):ii15-ii19.
30 Moreno PA, Konno B, Lima VC, Castro DP, Castro LC, Leite MT,Pacheco MA, Lee JM, Prata TS. Spectral-domain optical coherence tomography for early glaucoma assessment: analysis of macular ganglion cell complex versus peripapillary retinal nerve fiber layer.Can J Ophthalmol2011;46(6):543-547.
31 Kim HJ, Lee SY, Park KH, Kim DM, Jeoung JW. Glaucoma diagnostic ability of layer-by-layer segmented ganglion cell complex by spectraldomain optical coherence tomography.Invest Ophthalmol Vis Sci2016;57(11):4799-4805.
32 Chien JL, Ghassibi MP, Patthanathamrongkasem T, Abumasmah R, Rosman MS, Skaat A, Tello C, Liebmann JM, Ritch R, Park SC.Glaucoma diagnostic capability of global and regional measurements of isolated ganglion cell layer and inner plexiform layer.J Glaucoma2017;26(3):208-215.
33 Hood DC, Raza AS, de Moraes CG, Liebmann JM, Ritch R.Glaucomatous damage of the macula.Prog Retin Eye Res2013;32:1-21.
Correspondence to:Pei-Wen Lin. Department of Ophthalmology,Kaohsiung Chang Gung Memorial Hospital and Chang Gung University College of Medicine, 123, Ta-Pei Rd., Niao-Sung District, Kaohsiung 83301, Taiwan. lpw324@gmail.com
Received:2017-05-07 Accepted: 2017-09-28
Abstract ● AlM: To analyze the diagnostic capabilities of peripapillary retinal nerve fiber layer (pRNFL) thickness and segmented inner macular layer (lML) thickness measured by spectraldomain optical coherence tomography for detection of early glaucoma.● METHODS: Fifty-three patients with primary open angle glaucoma (POAG), 60 patients with normal tension glaucoma(NTG) and 32 normal control subjects were enrolled.Thicknesses of pRNFL, total macular layers (TML), and the lML, including macular RNFL (mRNFL) and macular ganglion cell layer (mGCL) were assessed. The areas under the receiver operating characteristic curves (AROC)were calculated to compare the diagnostic power of different parameters.● RESULTS: There were no differences in the parameters of pRNFL, TML, and lML between POAG and NTG groups.The thicknesses of superior and inferior mGCL showed significant correlation with mean deviation of visual field(R2=0.071, P=0.004; R2=0.08, P=0.002). The mGCL thickness significantly correlated with the pRNFL thickness in the superior and inferior quadrants (R2=0.156, P<0.001;R2=0.407, P<0.001). The thickness of the inferior-outer sector of macula had greater AROCs than those in the inferior-inner sector of macula. The AROCs for superior(0.894) and inferior (0.879) pRNFL thicknesses were similar with the AROCs for superior (0.839) and inferior mGCL(0.864) thicknesses. Sensitivities at 80% specificity for global pRNFL, inferior-outer mGCL and inferior-outer mRNFL thicknesses were 0.938, 0.867, and 0.725, respectively.● CONCLUSlON: The diagnostic capability of the mGCL thickness is comparable to that of the pRNFL thickness in patients with early glaucoma. The inferior-outer sector of lML has a better diagnostic capability than the inferiorinner sector of lML for detection of early glaucoma.
● KEYWORDS:retinal nerve fiber layer; ganglion cell layer;primary open angle glaucoma; normal tension glaucoma;optical coherence tomography
DOl:10.18240/ijo.2018.07.15
Citation:Lin PW, Chang HW, Lin JP, Lai IC. Analysis of peripapillary retinal nerve fiber layer and inner macular layers by spectral-domain optical coherence tomography for detection of early glaucoma. Int J Ophthalmol 2018;11(7):1163-1172