
Figure 1 Outer reflective bands on SD-OCT Band 1: ELM; Band 2: IS/OS; Band 3: Retinal pigment epithelium.
Jian-Wei Wang, Chuan-Hong Jie, Yong-Jian Tao, Ning Meng, Yuan-Chun Hu, Zheng-Zheng Wu,Wen-Jing Cai, Xi-Mei Gong
Eye Hospital, China Academy of Chinese Medical Sciences,Beijing 100040, China
Diabetic macular edema (DME) is a major cause of severe visual loss in diabetic patients[1]. The development of DME is due to the increased permeability of retinal vessels and the accumulation of extracellular fluid in the retina[2]. Macular evaluation of DME comprises morphological and functional assessment of the affected eye[3]. The determination of visual functional impairment in macular area of DME is mostly evaluated by best-corrected visual acuity (BCVA)[4]. However,BCVA may be inadequate for the quantitative and detailed assessment of visual functional impairment caused by macular edema. Therefore, to assess visual impairment, additional features of visual function must be evaluated. In recent years, with the advent of microperimetry (MP) examination technology, it is possible to evaluate the retinal sensitivity in macular edema area. It improves the quantitative analysis of macular function and provides detailed information in DME. MP realizes the combination of structural examination and function detection. By built-in an eye-tracking system,MP permits accurate, real-time monitoring fixation and automatically compensate eye movements, enabling the precise assessment of associations between retinal function and localized microstructural alterations[5-6]. The macular integrity assessment device (MAIA; CenterVue, Padova, Italy)is a new generation MP system. The visual sensitivity and fixation stability (FS) are measured by using 37 Goldmannstyle stimulus points within a 10° radius centered on the fovea[5,7]. It provides an additional parameter for clinicians to assess macula status: the macular integrity index (MI). This index is used to identify normal age-related reductions in sensitivity and integrates information regarding visual function and fixation by using stimuli below 26 dB. Higher values of MI suggest a greater possibility of abnormal findings, whereas lower values suggest a greater possibility of normal findings.Spectral-domain (SD) optical coherence tomography (OCT) is a non-invasive imaging modality that produces approximately histopathological images of the retina and neighboring structures[8]for microstructural visualization of the integrity of the external limiting membrane (ELM) and photoreceptor inner segment/outer segment (IS/OS) junction, as well as visualization of hard macular exudate deposition. Such detailed views are critical, as disturbances of these structures reflect both disruptions of the retinal photoreceptors and the deposition of hard macular exudates. Importantly, disruption of the integrity of the ELM and IS/OS junction plays a role in retinal dysfunction[9-10]. The deposition of hard macular exudates affects the visual acuity in patients with DME; visual impairment is related to the deposition of hard exudates in the foveal, which constitute early clinical signs of DR[11].
This study was undertaken to analyze macular function by using MAIA MP parameters and the morphological features of foveal photoreceptors, and to assess the association between morphological alterations and functional deficits as measured by OCT and MP in patients with DME.
We performed a prospective, non-controlled, open study of adult patients who were diagnosed with DME and managed at the Eye Hospital, China Academy of Chinese Medical Sciences. The study included 61 eyes of 38 consecutive patients who underwent examination between January 2016 and May 2017. Our study followed the tenets of the Declaration of Helsinki and was approved by the Eye Hospital Ethics Committee of China Academy of Chinese Medical Sciences. Informed consent was obtained from all participating subjects. All patients underwent a complete bilateral ophthalmic examination, including assessment of BCVA using the Early Treatment of Diabetic Retinopathy Study (ETDRS)chart. BCVA results were converted to the logarithm of the minimum angle of resolution (logMAR) scale.
Inclusion criteria were a diagnosis of DME, confirmed by a retinal specialist with contact lens biomicroscopy, and OCT findings indicating clinically significant macular edema,increased central retinal thickness (CRT), and the presence of fluid. Leakage on fluorescein angiography was also assessed to support the diagnosis of DME. Each patient presented with CRT≥250 μm, detected by SD-OCT. OCT scans were included in the study only if the signal strength was >6/10.
Main exclusion criteria were: 1) DME with vitreoretinal traction, proliferative DR, current or previous vitreous hemorrhage, no clarity of the optical media, intraocular surgery, and/or diseases of the retina other than DR (e.g.retinal vein occlusion or glaucoma); 2) acute in flammation or infection, previous vitrectomy, laser coagulation within the past 3mo; 3) glaucoma or ocular hypertension, retinal detachment,ocular trauma, or optic neuropathy; 4) high myopia (>-6.0 Dsph).SD-OCT was used to measure CRT by using the fast macular thickness mode of the standard device. CRT was calculated by extrapolating the diameter measurements as an average value within a circle with a 1000-μm diameter, centered in the fovea. SD-OCT images were obtained using a high-definition SD-OCT device (Cirrus HD-OCT4000, Zeiss, Germany).OCT produces high-resolution B-scan images by using a raster scanning technique, with an axial resolution of 5 μm,within a 6 mm×6 mm (20°×20°) area. Up to 20 000 scans were performed within 1s, producing one image of the retinal volume (512×128×1024), as well as high-resolution single images. Research software (Research Browser version V6.5,Carl Zeiss Meditec, Inc.) was used to extract CRT, including circular 1-, 3-, and 6-mm-diameter areas around the fovea.Central retinal volume (CRV) was calculated from a larger area of 20°×20°, with the midpoint centered on the fovea. By using the SD-OCT images, DME morphology, including the integrity of the ELM line and IS/OS junction, as well as the deposition of hard macular exudates, was assessed within a 1000-μm diameter, centered in the fovea. The IS/OS junction was defined as the hyperreflective line between the inner and outer segments of the photoreceptors, above the line representing the RPE and below the line representing the ELM[9](Figure 1). Both the status of the ELM and IS/OS junction and the deposition of hard macular exudates were analyzed by two independent researchers. When the interpretations were inconsistent, a third researcher was asked to analyze the OCT images. ELM and IS/OS junction status and the presence or absence of the deposition of hard macular exudates were recorded as binary data points (1 or 0, respectively)[9].
Figure 1 Outer reflective bands on SD-OCT Band 1: ELM; Band 2: IS/OS; Band 3: Retinal pigment epithelium.
MP was performed using MAIA (CenterVue, Padova, Italy).The maximum luminance in perimetry is predetermined by the laser source; in the MAIA system, this can reach 318.47 cd/m2.This luminance appears in ranges of attenuation from 0 to 36 dB,in steps of 1 dB. Background luminance is 1.27 cd/m2. The size of the stimulus is predetermined to be size III Goldmann type, and each stimulus is presented during a period of 200ms.Measures of sensitivity were obtained with the option Expert Exam, which consists of the use of a 4-2 staircase threshold strategy in a static examination. A standard predetermined grid was used for perimetry, with 37 projection positions distributed in three concentric circles (diameters of 2°, 6°, and 10°) of 12 points each, with a central point (Figure 2). After completing the examination, the results of sensitivity each position, as well as the AT, are provided and compared with a normative database included in the instrument software that classifies eyes as normal, suspect, or anomalous. The MAIA device measures MI, total AT, AT in each ETDRS grid area within 3000 μm, FS,and bivariate contour ellipse area [BCEA; the area in degrees squared (deg2) of the ellipse containing most of the fixation positions registered during the measurement procedure].BCEA is automatically calculated with 63% and 95% of the fixation points (A63 and A95, respectively) used in the system.For FS, P1 and P2 were defined as the percentages of fixation points within a circle of radius 1° and 2°, respectively[5].
Retinal thickness values and AT of the corresponding region are shown in Figure 2. On the OCT images, the diameters of the first and second circles were 1000 and 3000 μm,respectively. In MP, the diameters of the first, second, and third circles were 1000, 2000, and 3000 μm, respectively. Therefore,the region within the first circle of the SD-OCT image corresponded to 13 stimulus points within a 1000-μm diameter in MP. The region between the first and second circles of the SD-OCT image corresponded to the second and third circles of MP. Importantly, six stimulus points of the second and third circles in each quadrant (superior, nasal, inferior, and temporal quadrants) approximately corresponded to each area in the ETDRS grid.
Statistical AnalysisThe results were expressed as mean±standard deviation. The Kolmogorov-Smirnov test was used to examine whether the data were normally distributed. The independent-sample t-test was used to determine differences between the presence and absence of the integrity of the ELM,IS/OS junction, and deposition of hard macular exudates. The relationships between retinal thickness and AT in specific areas of the ETDRS grid were assessed with Pearson correlation analysis. The associations between central retinal sensitivity and CRT (with or without IS/OS) were assessed with Pearson correlation analysis. The relationships between the integrities of the ELM and IS/OS were assessed with Spearman correlation analysis. MI-related factors were analyzed using multiple linear regression analyses. A P value <0.05 was considered statistically significant. All analyses were performed using IBM SPSS Statistics for Windows, Version 22.0 (IBM Corp., Armonk, NY, USA).
Patient Clinical CharacteristicsIn total, 61 eyes of 38 patients were analyzed in this study. The clinical characteristics were as follows: age, 56.74±9.29y; sex, 18 males and 20 females;ELM defect, 25/61 eyes; IS/OS defect, 29/61; hard exudates,36/61; type of macular edema, five cystoid and 56 diffuse;baseline BCVA (logMAR), 0.60±0.37; total AT, 19.09±5.21 dB; AT within 1000-μm diameter, 18.25±5.95 dB; MI,96.43±8.73; P1, 48.41%±31.80%; P2, 74.18%±25.88%; 63%BCEA, 11.09±12.49 deg2; and 95% BCEA, 33.23±37.43 deg2.
Microperimetry Parameters According to Optical Coherence Tomography FindingsMP parameters according to the integrity of the ELM and IS/OS, as well as the deposition of hard macular exudates, in eyes with DME were shown in Table 1. Of the 61 eyes with DME, 29, 25, and 36 had ELM, IS/OS defects, and hard exudates, respectively. MI was significantly higher in eyes with disrupted ELM or IS/OS, compared with eyes with intact ELM and IS/OS. MI was not significantly different in the presence or absence of the deposition of hard macular exudates. Furthermore, the values of BCVA (logMAR), total AT, AT within 1000-μm diameter,P2, A63, A95, and CRT were significantly worse in eyes with disrupted IS/OS, compared with eyes with intact IS/OS. The values of BCVA (logMAR), AT within 1000-μm diameter, and CRT were significantly worse in eyes with disrupted ELM,compared with eyes with intact ELM. The above-mentioned parameters were not significantly different in the presence or absence of the deposition of hard macular exudates. CRV was not significantly different in the presence or absence of the integrity of ELM, IS/OS, or deposition of hard macular exudates.
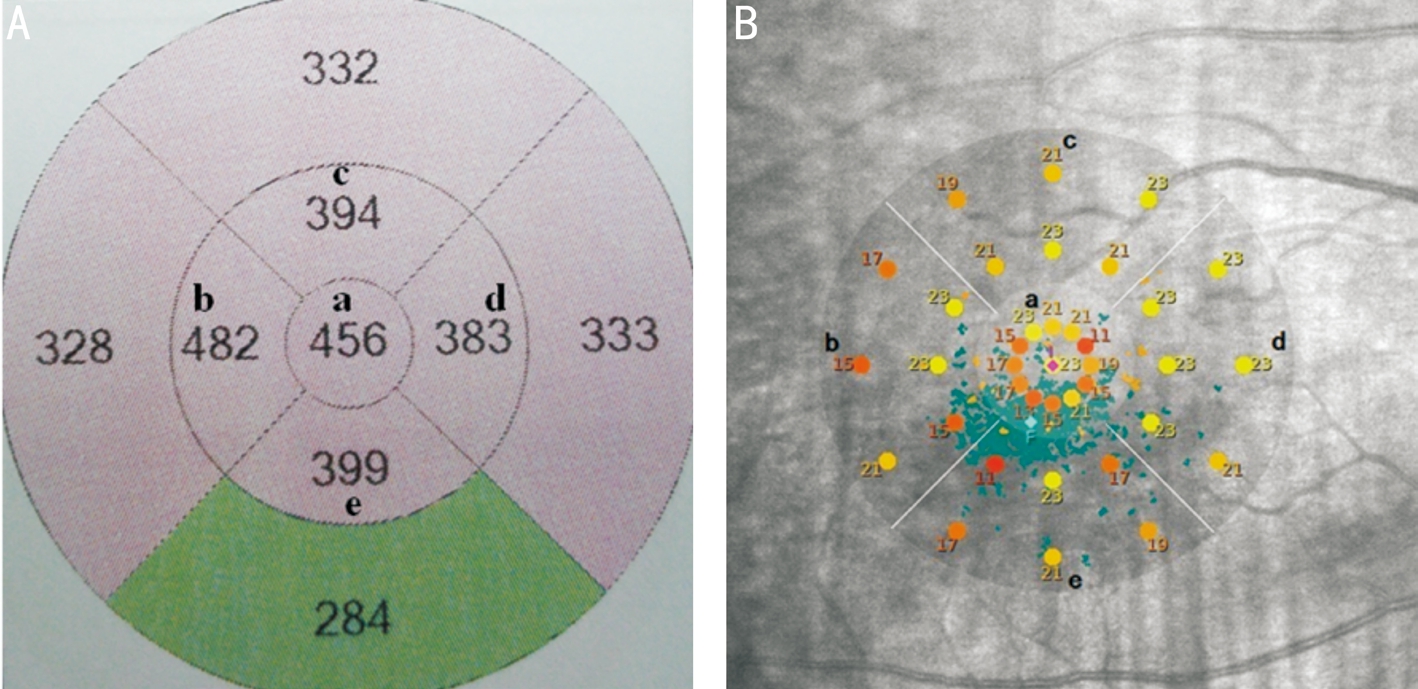
Figure 2 Retinal thickness values (A) and average threshold of the corresponding region (B)aFoveal center within a 1000-μm diameter;bTemporal to the foveal center;cSuperior to the foveal center;dNasal to the foveal center;eInferior to the foveal center. All areas are 1000 to 3000 μm.
Table 1 MP parameters, according to SD-OCT findings
MP: Microperimetry; SD-OCT: Spectral-domain optical coherence tomography; IS/OS: Inner segment/outer segment; BCVA: Best-corrected visual acuity; MI: Macular integrity index; CRT: Central retinal thickness; CRV: Central retinal volume.
Table 2 Correlation between retinal thickness and MP threshold of the corresponding region
Correlation Between Retinal Thickness and Retinal Sensitivity in Corresponding RegionRetinal thickness and retinal sensitivity in the corresponding region were shown in Table 2. At the center and at the nasal and temporal sectors of the fovea, significant negative correlations were observed between retinal thickness and AT of the corresponding area. At the inferior and superior sectors of the fovea, no correlations were observed between retinal thickness and AT of the corresponding area. Significant positive correlations were observed between CRT and logMAR BCVA (r=0.511,P=0.000).
Association of Retinal Sensitivity and CRT in Intact Versus Disrupted Inner Segment/Outer SegmentScatter plots of the relationship between retinal sensitivity within a 1000-μm diameter and CRT in the presence versus absence of the IS/OS are presented in Figure 3. In the intact IS/OS group, significant negative correlations were observed between CRT and retinal sensitivity within a 1000-μm diameter (r=-0.664, P=0.000). BCVA (logMAR) showed negative correlations with retinal sensitivity within a 1000-μm diameter (r=-0.775, P=0.000) and positive correlations with CRT (r=0.573, P=0.001). In the disrupted IS/OS group, there was no correlation between sensitivity and thickness (r=0.095,P=0.625), and between BCVA (logMAR) and CRT (r=0.367,P=0.05). BCVA (logMAR) showed negative correlations with retinal sensitivity within a 1000-μm diameter (r=-0.542,P=0.002).

Figure 3 CRT vs central retinal sensitivity A: IS/OS junction present; B: IS/OS junction absent.
Table 3 MI-in fluencing factors in multiple regression analyses
MI: Macular integrity index; IS/OS: Inner segment/outer segment.
Microperimetry-influencing FactorsMultiple linear regression analyses with CRT, CRV, deposition of hard macular exudates, DME type, ELM integrity, and IS/OS integrity as independent variables, and with MI as the response variable, revealed that IS/OS integrity was an independent factor affecting MI (Table 3). Spearman correlation coefficient was 0.875 (P=0.000) for the comparison of IS/OS and ELM integrity within the same eye.
Although BCVA testing is a gold standard for evaluating visual function, it only represents macular foveal function. Evaluation of the topographic sensitivity of the entire central retinal field provides more information. MP is a technique that enables the measurement of the achromatic luminance threshold in the central region of the retina, with simultaneous visualization of the fundus image. MP is widely used to characterize macular foveal or perifoveal pathologies in clinical practice[12], as this allows the analysis of the association between retinal sensitivity and retinal status for the corresponding area.Together with BCVA, MP results comprise the main functional outcome parameters[13]. Because new OCT techniques enable macular pathologies to visualize at the cellular level, OCT is more and more applied to study the microstructure of macular edema[14-16]. In this study, we analyzed the associations among BCVA, MP parameters, and OCT findings.
Previous studies have shown that the destruction of foveal IS/OS junction and ELM results in a declined BCVA[9]. Yohannan et al[9]demonstrated a correlation between IS/OS junction interruption and a significant retinal sensitivity decrease in eyes with DME. Reibaldi et al[17]found that the morphological characteristics of the foveal photoreceptor layer in the lamellar macular hole were consistently correlated with BCVA and central retinal sensitivity, and that preservation of the ELM was associated with the maintenance of visual acuity. We found that retinal sensitivity was significantly worse in eyes with disrupted ELM and IS/OS, compared with eyes with intact ELM and IS/OS. The current study revealed that retinal sensitivity is consistently in fluenced by ELM and IS/OS status in patients with DME. A recent study reported similar results among patients with DME[10]. We found that IS/OS and ELM in the same eye showed high correlation, indicating that these layers both reflect the severity of photoreceptor damage.
Studies have shown that the severity of hard exudates is directly related to visual impairment[18]. In this study, we attempted to assess retinal sensitivity within a 1000-μm diameter centered in the fovea affected by hard exudate deposition. Retinal sensitivity showed no significant difference in the presence or absence of hard macular exudate deposition. However, MP is a useful tool to evaluate the relationship between hard exudates and retinal sensitivity in DR. Retinal hard exudates and retinal thickening could lead to decreasing retinal sensitivity, but this was not related to the size of rigid exudates[18]. Hard exudates are due to microvascular abnormalities which produce the leakage of lipoprotein. Hard exudates are distributed in the outer plexiform layers of the retina. Massive hard exudates prevent the interaction between retinal nerve epithelium and retinal pigment epithelium, resulting in decreased visual acuity and reduced retinal sensitivity in the fovea[18]. In contrast to our study, Raman et al[18]compared to the different regions of the same eye; moreover, their sample size was small, at only 12 eyes. As retinal thickness in the area of hard exudate deposition ranged from 251 to 609 µm, reduced retinal sensitivity might be more likely due to the increased retinal thickness. We found that CRV showed no statistical difference, with respect to the presence or absence of the integrity of ELM and IS/OS,or the deposition of hard macular exudates. This may be due to the presence of edema in the macular central region that mainly affects the microstructure of the macular foveal areas,independent of the 20°×20° larger volume.
MP can be used to evaluate the relationship between retinal photoreceptor anatomical structure and retinal sensitivity in DME. We investigated the effect of retinal photoreceptor integrity on retinal sensitivity and analyzed the correlation between retinal thickness and sensitivity in patients with DME. We measured retinal sensitivity with MAIA MP. The largest stimulus attenuation range (0-36 dB) and the highest MP stimulus intensity (318.47 cd/m2) can be provided by the MAIA instrument alone. We found that in the intact IS/OS group,significant negative correlations existed between CRT and center AT; this result is identical to that of prior studies, where macular sensitivity varied according to retinal thickness[4,19-20].BCVA showed negative correlations with retinal sensitivity and positive correlations with CRT; this was consistent with the finding of our previous study[21]. However, when the local photoreceptor integrity was interrupted, the relationship between retinal thickness and sensitivity became weaker than when the local photoreceptor was intact. Such a relationship indicates that once the local photoreceptor integrity is interrupted, retina thickness is no longer a strong predictor of visual function. Further, local photoreceptor integrity was represented by the status of the IS/OS layer, may provide a strong predictor of local visual function throughout the retina.We analyzed the correlation between the AT and CRT in a 1000-μm diameter, centered in the fovea, as well as the correlation between retinal thickness and retinal sensitivity in corresponding region. We found significant negative correlations at the center, nasal and temporal sectors, of the fovea. However, no correlations were observed at the inferior and superior sectors of the fovea. Humans histopathologic studies have demonstrated that there were more ganglion cells in the nasal sector than in other areas[22]. The nasal retina is near the optic disc; therefore, nerve fibers from the optic disc to the macula are more abundant in this sector than in the other areas. Hence, we speculate that foveal nasal lesions may play a more important role on retinal functionality.
MI represents the percentage of threshold drop to measure local functional degradation. Thus far, few studies have compared MI with SD-OCT parameters. Our multiple linear regression models showed that IS/OS integrity may be an independent predictor for MI in eyes with DME. MI revealed the functional status in DME, reflecting the IS/OS juction status in the macula.
In summary, this study revealed that functional and morphological parameters were significantly related to the integrity of the IS/OS. Local photoreceptor integrity was represented by the status of the IS/OS layer, was a strong predictor of local visual function throughout the retina. MI revealed the functional status in DME, reflecting IS/OS juction status in the macula.In addition, the current study has several inherent limitations of the prospective, non-controlled trials. Moreover, there was the possibility of potential confounding factors in our analysis.We did not have sufficient data to control for or model the fluctuation of blood glucose levels, recurrence times of DME,prior treatments for DME, duration of DME and DR, or other ophthalmic conditions. Therefore, future studies that examine a larger number of patients are needed to confirm the association between macular microstructure and functional parameters.
Foundations:Supported by the Independent Subject of China Academy of Chinese Medical Sciences (No.ZZ0808008); the Independent Subject of the Eye Hospital of China Academy of Chinese Medical Sciences (No.201705); Key Research Project of the Capital Health Development Research Fund (No.2016-1-4181).
Conflicts of Interest: Wang JW,None;Jie CH,None;Tao YJ,None;Meng N,None;Hu YC,None;Wu ZZ,None;Cai WJ,None;Gong XM,None.
REFERENCES
1 Rayess N, Rahimy E, Ying GS, Bagheri N, Ho AC, Regillo CD, Vander JF, Hsu J. Baseline choroidal thickness as a predictor for response to antivascular endothelial growth factor therapy in diabetic macular edema.Am J Ophthalmol2015;159(1):85-91.e1-3.
2 Zhang X, Zeng H, Bao S, Wang N, Gillies MC. Diabetic macular edema: new concepts in patho-physiology and treatment.Cell Biosci2014;4:27.
3 Yang XL, Zou HD, Xu X. Correlation of retinal sensitivity, visual acuity and central macular thickness in different types of diabetic macular edema.Zhonghua Yan Ke Za Zhi2013;49(12):1081-1088.
4 Hatef E, Colantuoni E, Wang J, Ibrahim M, Shulman M, Adhi F, Sepah YJ, Channa R, Khwaja A, Nguyen QD, Do DV. The relationship between macular sensitivity and retinal thickness in eyes with diabetic macular edema.Am J Ophthalmol2011;152(3):400-405.e2.
5 Molina-Martín A, Piñero DP, Pérez-Cambrodí RJ. Fixation pattern analysis with microperimetry in nystagmus patients.Can J Ophthalmol2015;50(6):413-421.
6 Lupo S, Grenga PL, Vingolo EM. Fourier-domain optical coherence tomography and microperimetry findings in retinitis pigmentosa.Am J Ophthalmol2011;151(1):106-111.
7 Zhu X, He W, Sun X, Dai J, Lu Y. Fixation stability and refractive error after cataract surgery in highly myopic eyes.Am J Ophthalmol2016;169:89-94.
8 Fujihara-Mino A, Mitamura Y, Inomoto N, Sano H, Akaiwa K, Semba K. Optical coherence tomography parameters predictive of visual outcome after anti-VEGF therapy for retinal vein occlusion.Clin Ophthalmol2016;10:1305-1313.
9 Yohannan J, Bittencourt M, Sepah YJ, Hatef E, Sophie R, Moradi A, Liu H, Ibrahim M, Do DV, Coulantuoni E, Nguyen QD. Association of retinal sensitivity to integrity of photoreceptor inner/outer segment junction in patients with diabetic macular edema.Ophthalmology2013;120(6):1254-1261.
10 Shen Y, Liu K, Xu X. Correlation between visual function and photoreceptor integrity in diabetic macular edema: spectral-domain optical coherence tomography.Curr Eye Res2016;41(3):391-399.
11 Kim Y, Yu SY, Kwak HW. En face spectral-domain optical coherence tomography imaging of outer retinal hard exudates in diabetic macular edema based on optical coherence tomography patterns.Ophthalmic Surg Lasers Imaging Retina2016;47(4):313-321.
12 Markowitz SN, Reyes SV. Microperimetry and clinical practice: an evidence-based review.Can J Ophthalmol2013;48(5):350-357.
13 Hatef E, Hanout M, Moradi A, Colantuoni E, Bittencourt M, Liu H,Sepah YJ, Ibrahim M, Do DV, Guyton DL, Nguyen QD. Longitudinal comparison of visual acuity as measured by the ETDRS chart and by the potential acuity meter in eyes with macular edema, and its relationship with retinal thickness and sensitivity.Eye (Lond)2014;28(10):1239-1245.
14 Al Faran A, Mousa A, Al Shamsi H, Al Gaeed A, Ghazi NG. Spectral domain optical coherence tomography predictors of visual outcome in diabetic cystoid macular edema after bevacizumab injection.Retina2014;34(6):1208-1215.
15 Vujosevic S, Varano M, Egan C, Sivaprasad S, Menon G, Erginay A,Verbraak FD, Lund-Andersen H, Martinez JP, Jürgens I, Smets E, Coriat C, Wiedemann P, Ágoas V, Querques G, Holz FG, Nunes S, Alves D,Neves C, Santos T, Ribeiro L, Bandello F, Tejerina AN, Cunha-Vaz J,EVICR.net. Relevance of retinal thickness changes in the OCT inner and outer rings to predict progression to clinical macular edema: an attempt of composite grading of macular edema.Ophthalmic Res2015;55(1):19-25.
16 Heng LZ, Pefkianaki M, Hykin P, Patel PJ. Correction: Interobserver agreement in detecting spectral-domain optical coherence tomography features of diabetic macular edema.PLoS One2015;10(11):e0142023.
17 Reibaldi M, Parravano M, Varano M, Longo A, Avitabile T, Uva MG,Zagari M, Toro M, Boscia F, Boccassini B, Chiaravalloti A, Mariotti C,Reibaldi A. Foveal microstructure and functional parameters in lamellar macular hole.Am J Ophthalmol2012;154(6):974-980.e1.
18 Raman R, Nittala MG, Gella L, Pal SS, Sharma T. Retinal sensitivity over hard exudates in diabetic retinopathy.J Ophthalmic Vis Res2015;10(2):160-164.
19. Karacorlu M, Ozdemir H, Senturk F, Karacorlu SA, Uysal O.Correlation of retinal sensitivity with visual acuity and macular thickness in eyes with idiopathic epimacular membrane.Int Ophthalmol2010;30(3):285-290.
20 Okada K, Yamamoto S, Mizunoya S, Hoshino A, Arai M, Takatsuna Y. Correlation of retinal sensitivity measured with fundus-related microperimetry to visual acuity and retinal thickness in eyes with diabetic macular edema.Eye (Lond)2006;20(7):805-809.
21 Wang JW, Jie CH, Tao YJ, Wu ZZ, Zhang H. Correlation of macular visual function and macular central retinal thickness in diabetic macular edema eyes.Chin J Ocul Fundus Dis2017;33(3):267-270.
22 Curcio CA, Messinger JD, Sloan KR, Mitra A, McGwin G, Spaide RF. Human chorioretinal layer thicknesses measured in macula-wide,high-resolution histologic sections.Invest Ophthalmol Vis Sci2011;52(7):3943-3954.
Correspondence to:Chuan-Hong Jie. Eye Hospital, China Academy of Chinese Medical Sciences, Beijing 100040,China. jiechuanhong@163.com
Received:2017-08-24 Accepted: 2018-04-17
Abstract ● AlM: To respectively evaluate macular morphological features and functional parameters by using spectraldomain optical coherence tomography (SD-OCT) and macular integrity assessment (MAlA) in patients with diabetic macular edema (DME).● METHODS: This prospective, non-controlled, open study included 61 eyes of 38 consecutive patients with DME. All patients underwent best-corrected visual acuity(BCVA) measurement, MAlA microperimetry, and SDOCT. DME morphology, including central retinal thickness(CRT) and central retinal volume (CRV); integrity of the external limiting membrane (ELM) and photoreceptor inner segment/outer segment (lS/OS) junction; and the deposition of hard macular exudates were assessed within a 1000-μm central subfield area. MAlA microperimetry parameters evaluated were average threshold (AT)-retinal sensitivity, macular integrity index (Ml), fixation points within a circle of radius 1° (P1) and 2° (P2), and bivariate contour ellipse area considering 63% and 95% of the fixation points (A63 and A95, respectively).● RESULTS: Ml was significantly higher in eyes with disrupted ELM or lS/OS, compared with eyes with intact ELM and lS/OS. Values of BCVA (logMAR), total AT, AT within 1000-μm diameter, P2, A63, A95, and CRT were significantly worse in eyes with disrupted lS/OS, compared with eyes with intact lS/OS. The values of BCVA (logMAR),AT within 1000-μm diameter, and CRT were significantly worse in eyes with disrupted ELM, compared with eyes with intact ELM. These parameters were not significantly different between eyes with or without hard macular exudate deposition. CRV was not significantly different in the presence or absence of the integrity of ELM, lS/OS, or deposition of hard macular exudates. At the center, nasal and temporal sectors of the fovea, significant negative correlations were observed between retinal thickness and AT of the corresponding area. At the inferior and superior sectors of the fovea, no correlations were observed between retinal thickness and AT of the corresponding area. ln the intact lS/OS group, significant negative correlations were observed between CRT and central AT.There was no correlation between retinal sensitivity and thickness when the lS/OS layer was disrupted. Multiple linear regression analyses revealed that lS/OS integrity was an independent factor affecting Ml.● CONCLUSlON: Functional (BCVA and visual field)and morphological parameters (retinal thickness) were significantly associated with an intact lS/OS. Local photoreceptor integrity was a strong predictor of local visual function throughout the retina. Ml revealed the functional status in DME, reflecting the lS/OS juction status in the macula.
● KEYWORDS:diabetic retinopathy/complications; macular edema; visual fields; retina/physiopathology; optical coherence tomography
DOl:10.18240/ijo.2018.07.18
Citation:Wang JW, Jie CH, Tao YJ, Meng N, Hu YC, Wu ZZ,Cai WJ, Gong XM. Macular integrity assessment to determine the association between macular microstructure and functional parameters in diabetic macular edema. Int J Ophthalmol 2018;11(7):1185-1191