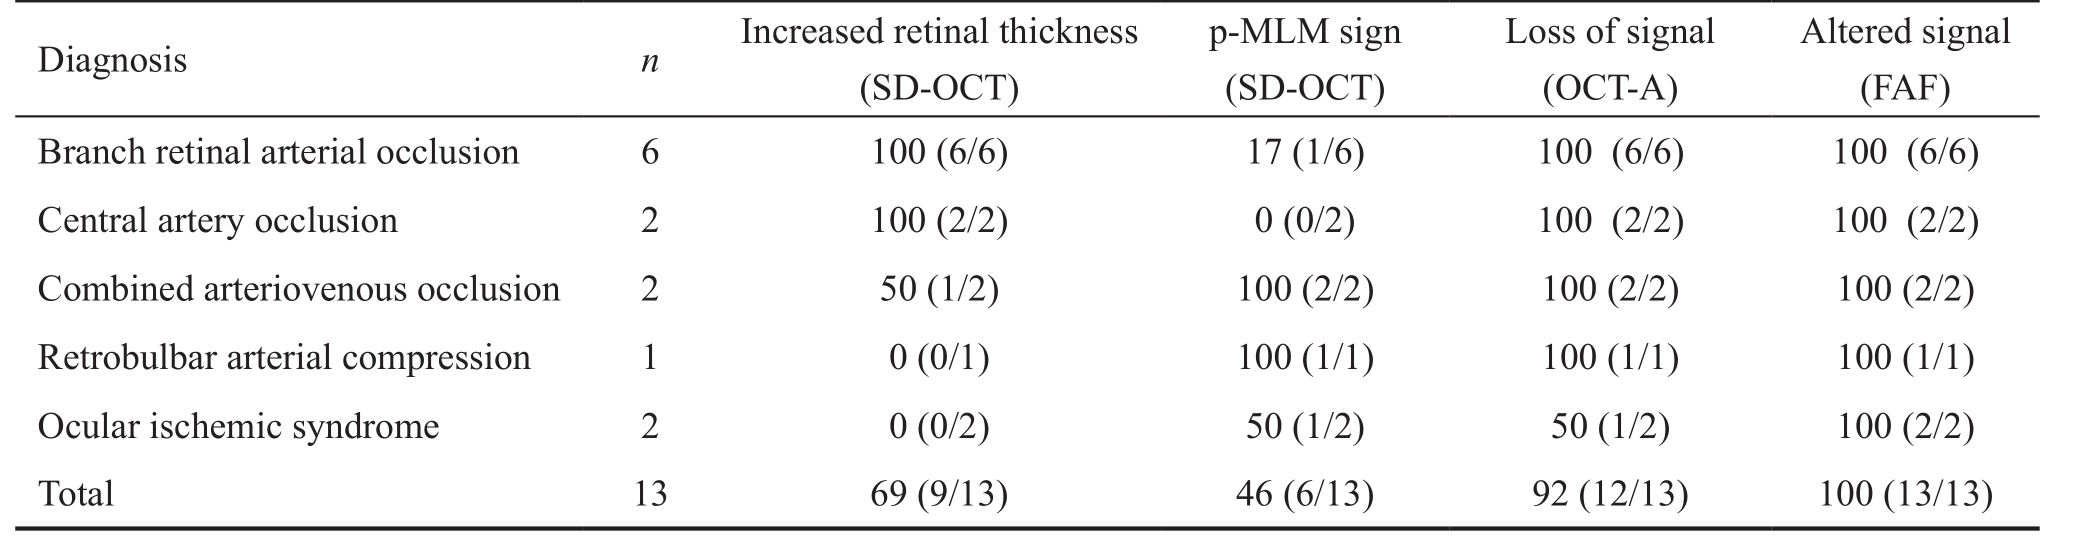
Table 1 Diagnostic findings of different imaging techniques stratified by diagnosis %
Nikolaus Feucht, Daniel Zapp, Lukas Reznicek, Chris P. Lohmann, Mathias Maier, Christian S. Mayer
Department of Ophthalmology, Technical University of Munich, Munich 81675, Germany
Abstract · AlM: To describe retinal findings of various imaging modalities in acute retinal ischemia.· METHODS: Fluorescein angiography (FA), spectral domain optical coherence tomography (SD-OCT), OCT-angiography (OCT-A) and fundus autofluorescence (FAF)images of 13 patients (mean age 64y, range 28-86y) with acute retinal ischemia were evaluated. Six suffered from branch arterial occlusion, 2 had a central retinal artery occlusion, 2 had a combined arteriovenous occlusions, 1 patient had a retrobulbar arterial compression by an orbital haemangioma and 2 patients showed an ocular ischemic syndrome.· RESULTS: All patients showed increased reflectivity and thickening of the ischemic retinal tissue. ln 10 out of 13 patients SD-OCT revealed an additional highly reflective band located within or above the outer plexiform layer. Morphological characteristics were a decreasing intensity with distance from the fovea, partially segmental occurrence and manifestation limited in time. OCT-A showed a loss of flow signal in the superficial and deep capillary plexus at the affected areas. Reduced flow signal was detected underneath the regions with retinal edema. FAF showed areas of altered signal intensity at the posterior pole. The regions of decreased FAF signal corresponded to peri-venous regions.· CONCLUSlON: Multimodal imaging modalities in retinal ischemia yield characteristic findings and valuable diagnostic information. Conventional OCT identifies hyperreflectivity and thickening and a mid-retinal hyperreflective band is frequently observed. OCT-A examination reveals demarcation of the ischemic retinal area on the vascular level. FAF shows decreased fluorescence signal in areas of retinal edema often corresponding to peri-venous regions.
· KEYWORDS: optical coherence tomography; optical coherence tomography-angiography; acute retinal ischemia; retinal morphology; retinal blood flow; multimodal retinal imaging
A sudden monocular visual loss is an ophthalmic emergency and requests immediate diagnosis and management.Ocular conditions causing transient or sudden visual loss are most frequently of vascular origin, and may result from emboli,hypoperfusion, vasospasm or venous congestion. Further assessment and search for potential causes focuses on the carotid arteries, ophthalmic arteries, the aortic arch, the heart and, rarely, hypercoagulable states [1-2] . Secondary prevention of ischemic events is often essential to avert recurrent events or further impairment. Usually, antiplatelet drugs are used in this context [3] .
Retinal hypoxia in the center of the macula results in a decreased visual acuity (VA). If marked hypoxia persists,irreversible structural changes in the macula occur and the disturbed VA is almost always not recovering. The natural course of retinal vascular occlusion is determined by the site and degree of the occlusion and to a wide extent also by the duration [4-6] . Histopathologically, acute retinal artery occlusion causes ischemia in the corresponding inner 2/3 of the retinal blood supply, marked by inner retinal edema in the initial stages and atrophy in long standing cases [7] . The outer 1/3 retinal segments are still perfused by oxygen diffusion from the choroid.
Spectral domain optical coherence tomography (SD-OCT)has been used to quantify and visualize changes in retinal thickness and structure by multiple authors. Acute branch retinal artery occlusion (BRAO) leads to an increase of focal retinal thickness in the area of obstruction especially of the inner retinal layers [8-9] .
Sectorial thinning of retinal layers has also been described in the literature for central [10] and branch [11] retinal arteryocclusion corresponding to an atrophy of the neurosensory tissue in long standing retinal artery occlusions. These changes can also be observed as intraretinal hyperreflective changes in OCT examination in the acute phase, followed by a decreased retinal thickness and atrophic inner retinal layers. The relatively new OCT-angiography (OCT-A) was additionally used to noninvasively provide flow information.
Table 1 Diagnostic findings of different imaging techniques stratified by diagnosis %
The purpose of this report is to describe morphologic findings observed with multimodal imaging [SD-OCT, fundus autofluorescence (FAF), OCT-A] in patients with acute retinal ischemia.
We exemplarily reported the observations of consecutive 13 patients (mean age 64y, range 28-86y), who presented to our outpatient clinic with acute onset of unilateral vision loss. The first symptoms had lasted 4 to 72h prior to the hospital visit.All patients described the symptoms as an acute and significant unilateral painless decrease of vision. All participants stated oral and written informed consent and do not received a stipend.Standard clinical examination was performed in all patients including history, VA and complete slit lamp examination with biomicroscopy of the fundus in mydriasis. All patients were checked up for internal alterations (hypertonia, diabetes, heartrhythm-changes, rheological alterations) and were additionally referred to the internal medicine department on the same day.In case of amaurosis fugax like symptoms with transient VA decrease, patients also underwent neurological evaluation after initial ophthalmological examination. Clinical examination revealed that of those 13 patients 6 suffered from BRAO,2 had a central retinal artery occlusion (CRAO), 2 had a combined arteriovenous occlusions, 1 patient had a retrobulbar arterial compression by an orbital haemangioma and 2 showed an ocular ischemic syndrome with clinically significant obstruction of the ipsilateral carotid artery. All patients were additionally examined with SD-OCT, FAF imaging and OCT-A at first presentation.
SD-OCT images were acquired with a combined SD-OCT and scanning laser ophthalmoscope (SLO) imaging system(Spectralis HRA+OCT ® ; Heidelberg Engineering, Heidelberg,Germany) using a linear cross hair scan and a 6 line radial (star shaped) scan of 6 mm length as standard settings. Additionally to the cross-sectional scans, the device simultaneously acquires FAF images as a mean of 10 scans. FAF pictures of all subjects were acquired using the 488 nm blue peak technology of the imaging system. Fluorescein angiography (FA) was performed with the same device using 2.5 mL of intravenous dye. FA was only used to verify diagnosis and define retinal ischemia and is not further elaborated in this assessment.
The OCT-A images were acquired with the AngioVue XR Avanti system (Optovue Inc., Fremont, CA, USA). The microvascular blood flow was visualized in the superficial capillary plexus, the deep capillary plexus, the outer retina and the choriocapillaris using the implemented SSADA ® algorithm for flow detection [12] . Institutional ethic approval for retrospective analysis was obtained.
Visual acuity ranged between 2.0 and 0.1 logMAR at the time of the first clinical examination. Fundus examination revealed retinal edema with a whitish appearance in the area of ischemic retina. Some focal intraretinal bleedings were noted in the 4 cases with combined arteriovenous occlusions or retinal ischemia syndrome. In 3 cases a white intravascular clot was noted at the affected artery, assumed to be the embolus. Table 1 showed the proportional distribution of the imaging findings by diagnosis.In SD-OCT imaging, the acute changes of reflectivity of the ischemic retina were seen predominantly in the inner retinal layers. Morphological changes of this retinal edema were characterized by a thickening of the affected retina and a loss of layered retinal structure approximately down to the outer plexiform layer. These changes affected almost exclusively the inner retinal layers. In contrast, the reflectivity of the outer layers of the retina was decreased in the acute stage whereas the non-affected retina presented with a normal thickness and reflectivity of the inner and outer retinal layers (Figure 1B and 1C).Additionally the SD-OCT images showed a continuous visualization of the prominent middle limiting membrane sign (p-MLM) (Figure 1A and 1D) in patients with ocular ischemic syndrome. Segmental hyperreflective inner retinal layers were seen in patients with reduced arterial blood flow(Figure 1A and 1D). These segments were best visualized between the outer plexiform layer (OPL) and ganglion cell layer (GCL) accentuated around peri-venous areas. A highly increased reflectivity of all inner retinal layers corresponding to the whitish retinal edema seen in funduscopy was detected in patients with a complete CRAO (Figure 1B) [13-14] . The outer retinal layers beginning with the outer nuclear layer were only partially visualized due to the shading effect of the inner retinal edema (Figure 1C). This alteration was observed in patients with BRAO regionally. The affected region of the occluded vessel showed thickening and hyperreflectivity of all inner retinal layers (Figure 1C). The p-MLM sign (Figure 1D)was not detectable in patients with CRAO due to the strongly increased reflectivity and thickness of the inner retinal layers that overshadow the visibility of the p-MLM sign [15] .
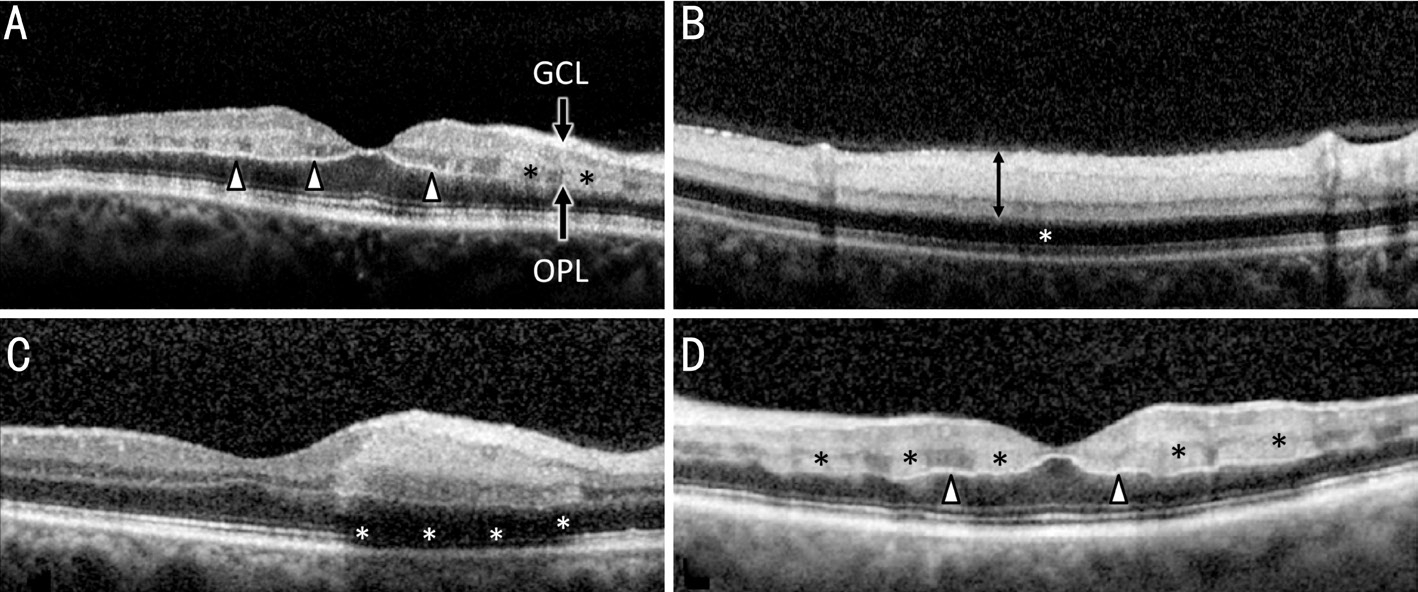
Figure 1 Cross sectional SD-OCT scans of 4 patients with acute retinal ischemia A: Continuous visualisation of the p-MLM (black arrows)in a patient with ocular ischemic syndrome, segmental hyperreflective inner retinal layers (stars), best visualized between OPL and GCL; B:Highly increased reflectivity of all inner retinal layers (double arrow) corresponding to the whitish retinal edema seen in funduscopy in a patient with CRAO. The outer retinal layers from the zone of the outer nuclear layer and photoreceptor cell layer (star) are weakly portrayed due to the shading effect of the inner retinal edema; C: Segmental thickening and hyperreflectivity of the inner retinal layers in one patient with BRAO.The signal under the retinal edema is strongly weakened (white stars) and the surrounding retina shows a regular structural morphology; D: In a patient with ocular ischemic syndrome the macular region shows a central p-MLM sign (white arrows) with decreasing definability towards the periphery. Additionally segmental hyperreflectivity of the inner retinal layers between OPL and GCL accentuated around perivenous areas (black stars) are visible.
A standardized software report of the imaging system was used for evaluation of the OCT-A imaging. The AngioVue ® software automatically reports 4 segmentation levels to show flow:superficial plexus (Figure 2A), deep capillary plexus (Figure 2B),outer retina (Figure 2C) and choriocapillary layer (Figure 2D).The area of non-perfusion was detectable in most patients in all layers. A loss of capillary density was most markedly seen in superficial and deep capillary plexus, whereas findings of the outer retina layer were most likely to be attributed to the alterations of the inner retina that projected altered flow patterns to the underlying levels of analysis [16] . The findings of OCT-A examination are exemplified in Figure 2 showing an eye with BRAO. The images of the superficial plexus showed the larger retinal arteries and veins in the well perfused area(Figure 2A). The loss of the smaller capillary network leads to the less perfused retinal blood supply in the ischemic affected area [17] . The capillary flow is below the limit of detection,but perfusion through the arterioles persisted. The OCT-A of the deep capillary plexus (Figure 2B) revealed a clearly demarked area of non-perfusion and loss of movement signal of the capillary network. The OCT-A signal of the outer retina yielded no usable signal in cases with BRAO. Analysis of the choriocapillary signal of OCT-A visualized a reduced signal intensity in the area of the artery occlusion. The area of reduced signal correlated to the regions of retinal edema and hyperreflectivity at the inner retinal layers and most likely represents a weakened signal that should not be attributed to a reduced choroidal blood flow. The loss of capillary network,delineation of the ischemic area and visualization of flow only in larger retinal vessels was best visualized in a summative en face analysis of all OCT-A images as seen in Figure 2E.
The high magnification rate of the OCT-A opens new possibilities in visualization of detailed changes in capillary perfusion. The hypoperfusion of the area of the lower temporal vessel arcade is detectable in all of the 4 automated segmentation levels inner capillary plexus, outer capillary plexus, outer retina and choriocapillary (Figure 2A-2D).
Changes in FAF pictures were mainly to be attributed to signal blockade of structures above the retinal pigment epithelium(RPE). In retinal ischemia the affected retinal tissue showed thickening and consecutively an increased light absorption of variable degree, which were seen in FAF by a weakened signal and darker areas (Figure 3C) compared to areas of normal autofluorescence signal (Figure 3C).
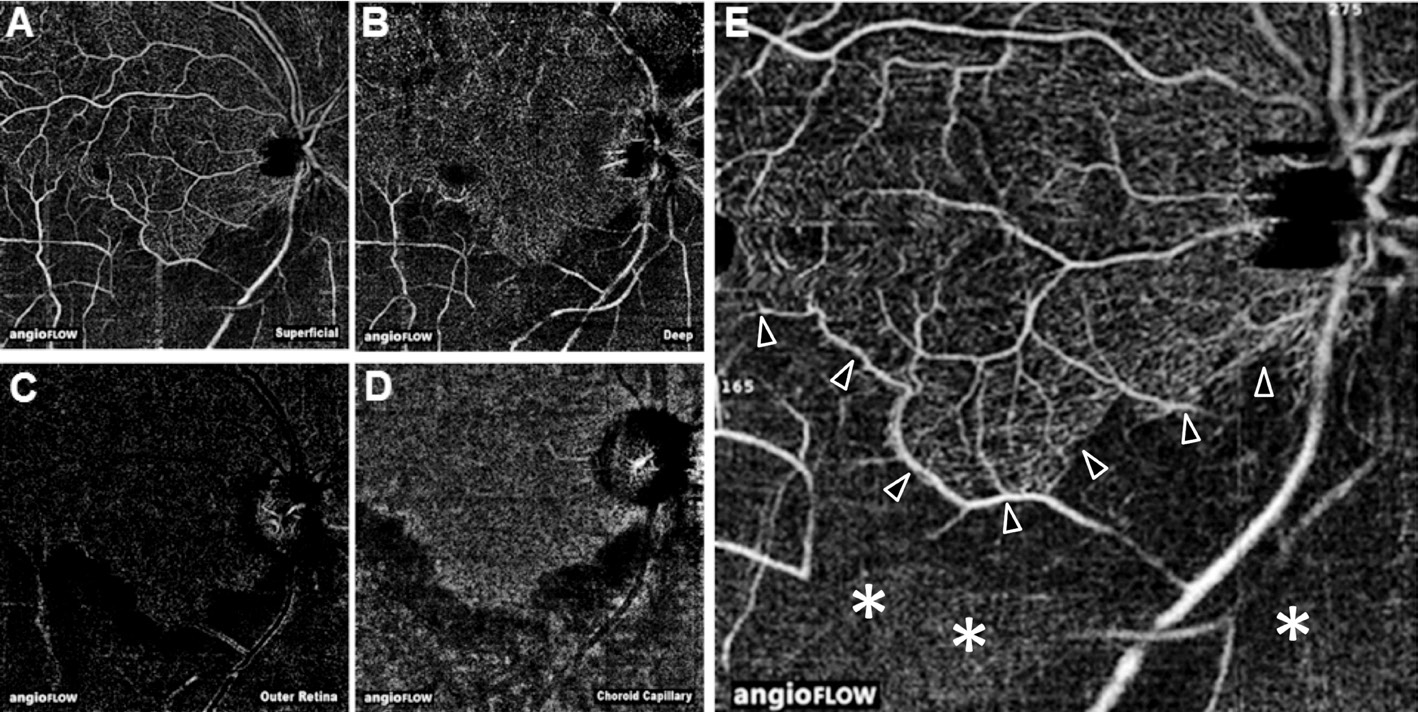
Figure 2 8×8-mm 2 OCT-A of a patient with BRAO and acute retinal ischemia A: OCT-A of the superficial plexus shows the larger retinal arteries and veins as well as a clearly delineated loss of the smaller capillary network in the lower hemisphere of the image corresponding to the post embolic blood supply area; B: OCT-A of the deep capillary plexus also shows a clearly demarcated area of non-perfusion and loss of movement signal of the capillary network; C: The OCT-A signal of the outer retina yields no usable signal in BRAO. The little visible signal is most likely attributed to artefacts; D: Analysis of the choroid capillary signal of OCT-A visualizes a reduced signal intensity in the area of the artery occlusion. The area of reduced signal correlates to the regions of retinal edema and hyperreflectivity at the inner retinal layers and represents a weakened signal that should not be attributed to a reduced choroidal blood flow; E: Loss of capillary network, delineation (arrows)of the ischemic area (white stars) and visualization of flow only in larger retinal vessels is best visualized in a summative en face analysis of all OCT-A images.

Figure 3 FAF (488 nm) of 4 patients with acute retinal ischemia A: A 27-year old female patient with retrobulbar haemangioma compromising ocular arterial bood flow. FAF shows a frosted branch like pattern at the posterior pole. Normal FAF signal is detected around arterial vessels (brighter grey); around perivenous areas reduced FAF signal is detected (darker grey) due to blockade phenomena of the inner retinal layers, which shadow the FAF signal of the RPE; B: Speckled blockade of FAF signal at the posterior pole by intraretinal blood in a patient with combined arteriovenous occlusion of retinal blood flow (stripe- and spot like blood); C: Focally reduced FAF signal (white star)in the supply area of an inferior temporal artery branch in a patient with BRAO. The intensity of the FAF signal shadowing correlates with the extent of inner retinal edema, normal FAF (black star). Note highly increased signal of the intravascular embolus (white arrow) at the inferior temporal artery branch most likely caused by calcium of the embolus; D: Detection of speckled FAF signal in a patient with macular ischemia after recanalized CRAO. The darker grey areas represent signal blockade of the inner retinal edema.
Some patients showed clearly defined areas of decreased FAF signal intensity in the ischemic regions. FAF also identified the intravascular clot in 3 patients with BRAO with strong autofluorescent material within the clot (Figure 3C). In patients with generalized hypoperfusion, FAF showed speckled regions at the posterior pole with normal and decreased FAF signals (Figure 3A and 3D). Peri-arterial regions appeared to show normal FAF signal due to the absence of blocked autofluorescence, whereas peri-venous regions showed decreased FAF signal intensity.These phenomena can be identified in SD-OCT pictures with multiple light absorbing segments in the B-scans (Figure 1A and 1D). If intraretinal bleeding was present, FAF showed dark speckled blockade of autofluorescence signal at the posterior pole. Figure 3B shows signal blockade by intraretinal blood in a patient with combined arteriovenous occlusion of retinal blood flow (stripe- and spot like blood).
Figure 4 shows multidimensional imaging in one patient with BRAO. Various aspects of the retinal changes in ischemic retina are highlighted.
A detail of the same patient is presented in Figure 5 with image acquisition at the exact locus of embolization. SD-OCT visualizes the intravascular obstruction (Figure 5G), flow signal intensity of the OCT-A scan is shown in an overlay of the corresponding B-scan in Figure 5F.
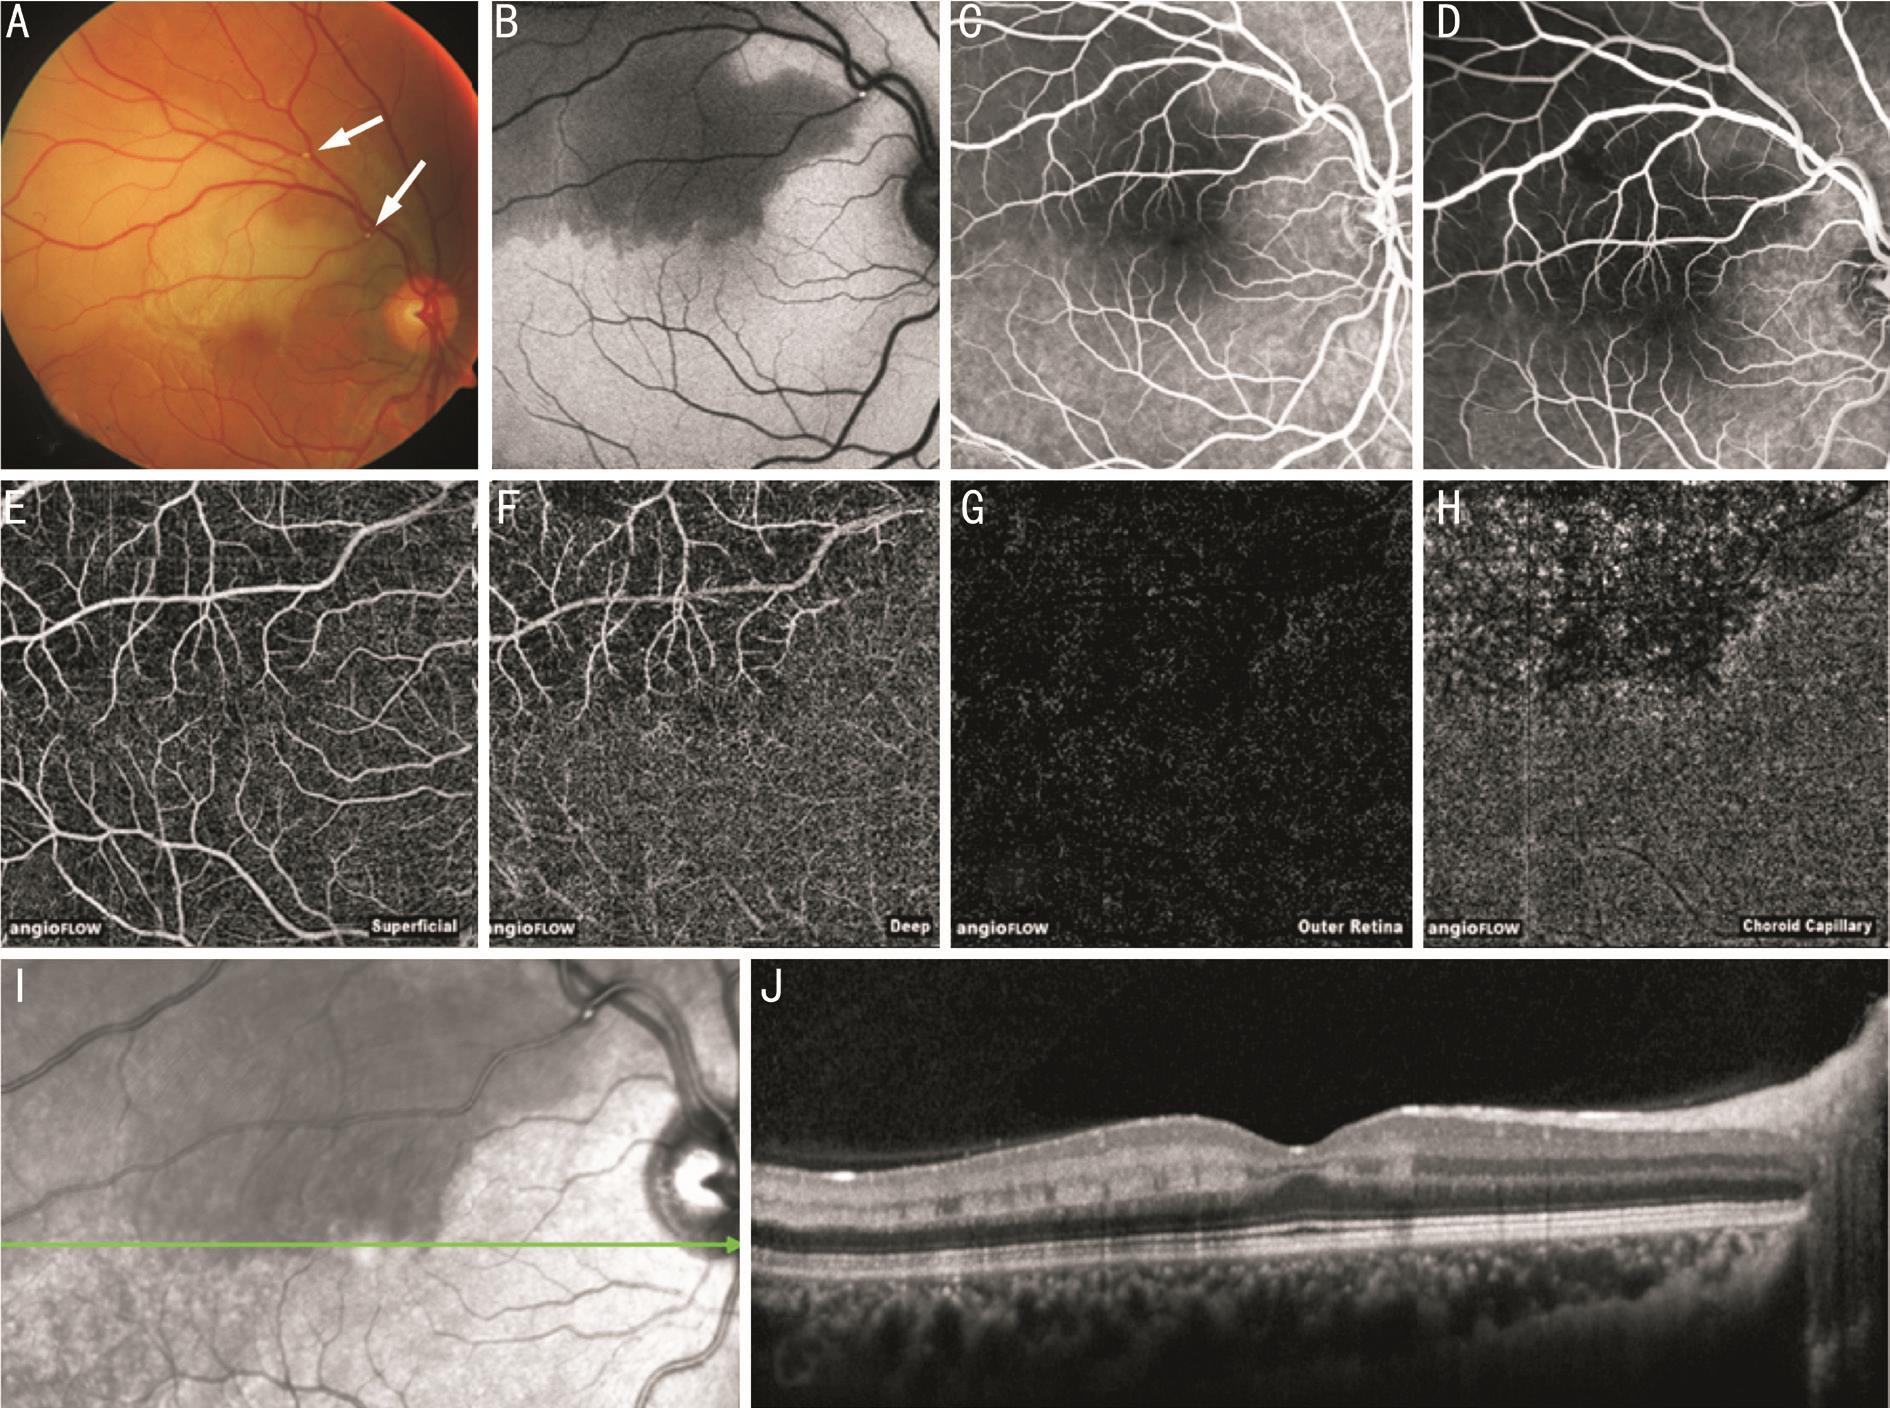
Figure 4 Patient 1, multimodal imaging in a patient with acute BRAO A: Fundus photography with retinal edema and visible embolization(arrows); B: FAF with decreased signal intensity in the area of the retinal edema and increased signal by the intravascular embolus; FA early (C)and late phase (D) show hypofluorescence without leakage at the superior temporal area; E: OCT-A delineates nearly regular superficial plexus;F: Deep retinal plexus with extensive loss of flow in the capillary network of the occluded supply area; G: No flow signal in the outer retina; H:Reduced flow signal in the choroid capillary due to signal blockade from the inner retinal layers; I: Infrared image; J: OCT shows segmental increased reflectivity from OPL to GCL in the ischemic regions.
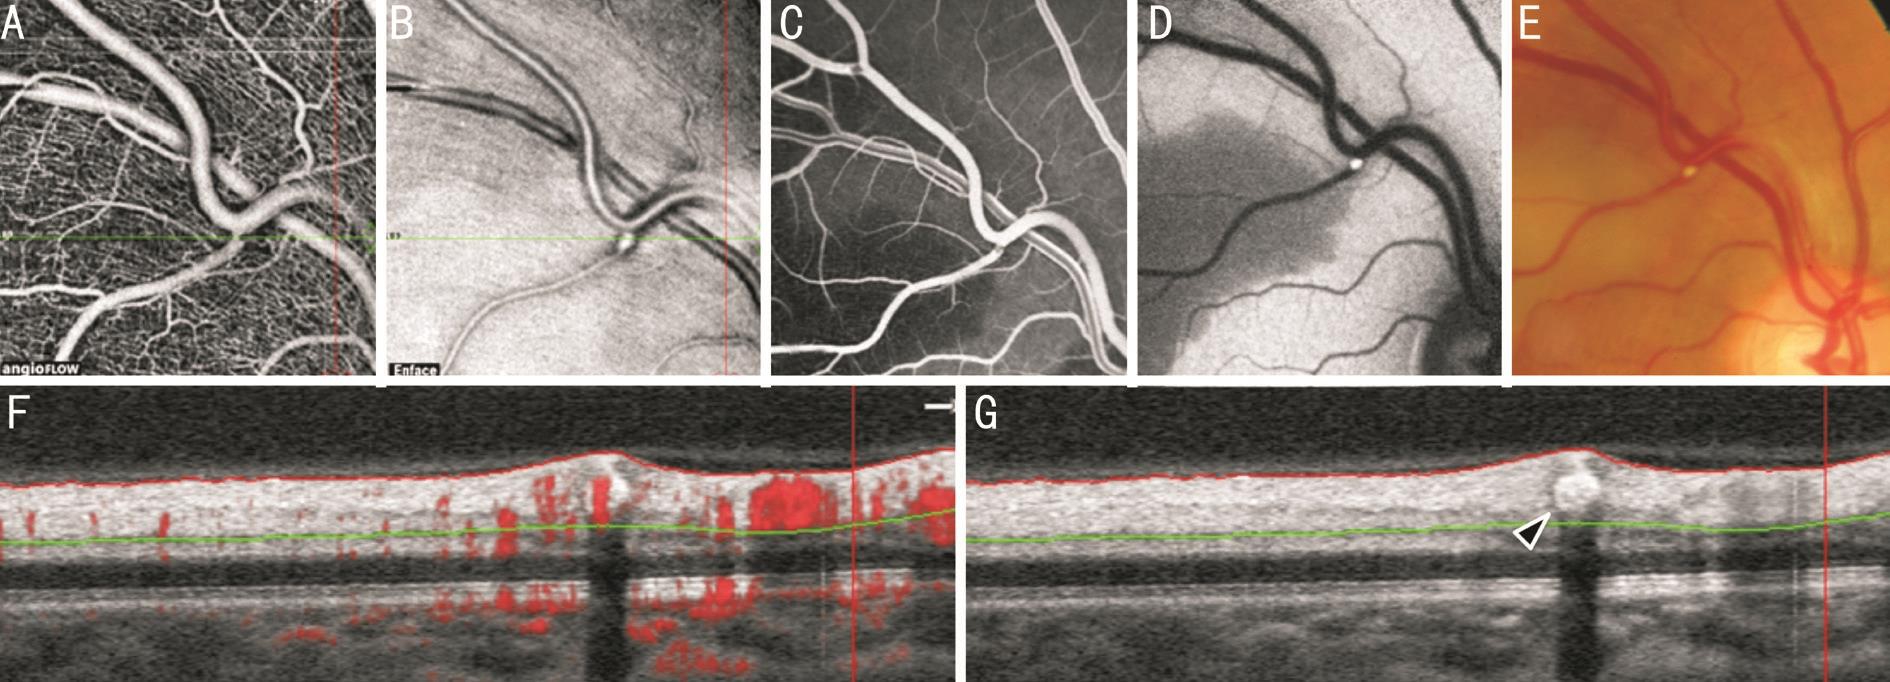
Figure 5 Detail of patient 1 A: OCT-A at the locus of embolization, discrete rarefication of flow signal in the superficial capillary network and at the vessel bifurcation; B: OCT en face reconstruction shows hyperreflective tissue and the intravascular clot; C: Fluorescein early phase; FAF(D) and fundus photography (E) allow identification of the affected retinal region and display the intravascular embolus; F: SD-OCT B-scan through the embolic vessel with flow signal intensity overlay in red and analysis range (between red and green line); G: Horizontal segmentation exactly through the embolization (arrow) and it’s shadow.
Patients reporting sudden visual loss symptoms need to be treated as ophthalmic emergencies. Multimodal retinal imaging supports the understanding of the complex and different aspects of retinal perfusion and its morphological alterations.SD-OCT was used to visualize changes of retinal morphology and reflectivity in patients with acute ischemic retina. Ischemic retina shows very specific alterations most markedly an increase in thickness and reflectivity seen in cross sectional OCT images of acute cases. Additionally, some cases show a hyperreflective band, especially if swelling is not too extensive.The observed hyperdense band (p-MLM sign) within the
OPL seems to represent a marker for retinal ischemia and can be observed even without the presence of a complete arterial or venous occlusion. It is conceivable that in these areas the lack of oxygen is greatest and the retinal ischemia is visible by increased absorption of light. This is supported by the only temporary presence of ischemic line because the swollen cells and nerve fibres decrease in size over time and end in atrophy [9-10] . The location of the band in the middle of the retina seems conclusive as this region may represent the location with the largest deficit of oxygen in an ischemic event,due to the dual blood supply through the choroid and central artery. We assume the band within the OPL at the transition of its dendritic and axonal part. Morphological characteristics of this hyperdense band were a decreasing intensity with distance from the fovea, partially segmental occurrence and a timely limited incidence. Similar findings could be observed in another previously published studies. These changes were observed temporarily and could not be detected in follow up visits after 2mo [9,18] .
The mid retinal localization of the band within the OPL seems to be conclusive in this context since the physiologic oxygenation of the neuronal retinal tissue of the eye is outstanding due to a natural lack of arterial collaterals and dual blood supply via choroidal and retinal arterial blood flow.This area could represent the locus of transition from retinal to choroidal oxygen supply where oxygen diffusion is weakest.
Special interest should be set on the fact that OCT is a snapshot,an in vivo examination that visualizes light reflectivity in the retinal layers, but a clear allocation of depicted structures to the cellular correlate is not always given.
Besides the neurosensory cells, the neural tissue of the retina contains supportive, peri-vascularly distributed cells including macrophages, and a specialized myeloid cell type, the microglial cell [19-20] .
We assume that the hyperreflective band we described here morphologically could represent activated microglial tissue induced by hypoxia driven upregulation of inflammatory molecules aimed at ischemia repair. Another possible explanation could give us the location of the hyperreflective band. The OPL can be subdivided into three parts, one broad outer Henle fibre layer (axonal OPL) and two thinner inner parts composed of synapses and interweaving neurites.Numerous desmosomes are visible in electron microscopic examinations in the inner portion of the OPL. These two inner parts form some kind of “middle limiting membrane” which acts as a barrier for fluids and exudates. Müller’s cells are involved in this barrier [21-22] .
We report our observations to contribute to the increasing exploration and understanding of the morphological and functional correlation in retinal diagnostics and to improve diagnosis of retinal ischemia.
The OCT-A is an additional imaging tool to show new aspects of morphological changes in vivo . Those consist of a very dense volume scan and therefore include the possibility to create en face reconstructions at any level of interest as well as to view each cross sectional B-scan conventionally. In acute retinal ischemia, OCT-A shows discrete rarefication of flow signal in the superficial capillary network and at the vessel bifurcation. A major limitation of the OCT-A is the lack of evidence of leakage and the impossibility to evaluate blood flow over time since only the information of fractions of a second are utilized to calculate an OCT-A image. The little visible signal of the outer retina is most likely attributed to artefacts and blockade from the inner retinal layers. Outer retinal structures are hidden beneath the less transparent inner retinal layers. Imaging acute perfusion deficits with additional OCT-A imaging revealed a clear demarcation of the ischemic retinal area on the vascular level best visualized within the deep capillary plexus. The possibility to identify the region of hypoperfusion seems to be comparable to conventional FA,especially the illustration of the small capillaries and the loss of capillary networks seems to be more contrasted in OCT-A than FA images. Nevertheless, the loss of time-relevant information in OCT-A images is a weakness of the technique. Therefore, FA may not be replaced for diagnosis and evaluation of blood flow relevant questions as it is the case in acute retinal ischemia.
FAF imaging yielded a very broad variety of phenotypes since the signal of FAF has its origin underneath the retina in the lysosomes of the RPE. Any overlying blockade diminishes the signal intensity. Alterations of FAF signal intensity are most likely to be attributed to a varying extent of blockade phenomena of the signal above the RPE. We observed reduced FAF signal in ischemic areas where retinal swelling and hyperreflectivity was seen in OCT. Additionally, we observed a distinctive diagnostic advantage of FAF when the blood flow was not completely discontinued. In those cases, the FAF images showed a frosted branch like pattern at the complete posterior pole between the vessel arcades or at the affected area in re-perfused BRAO. These alterations were less clearly visible in other imaging modalities.
The altered reflectivity in FAF and OCT faded out completely:FAF reflectivity disappeared by three weeks whereas increased reflectivity of inner retinal layers in OCT disappeared slightly prolonged by no later than seven weeks.
In conclusion, multimodal imaging in acute retinal ischemia provides in depth insight in retinal changes. If detected, specific findings such as the p-MLM sign in OCT or speckled, frosted branch-like alterations in FAF increase the understanding of each individual case and non-invasive OCT-A complements diagnostic assessment by providing information about extent and functional capillary status in acute retinal ischemia.
ACKNOWLEDGEMENTS
Conflicts of Interest: Feucht N, None; Zapp D, None; Reznicek L, None; Lohmann CP, None, Maier M, None; Mayer CS, None.
REFERENCES
1 Abraham S, Feucht N, Lohmann CP, Maier M. Ocular ischemic syndrome. Ophthalmologe 2015;112(8):679-681.
2 Hayreh SS, Zimmerman MB. Ocular arterial occlusive disorders and carotid arterydisease. Ophthalmol Retina 2017;1(1):12-18.
3 Cochard-Marianowski C, Lamirel C, Biousse V. Vascular transient monocular visual loss. J Fr Ophtalmol 2009;32(10):765-769.
4 Rehak J, Rehak M. Branch retinal vein occlusion: pathogenesis, visual prognosis, and treatment modalities. Curr Eye Res 2008;33(2):111-131.
5 Hayreh SS, Zimmerman MB. Fundus changes in branch retinal arteriolar occlusion. Retina 2015;35(10):2060-2066.
6 Pula JH, Kwan K, Yuen CA, Kattah JC. Update on the evaluation of transient vision loss. Clin Ophthalmol 2016;10:297-303.
7 Goldenberg-Cohen N, Dadon S, Avraham BC, Kramer M, Hasanreisoglu M, Eldar I, Weinberger D, Bahar I. Molecular and histological changes following central retinal artery occlusion in a mouse model. Exp Eye Res 2008;87(4):327-333.
8 Murthy RK, Grover S, Chalam KV. Sequential spectral domain OCT documentation of retinal changes after branch retinal artery occlusion. Clin Ophthalmol 2010;4:327-329.
9 Feucht N, Heine F, Lohmann CP, Mayer C, Maier MM. Morphological characteristics in sd-oct and fundus autofluorescence in different ischaemic retinopathies - characterisation of a new, temporary hyperreflective band. Klin Monbl Augenheilkd 2015;232(9):1054-1060.
10 Falkenberry SM, Ip MS, Blodi BA, Gunther JB. Optical coherence tomography findings in central retinal artery occlusion. Ophthalmic Surg Lasers Imaging 2006;37(6):502-505.
11 Ghazi NG, Tilton EP, Patel B, Knape RM, Newman SA. Comparison of macular optical coherence tomography findings between postacute retinal artery occlusion and nonacute optic neuropathy. Retina 2010;30(4):578-585.
12 Feucht N, Maier M, Lohmann CP, Reznicek L. OCT angiography findings in acute central serous chorioretinopathy. Ophthalmic Surg Lasers Imaging Retina 2016;47(4):322-327.
13 Ko J, Kwon OW, Byeon SH. Optical coherence tomography predicts visual outcome in acute central retinal vein occlusion. Retina 2014;34(6):1132-1141.
14 Moein HR, Novais EA, Rebhun CB, Cole ED, Louzada RN, Witkin AJ, Baumal CR, Duker JS, Waheed NK. Optical coherence tomography angiography to detect macular capillaryischemia in patients with inner retinal changes after resolved diabeticmacular edema. Retina 2017.
15 Browning DJ, Punjabi OS, Lee C. Assessment of ischemia in acute central retinal vein occlusion from inner retinal reflectivity on spectral domain optical coherence tomography. Clin Ophthalmol 2017;11:71-79.16 de Castro-Abeger AH, de Carlo TE, Duker JS, Baumal CR. Optical coherence tomography angiography compared to fluorescein angiography in branch retinal artery occlusion. Ophthalmic Surg Lasers Imaging Retina 2015;46(10):1052-1054.
17 Yu S, Pang CE, Gong Y, Freund KB, Yannuzzi LA, Rahimy E, Lujan BJ, Tabandeh H, Cooney MJ, Sarraf D. The spectrum of superficial and deep capillary ischemia in retinal artery occlusion. Am J Ophthalmol 2015;159(1):53-63.e1-2.
18 Chu YK, Hong YT, Byeon SH, Kwon OW. In vivo detection of acute ischemic damages in retinal arterialocclusion with optical coherence tomography: a "prominent middle limiting membrane sign". Retina 2013;33(10):2110-2117.
19 Zheng L, Gong B, Hatala DA, Kern TS. Retinal ischemia and reperfusion causes capillary degeneration: similarities to diabetes. Invest Ophthalmol Vis Sci 2007;48(1):361-367.
20 Joussen AM, Poulaki V, Le ML, Koizumi K, Esser C, Janicki H,Schraermeyer U, Kociok N, Fauser S, Kirchhof B, Kern TS, Adamis AP.A central role for inflammation in the pathogenesis of diabetic retinopathy. FASEB J 2004;18(12):1450-1452.
21 Fine BS, Zimmerman LE. Müller’s cells and the “middle limiting membrane” of the human retina. an electron microscopic study. Invest Ophthalmol 1962;1:304-326.
22 Kaur C, Sivakumar V, Yong Z, Lu J, Foulds WS, Ling EA. Bloodretinal barrier disruption and ultrastructural changes in the hypoxic retina in adult rats: the beneficial effect of melatonin administration. J Pathol 2007;212(4):429-439.
Citation: Feucht N, Zapp D, Reznicek L, Lohmann CP, Maier M,Mayer CS. Multimodal imaging in acute retinal ischemia: spectral domain OCT, OCT-angiography and fundus autofluorescence. Int J Ophthalmol 2018;11(9):1521-1527
Received: 2017-12-31 Accepted: 2018-07-23
DOl: 10.18240/ijo.2018.09.15
Correspondence to: Nikolaus Feucht. Department of Ophthalmology, Technical University of Munich,Ismaningerstr. 22, Munich 81675, Germany. Nikolaus.Feucht@mri.tum.de