Table 1 Baseline data of the studied group
Amal M Elbendary, Hossam Youssef Abouelkheir
Mansoura Ophthalmic Center, Mansoura University, Mansoura 35516, Egypt
Abstract · AlM: To categorize neovessels morphology and to detect response to anti-angiogenic therapy by using structural and angiographic modes of swept source optical coherence tomography (SS-OCT).· METHODS: Thirty-two eyes with neovessels at disc(NVD) and neovessels elsewhere (NVE) - as diagnosed by fluorescein angiography- were included. Cross sectional OCT images of disc and macular regions were registered to enface OCT angiography (OCTA), B-scan blood flow over lay and density maps. Three eyes received antiangiogenic treatment.· RESULTS: Pin point registration of cross-sectional OCT and OCTA images differentiated active NVD with vascular elements from fibrous or equivalent fibrovascular elements. En face images delineated NVE as vascular tufts or area of filling while cross-sectional images differentiated NVE from microvascular intraretinal abnormality (lRMA).All cases were associated with enlargement of foveal avascular zone and or areas of capillary non perfusion.Regressed NVD appeared as ghost vessel or pruned vascular loops after injection.· CONCLUSlON: Structural and angiographic modes of SS-OCT can detect, characterize and categorize the pattern of wide spectrum of neovessels based on blood flow data and density maps. lt is potentially useful to detect ischemic changes in the vascular bed and regression of NVD after therapeutic regimens providing substitute for invasive techniques.· KEYWORDS: optical coherence tomography; angiography;swept; proliferative diabetic retinopathy
Proliferative diabetic retinopathy (PDR) is a major cause of visual disability in patients with diabetic retinopathy including type 1 and type 2 [1] . It is characterized by presence of new vessels at disc (NVD) or new vessels elsewhere (NVE);both are precursors of recurrent vitreous haemorrhage and retinal detachment [2] .
In clinical practice fluorescein angiography (FA) is used for early detection of retinal and disc neovascularization and confirmation of their activity in response to various therapeutic modalities [3-4] . However, FA is invasive, requiring intravenous dye injection. It can cause undesirable side effects. It is current practice to avoid FA in pregnant and in people with allergy to dye [5] .
Spectral-domain optical coherence tomography (SD-OCT) has long been used as non-invasive tool for diagnosis, classification of diabetic macular edema (DME) and monitoring response to different therapeutic modalities [6-8] . Only few studies addressed the proliferative features of the disease. One study concluded that it is possible to image diabetic neovessels using SDOCT. However the study confirmed that neovascularization evolves along a continuing spectrum, with the vessels, retinal and vitreal changes observed at various stages of change [9] .Structural changes in retina and vitreous can be delineated with standard OCT, but information about blood vessels and blood flow cannot be provided [10] .
OCT angiography (OCTA) is a relatively new imaging modality that can generates in vivo images of retinal vasculature without dye injection [11] . This is potentially useful for noninvasive diagnosis and monitoring of diabetic retinopathy progression in clinical settings [12] . The recently introduced swept source OCT (SS-OCT) uses a short cavity swept laser with a tunable wavelength of 1050 nm and has an axial resolution of 5.3 µm and an axial scan rate of 100 000 scans per second. It offers higher imaging speeds, increased penetration, higher detection efficiencies, improved imaging range with reduced sensitivity roll-off. These advantages of SS-OCT make it a very useful diagnostic tool to perform OCTA [13-15] .
The aim of this work is to categorize neovessels morphology in PDR and to detect response to anti-angiogenic therapy using structural and angiographic modes of SS-OCT.
This cross-sectional observational study was conducted at Mansoura Ophthalmic Center, Mansoura University between May 2016 and May 2017. The study was approved by the institutional review board of Mansoura University and was performed in adherence with the tenets of the Declaration of Helsinki.
Inclusion Criteria Patients with proliferative diabetic changes including NVD and NVE as diagnosed by FA with or without clinically significant DME were included. Some patients were scheduled for anti-vascular endothelial growth factor (anti-VEGF) treatment for associated DME (treatment protocol followed national-based granted regimen in which diabetic patients receive anti-VEGF if they have associated DME).NVD was defined as new vessels located at or within 1 disc diameter from disc margin, and NVE was defined as new vessels located outside this area.
Exclusion Criteria Patients with poor fixation precluding sufficient quality OCTA angiogram, patients with vitreous hemorrhage causing hazy media or advanced PDR causing tractional retinal detachment, other stages of diabetic retinopathy, patients with associated hypertensive or renal retinopathy, age related macular degeneration, uveitis and glaucoma were excluded. In addition, patients who received anti-VEGF treatment were excluded if they do not attend postoperative OCTA imaging.
All Patients Underwent Complete ophthalmic examination,including best-corrected visual acuity (BCVA), intraocular pressure measurement, lit-lamp biomicroscopy, fundus photography, FA and SS-OCT.
Imaging with Swept Source-OCT Imaging was performed with SS-OCT at 100 000 A-scans per second (DRI triton OCT, Topcon, Tokyo, Japan) in all diseased eyes. In structural mode, volumetric 6 mm×6 mm OCT scans of 256 (A-scans)×512 (B-scan positions) were performed and centered on optic nerve head (ONH) to detect NVD and macular region to detect NVE or associated macular edema. High quality OCT structural images are generated by averaging registered B-scans. Automated segmentation of retinal layer boundaries is performed on OCT structural images.
In angiographic mode, All scans were acquired over a 3 mm×3 mm field of view in about 3s of total OCT scan time. Scans of 4.5 mm×4.5 mm were acquired if NVD extends significantly beyond disc margin or if patient fixation is insufficient to delineate disc region. For NVE, 9 mm×9 mm scan was used to cover the region of arcades. GeneratedOCT angiogram were evaluated for NVD in vitreous scans,superficial scans of optic nerve vasculature and radial peripapillary capillaries. In addition, composite images of blood flow overlay on cross-sectional OCT and blood vessel density maps were evaluated. For NVE and intraretinal microvascular abnormalities (IRMA), en face images of superficial capillary plexus and deep capillary plexus were examined. The inner boundary of superficial capillary plexus was extended to NVE area as segmentation techniques of the macula do not include vitreous scans as default. Motion artifacts are suppressed by selectively averaging over multiple B-scan combinations. En face projections allow visualization of vascular details within segmented retinal layer boundaries.
Table 1 Baseline data of the studied group
The study included 32 eyes of 28 patients (15 males, 13 females).Mean age was 57 (ranged from 44 to 67)y. Duration of diabetes ranged from 10 to 20 (mean: 16)y. Mean Haemoglobin A1c was 8.4 (range: 7.2 to 12). Twenty eyes had NVD, four eyes had NVE, four eyes had both NVD and NVE. Table 1 reveals baseline data of studied group. FA confirmed the presence and activity of neovessels in all eyes. Neovessels detected on crosssectional (structural) OCT images were co-registered with OCTA en face frames, density maps and B-scan blood flow overlay.
On co-registered cross-sectional OCT angiograms, flow signal within retinal vasculature was represented by red color and within choroidal vasculature by purple color, while signal intensity from structural OCT was shown in gray scale. This composite overlay image allowed more precise correlation between structural data (location, extension of neovessels) and angiographic data (blood flow).
OCTA could detect all cases of NVD. Only one eye with NVE on FA, was not detected on OCTA. The appearance of active NVD was classified according to fundus photography and FA into active NVD lesions with vascular component (20 eyes),active NVD lesions with equivalent fibrovascular elements (4 eyes) and NVD with fibrous component (8 eyes). The three patterns of NVD showed distinct vascular features on OCTA.In 15 eyes, area of NVD could be measured. Mean area of NVD ranged from 315 mm 2 to 9200 mm 2 (mean: 1257 mm 2 ).All cases were associated with enlargement of foveal avascular zone (FAZ) and/or areas of capillary non perfusion (detected on density maps) around the disc and in the macular region.Mean area of superficial and deep FAZ was 789 µm and 1854 µm respectively.
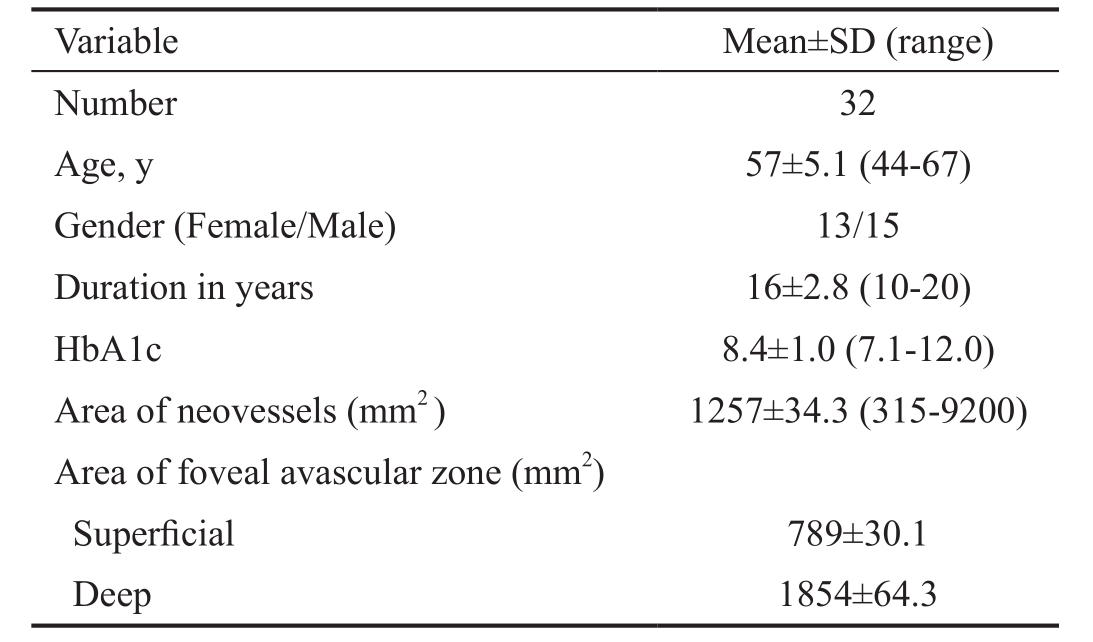
Imaging of New Vessels at Disc The three patterns of NVD were clearly distinguished, showing distinct vascular features on OCTA. On structural OCT, active NVD lesions with obvious vascular component (Figure 1) appeared on B-scan as tissue of moderate reflectivity emanating from disc region. Pin point registration with OCTA en face projection, revealed anastomosing branching network with evidence of blood flow in overlay B-scans. Irregular proliferation of fine vessels, known as exuberant vascular proliferation (EVP) was noticed in some eyes. Active NVD lesions with equivalent fibrovascular elements appeared on B-scan as moderate to highly reflective tissue intimately related to incompletely detached hyaloids. On OCTA, these lesions exhibit little branching and extension but with some blood flow (Figure 2). In eyes with more fibrous component, en face projection revealed fibrous strands as flow void areas with minimal blood flow on overlay B-scans (Figure 3). Pin point registration revealed highly reflective fibrovascular sheets growing along thickened incompletely detached hyaloids on B-scan and appeared as whitish membranes clinically.
Five eyes with active NVD with more vascular components were subjected to intravitreal injection of 0.05 mL of 0.5 mg ranibizumab because of associated macular edema involving fovea. Pre-injection scans revealed vascular network at the disc with definite blood flow in overlay B-scans (Figure 4). Six weeks after injection of the first eye, there was nearly complete disappearance of the new vessels with remaining ghost vessel at the surface of the disc. Corresponding overlay images and density map revealed absent blood flow (Figure 5). In the other four eyes, there was partial regression with residual leakage on FA that corresponded to filamentous vascular loop and residual blood flow in some parts of the frond on OCTA.
Imaging of New Vessels Elsewhere On structural OCT mode,all cases of NVE appeared on B-scan as tufts of tissue located in pre-retinal space, mostly growing along the posterior face of detached hyaloids. They were located mainly along arcades but some lesions were near the foveal region. Sometimes,the lesions appeared breaching internal limiting membrane(ILM) and were not clearly seen in subretinal space. On OCTA mode, segmentation techniques of the macula do not include vitreous scans as default, so NVE did not appear in some eyes on en face OCTA imaging (Figure 6). The inner boundary at superficial capillary plexus was extended to NVE area in each case. By pin point registration of B-scan with OCTA frames,some lesions appeared gradually as mildly reflective zone in a manner simulating early filling on FA (Figure 7) while others appeared as a vascular branching network. B-scan overlay revealed less blood flow compared to NVD. The NVE fronds were more detected on density maps than on en face projections. A well defined area of ischemia was associated with the NVE in all eyes both in superficial and deep capillary plexuses. Density maps revealed wide zones of ischemia temporal to the macula along the upper and lower arcades. In one eye the NVE was not clearly seen on OCTA. In this case,there was excessive eye motion. Three eyes showed IRMA lesions. The lesion appeared as fine network associated with focal areas of increased blood flow in superficial capillary network frames and density maps. Adjacent to IRMA, there was a deeply ischemic zone. Structural OCT failed to detect IRMA (Figure 8). Pin point registration between structural and angiographic features could distinguish NVE from IRMA by its pre-retinal location.
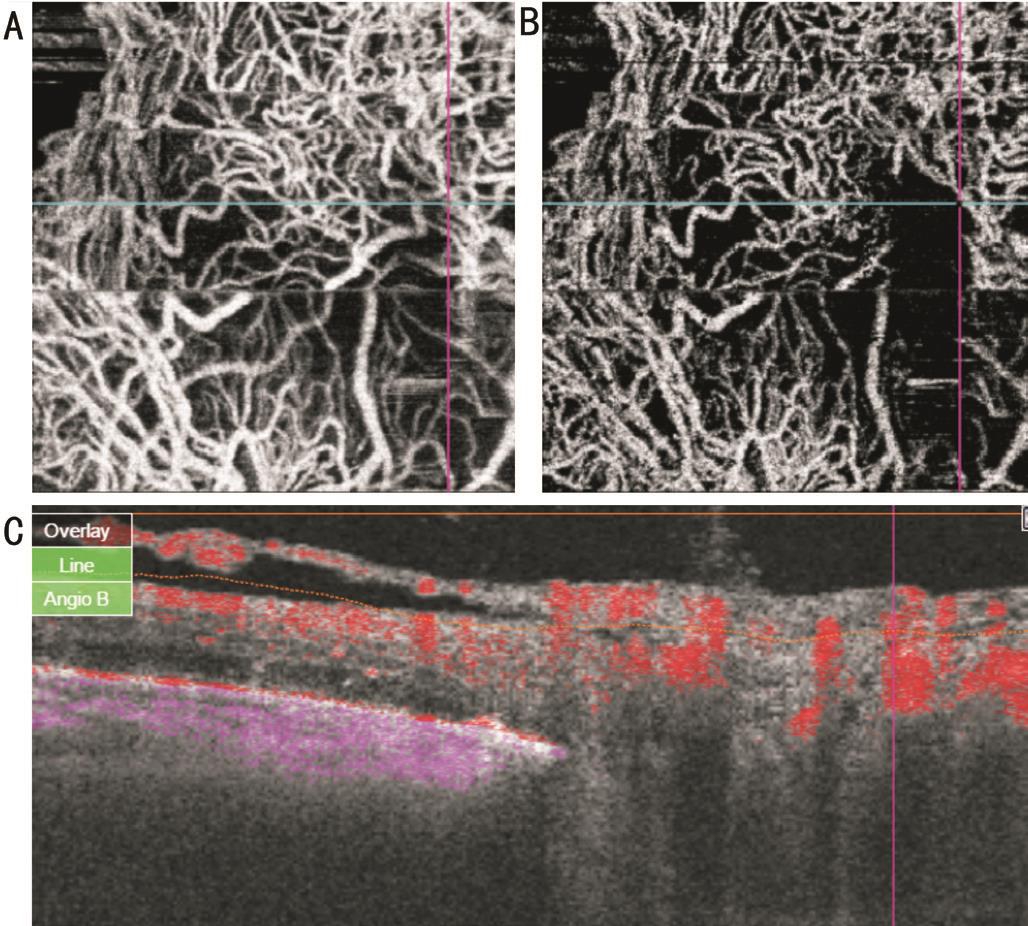
Figure 1 Co-registered swept source OCTA images of NVD with vascular component En face projections show branching anastomosing network in nerve head (A), vitreous (B) scans. Blood flow is detected on B-scan overlay (C) image.
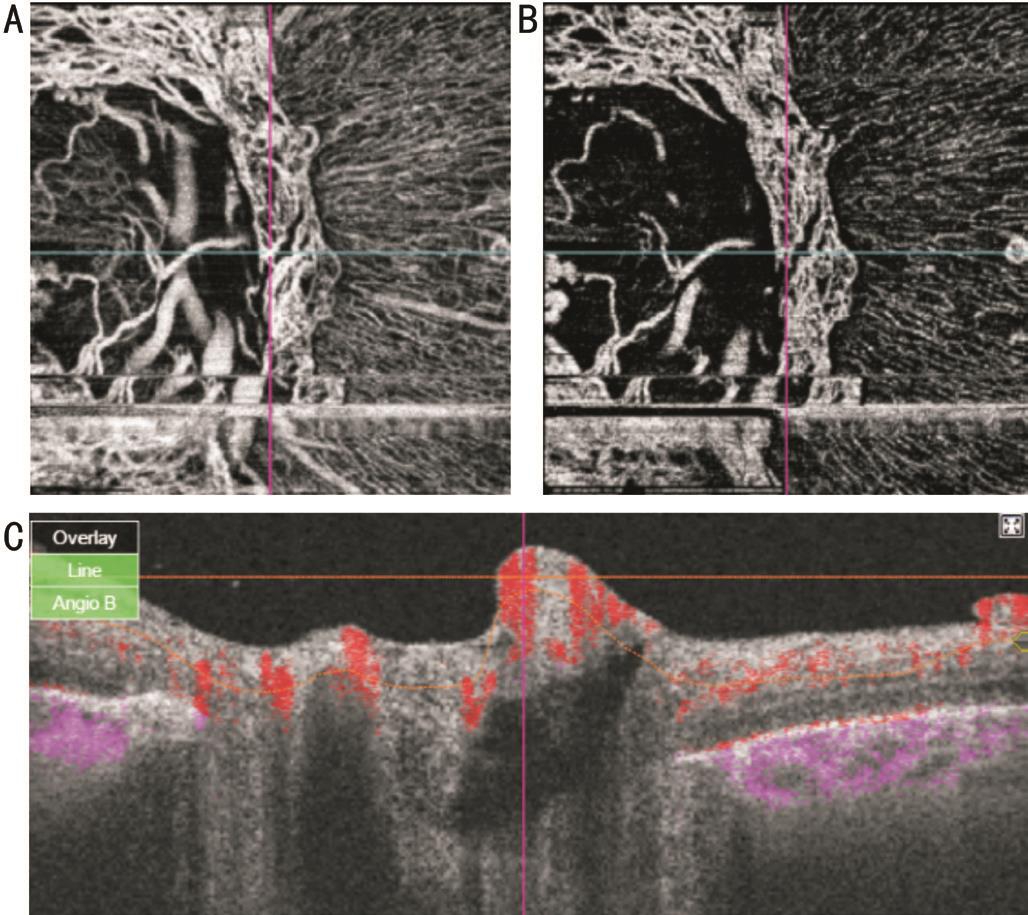
Figure 2 Co-registered swept source OCTA images of NVD with equivalent fibrovascular elements En face projections show less branching and extension in nerve head (A), vitreous (B) scans. Less blood flow is detected on B-scan overlay (C) image.
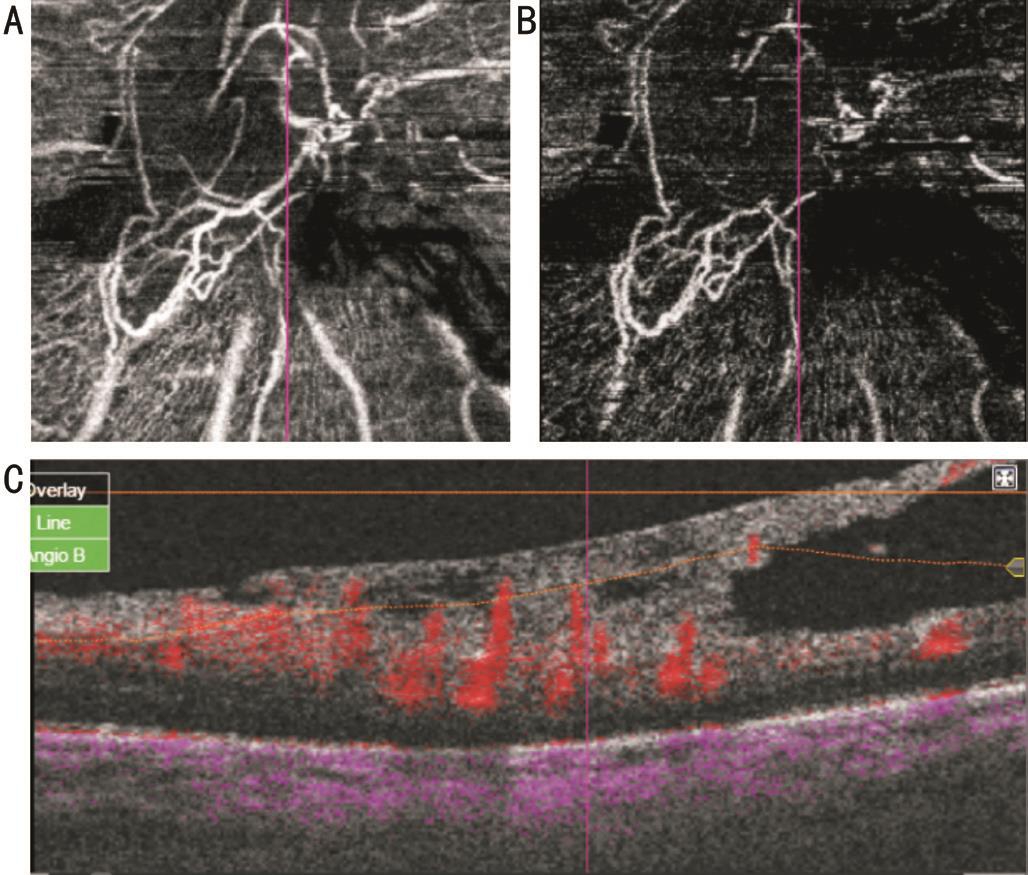
Figure 3 Co-registered SS-OCTA images of NVD with fibrous elements En face projections show flow void areas in nerve head (A),vitreous (B) scans. Minimal blood flow is detected on B-scan overlay(C) image.
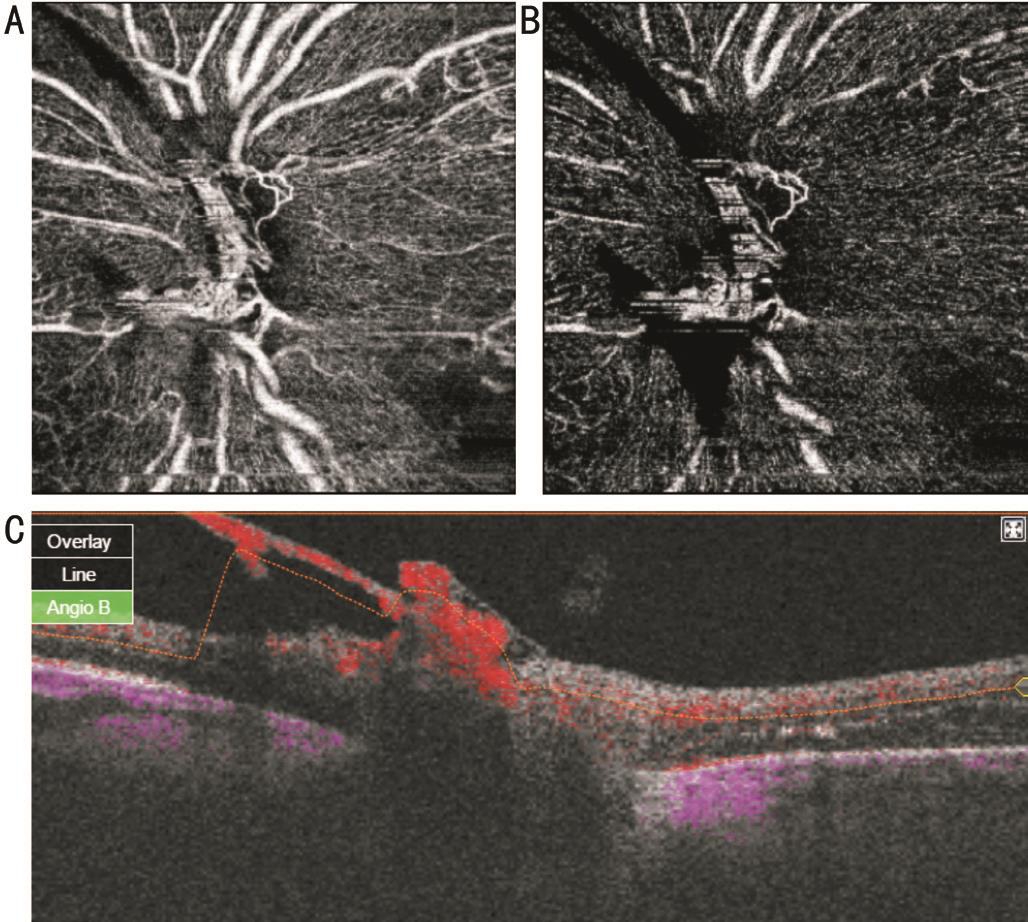
Figure 4 SS-OCTA images of active NVD En face projections show looped vascular network in nerve head (A), vitreous (B) scans. Blood flow is detected on B-scan overlay (C) image.
Although standard OCT has become the mainstay in diabetic retinopathy management, it cannot provide information about vascular bed or blood flow [16] . When OCTA was combined with anatomical information from structural B-scans in evaluation of retinal and choroidal disease, a more comprehensive picture was elucidated in a time efficient manner [5,17] .
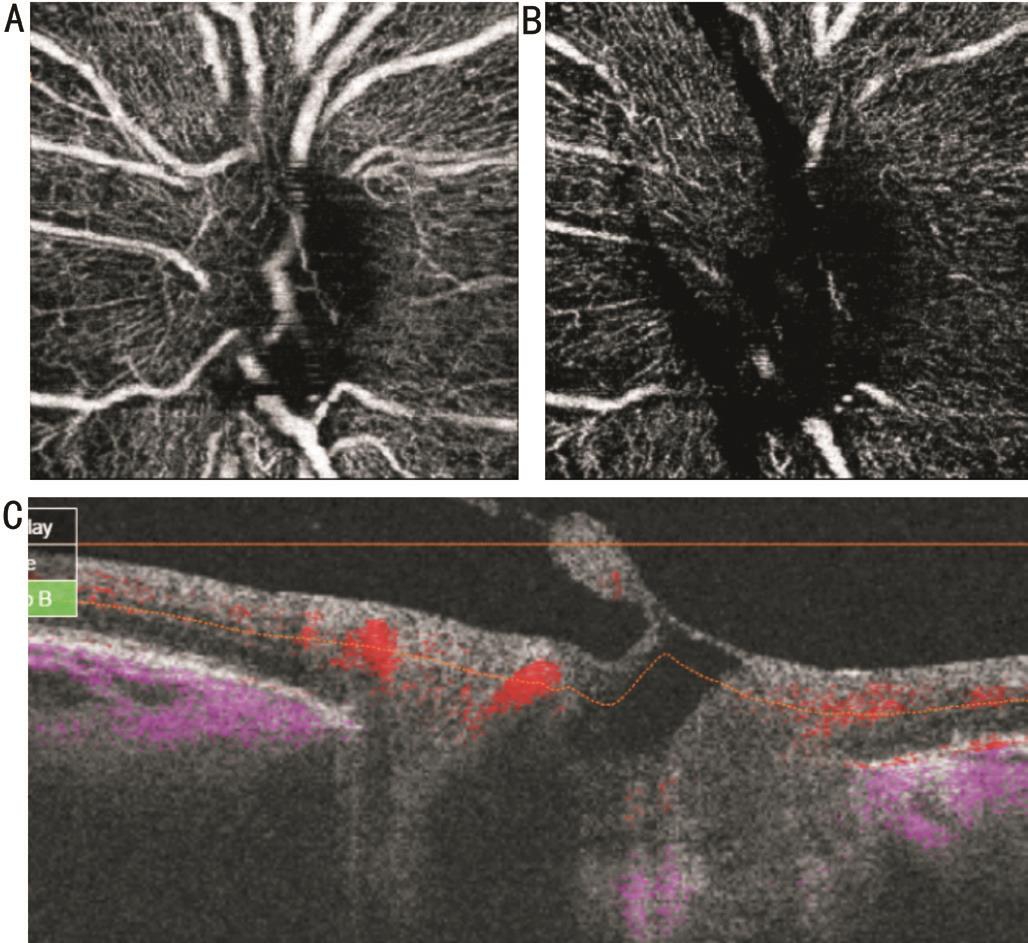
Figure 5 SS-OCTA images of same eye on figure “4” six weeks after intravitreal ranibizumab injection En face projections show ghost blood vessel in nerve head (A), vitreous (B) scans. Blood flow is absent on B-scan overlay (C) image.
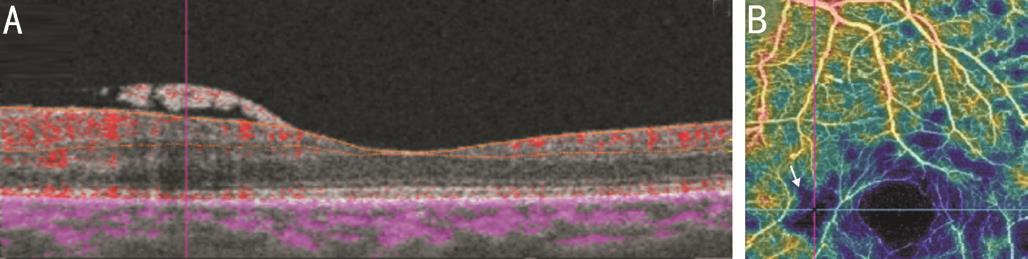
Figure 6 Co-registered SS-OCTA images of active NVE B-scan overlay (A) shows NVE frond with underlying minimal blood flow which is registered to well defined area of ischemia on density map (B).
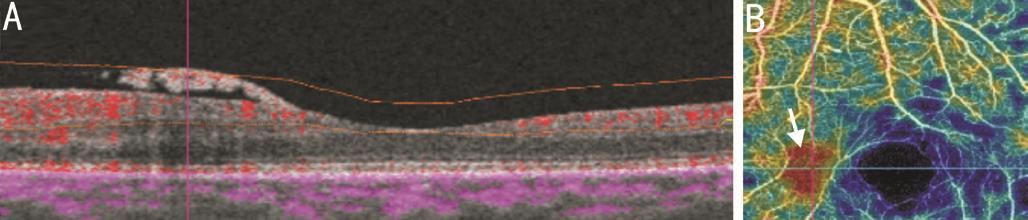
Figure 7 Co-registered SS-OCTA images of same eye on Figure 6 after extending the inner boundary at superficial capillary plexus to vitreous level Blood flow within NVE in B-scan overlay (A) is registered to area of filling seen on density maps (B).
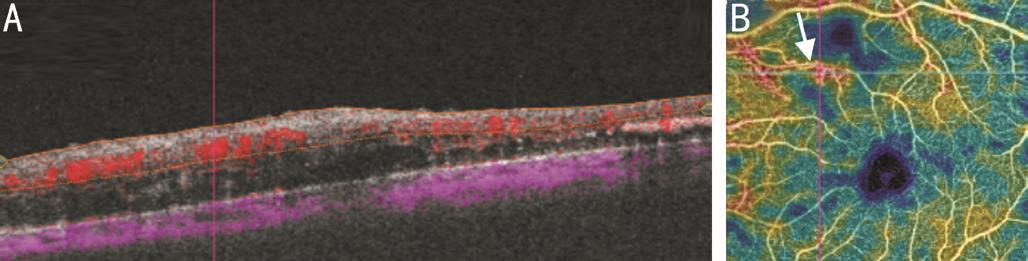
Figure 8 Co-registered SS-OCTA images of IRMA B-scan overlay(A) shows IRMA as focal area of increased retinal blood flow which is registered to area of filling on density maps (B). A well defined area of ischemia is seen adjacent to IRMA. Structural B-scan OCT failed to detect IRMA lesion.
Although the role of OCTA in diabetic retinopathy had been extensively studied, few reports focused on proliferative stage.Stanga et al [18] could localize vascular lesions in all cases of NVD of the optic disc (28/28) and in more than half of cases of NVE (16/28). Savastano et al [19] studied 10 eyes with PDR and concluded that OCTA provides better visualization of neovascularization of the optic disc NVD than FA. Working on 13 eyes with PDR, de Carlo et al [20] detected neovessels in 11 eyes and IRMA adjacent to areas of neovascularization in 6 eyes. The present study confirmed the presence of NVD and NVE, but only one, co-registered with cross-sectional OCT images. In the present study, enlargement of FAZ ( involving both superficial and deep plexuses) and/or capillary non perfusion was detected in all eyes. Quantification of ischemic zones associated with neovascularization. This may help in classification of disease severity, provide prognostic clue and guide therapeutic approaches. One OCTA study addressed the effect of treatment on neovessel morphology. Ishibazawa et al [21] reported two types of neovessels in eyes with PDR receiving pan retinal photocoagulation (PRP) (either naive treatment or previously treated). The first type, represent active stage, vessels that had the lesions with irregular proliferation of fine vessels, which were defined as EVP. The second type of new vessels, represent less active stage, had pruned vascular loops of filamentous new vessels.
In PDR cohort treated with either PRP (8 eyes) or anti-VEGF injection (3 eyes), Choi et al [22] reported retinal neovascularization as signals above the ILM. In addition, Retinal vasculature abnormalities, including dilated, tortuous capillaries, capillary dropouts, reduced capillary density, and/or enlarged FAZ were detected. However, They did not address neovessel morphology or treatment response.
In the current study, neovessel activity was graded based on blood flow data and density maps. It could recognize heterogeneous appearance of wide NVD spectrum. Active NVD was categorized into vascular component, equivalent fibrovascular elements or fibrous component; each of which has peculiar appearance on both structural and angiographic modes. Blood flow data correlated obviously with these three patterns. It is potentially possible to grade activity of NVD lesions according to OCT criteria including morphological appearance and blood flow indices as potential substitute for invasive technique.
In 5 eyes, regression of NVD after ranibizumab injection was documented. The regression was complete in one eye and partial in the other four eyes. Compared to FA, leakage from neovessels was absent. Although leakage is a useful sign to detect activity, it could mask adjacent zone of capillary drop out and neovascularization area. In addition, OCTA can detect pattern of neovessels regression. Huang et al [23] could detect pattern of regression of choroidal neovascular membrane using OCTA after antiangiogenic treatment. They recorded unknown pattern of rapid shutdown and reappearance of choroidal neovascularization channels within treatment cycles.Considering potential risk of dye injection, the future use of OCTA as non-invasive tool in monitoring response of NVD to different therapeutic modalities and early detection of recurrence is possible.
Because NVE does not appear in default OCTA images unless segmentation techniques are adjusted, structural OCT images is of utmost importance as initial clue for these lesions.B-scan overlay revealed relatively less blood flow within NVE than NVD fronds. This may partially explain why NVE are associated with low risk of bleeding. En face projection of one case of NVE did not appear. This may reflect relatively sluggish circulation in NVE fronds. However, corresponding B-scan overlay could reveal blood flow. So, another possibility is that wide scans of 9 mm×9 mm may miss fine details. In addition, in this eye there was excessive eye motion which may interfere with proper segmentation techniques. These cases highlight the importance that can be added by structural OCT images in which NVE can be easily distinguished in preretinal space along the posterior vitreous face. On the other hand,standard OCT could not detect IRMA and could not provide information about blood flow [5] . IRMA could be detected by OCTA as focal areas of increased intraretinal blood flow within the superficial capillary plexus. However, the potential interference of IRMA in evaluation of the extent of NVD/NVE on OCTA was reported [21] . So it is important to differentiate NVE from IRMA by detecting their preretinal location on structural OCT images. Miura et al [10] combined Doppler OCT with structural OCT to evaluate vascular complex in PDR,however Doppler OCT is only sensitive to axial blood flow and is not efficient at detecting the slower flow within the microvasculature of the retina [24] .
The present study distinguished two pattern of NVE. The first is a branching vascular tuft in case of relatively large lesion. This pattern had been reported before [17] and proved to change after treatment into pruned vascular network. The second pattern was an area of flow or filling associated with smaller lesion. It was found that FA leakage can mask small NVE. Hwang et al [25] reported that small NVE can mimic microaneurysm near the foveal region and that NVE was detected by OCTA as flow signal above the ILM.
This study has several limitations. First, no ideal scan size could be applied to all lesions. Minute morphology of NVD was only delineated with 3 mm×3 mm scan. But small scan size missed extension of lesions beyond disc margin. Detection of NVE was only possible with large 9 mm×9 mm scan size which mask fine details. Second, highly elevated NVD could be cropped and presents as shadow rather than flow [21] . Also very thick hemorrhage interrupt the projection of the retinal vasculature onto OCTA frames [5] . Furthermore, measurement of NVD area could not be applied to fibrous types with flow void area or to wide irregularly extended lesions along the arcades. Lastly, angiography needs carefully selected patients with reasonable vision and fixation.
SS-OCT comprising structural and angiographic modes provide more integral view of neovascular complex. It can detect,characterize and categorize the pattern of wide spectrum of neovessels in diabetic eyes based on blood flow data and density maps. Vascular and fibrous component of neovascular complex could be differentiated. It is potentially useful to detect associated capillary non perfusion in the vascular bed and regression of NVD after therapeutic regimen providing substitute for invasive techniques.
ACKNOWLEDGEMENTS
Conflicts of Interest: Elbendary AM, None; Abouelkheir HY, None.
REFERENCES
1 Klein R, Davis MD, Moss SE, Klein BE, DeMets DL. The Wisconsin Epidemiologic Study of Diabetic Retinopathy. A comparison of retinopathy in younger and older onset diabetic persons. Adv Exp Med Biol 1985;189:321-335.
2 Davis MD. Diabetic retinopathy. A clinical overview. Diabetes Care 1992;15(12):1844-1874.
3 Yannuzzi LA, Rohrer KT, Tindel LJ, Sobel RS, Costanza MA, Shields W, Zang E. Fluorescein angiography complication survey. Ophthalmology 1986;93(5):611-617.
4 Vaz-Pereira S, Zarranz-Ventura J, Sim DA, Keane PA, Smith R, Egan CA, Tufail A. Optical coherence tomography features of active and inactive retinal neovascularization in proliferative diabetic retinopathy. Retina 2016;36(6):1132-1142.
5 Yu S, Lu J, Cao D, Liu R, Liu B, Li T, Luo Y, Lu L. The role of optical coherence tomography angiography in fundus vascular abnormalities. BMC Ophthalmol 2016;16(1):107-114.
6 Davis MD, Bressler SB, Aiello LP, et al ; Diabetic Retinopathy Clinical Research Network Study Group. Comparison of time-domain OCT and fundus photographic assessments of retinal thickening in eyes with diabetic macular edema. Invest Ophthalmol Vis Sci 2008;49(5):1745-1752.
7 Yeung L, Lima VC, Garcia P, Landa G, Rosen RB. Correlation between spectral domain optical coherence tomography findings and fluorescein angiography patterns in diabetic macular edema. Ophthalmology 2009;116(6):1158-1167.
8 Brar M, Yuson R, Kozak I, Mojana F, Cheng L, Bartsch DU, Oster SF,Freeman WR. Correlation between morphologic features on spectraldomain optical coherence tomography and angiographic leakage patterns in macular edema. Retina 2010;30(3):383-389.
9 Cho H, Alwassia AA, Regiatieri CV, Zhang JY, Baumal C, Waheed N, Duker JS. Retinal neovascularization secondary to proliferative diabetic retinopathy characterized by spectral domain optical coherence tomography. Retina 2013;33(3):542-547.
10 Miura M, Hong YJ, Yasuno Y, Muramatsu D, Iwasaki T, Goto H. Threedimensional vascular imaging of proliferative diabetic retinopathy by Doppler optical coherence tomography. Am J Ophthalmol 2015;159(3):528-538.
11 Schwartz DM, Fingler J, Kim DY, Zawadzki RJ, Morse LS, Park SS,Fraser SE, Werner JS. Phase-variance optical coherence tomography: a technique for noninvasive angiography. Ophthalmology 2014;121(1):180-187.
12 Kim DY, Fingler J, Zawadzki RJ, Park SS, Morse LS, Schwartz DM,Fraser SE, Werner JS. Noninvasive imaging of the foveal avascular zone with high-speed, phase-variance optical coherence tomography. Invest Ophthalmol Vis Sci 2012;53(1):85-92.
13 Yasuno Y, Hong Y, Makita S, Yamanari M, Akiba M, Miura M, Yatagai T. In vivo high-contrast imaging of deep posterior eye by 1-microm swept source optical coherence tomography and scattering optical coherence angiography. Opt Expres s 2007;15(10):6121-6139.
14 Choi W, Moult EM, Waheed NK, Adhi M, Lee B, Lu CD, de Carlo TE, Jayaraman V, Rosenfeld PJ, Duker JS, Fujimoto JG. Ultrahighspeed, swept-source optical coherence tomography angiography in nonexudative age-related macular degeneration with geographic atrophy. Ophthalmology 2015;122(12):2532-2544.
15 Moult E, Choi W, Waheed NK, Adhi M, Lee B, Lu CD, Jayaraman V,Potsaid B, Rosenfeld PJ, Duker JS, Fujimoto JG. Ultrahigh-speed sweptsource OCT angiography in exudative AMD. Ophthalmic Surg Lasers Imaging Retina 2014;45(6):496-505.
16 Brown DM, Nguyen QD, Marcus DM, et al ; RISE and RIDE Research Group. Long-term outcomes of ranibizumab therapy for diabetic macular edema: the 36-month results from two phase III trials: RISE and RIDE. Ophthalmology 2013;120(10):2013-2022.
17 Khan HA, Mehmood A, Khan QA, Iqbal F, Rasheed F, Khan N,Pizzimenti JJ. A major review of optical coherence tomography angiography. Expert Review of Ophthalmology 2017;12(5):373-385.
18 Stanga PE, Papayannis A, Tsamis E, Stringa F, Cole T, D’Souza Y,Jalil A. New findings in diabetic maculopathy and proliferative disease by swept-source optical coherence tomography angiography. Dev Ophthalmol 2016;56:113-121.
19 Savastano MC, Federici M, Falsini B, Caporossi A, Minnella AM.Detecting papillary neovascularization in proliferative diabetic retinopathy using optical coherence tomography angiography. Acta Ophthalmol 2018;96(3):321-323.
20 de Carlo TE, Bonini Filho MA, Baumal CR, Reichel E, Rogers A, Witkin AJ, Duker JS, Waheed NK. Evaluation of preretinal neovascularization in proliferative diabetic retinopathy using optical coherence tomography angiography. Ophthalmic Surg Lasers Imaging Retina 2016;47(2):115-119.
21 Ishibazawa A, Nagaoka T, Yokota H, Takahashi A, Omae T, Song YS,Takahashi T, Yoshida A. Characteristics of retinal neovascularization in proliferative diabetic retinopathy imaged by optical coherence tomography angiography. Invest Ophthalmol Vis Sci 2016;57(14):6247-6255.
22 Choi W, Waheed NK, Moult EM, Adhi M, Lee B, De Carlo T,Jayaraman V, Baumal CR, Duker JS, Fujimoto JG. Ultra high speed swept source optical coherence tomography angiography of retinal and choriocapillaries alternations in diabetic patients with and without retinopathy. Retina 2017;37(1):11-21.
23 Huang D, Jia Y, Rispoli M, Tan O, Lumbroso B. Optical coherence tomography angiography of time course of choroidal neovascularization in response to anti-angiogenic treatment. Retina 2015;35(11):2260-2264.
24 Huang S, Shen M, Zhu D, Chen Q, Shi C, Chen Z, Lu F. In vivo imaging of retinal hemodynamics with OCT angiography and Doppler OCT. Biomed Opt Express 2016;7(2):663-676.
25 Hwang TS, Jia Y, Gao SS, Bailey ST, Lauer AK, Flaxel CJ, Wilson DJ,Huang D. Optical coherence tomography angiography features of diabetic retinopathy. Retina 2015;35(11):2371-2376.
Citation: Elbendary AM, Abouelkheir HY. Bimodal imaging of proliferative diabetic retinopathy vascular features using swept source optical coherence tomography angiography. Int J Ophthalmol 2018;11(9):1528-1533
Received: 2017-12-07 Accepted: 2018-03-01
DOl: 10.18240/ijo.2018.09.16
Correspondence to: Amal M Elbendary. Mansoura Ophthalmic Center, Mansoura University, Mansoura 35516, Egypt.amalelbendary67@gmail.com