Metabolic profile analysis of free amino acids in experimental autoimmune uveoretinitis rat plasma
Jun-Guo Guo1,2,3, Xin-Miao Guo4, Xing-Rong Wang2,3,5, Jing-Zhen Tian1, Hong-Sheng Bi2,3,5
1College of Pharmacy, Shandong University of Traditional Chinese Medicine, Jinan 250355, Shandong Province, China
2Shandong Provincial Key Laboratory of Integrated Traditional Chinese and Western Medicine for Prevention and Therapy of Ocular Diseases, Jinan 250002, Shandong Province, China
3Eye Institute, Shandong University of Traditional Chinese Medicine, Jinan 250002, Shandong Province, China
4School of Management, Shandong University of Traditional Chinese Medicine, Jinan 250355, Shandong Province, China
5Affiliated Eye Hospital, Shandong University of Traditional Chinese Medicine, Jinan 250002, Shandong Province, China
Abstract● AlM: To determine the differences of amino acid (AA)levels in experimental autoimmune uveoretinitis (EAU).● METHODS: AA analysis of the plasma samples in EAU rats induced by interphotoreceptor retinoid-binding protein emulsion were performed with high performance liquid chromatography (HPLC) and phenylisothiocyanate(PlTC) pre-column derivation methods were performed.Using partial least squares discriminant analysis (PLS-DA),the potential biomarkers were identified in EAU rat plasma,and the metabolic pathways related to EAU were further analyzed.● RESULTS: The method results showed that linear(r≥0.9957), intra-day reproducible [relative standard deviation (RSD)=0.04%-1.33%], inter-day reproducible(RSD=0.06%-2.07%), repeatability (RSD=0.03%-0.89%),stability (RSD=0.05%-2.48%) and recovery (RSD=1.98%-4.39%), with detection limits of 0.853-11.4 ng/mL. The metabolic profile in EAU rats was different from that in the control groups five AAs concentrations were increased and nine AAs were reduced. Moreover, five metabolic pathways were related to the development of EAU.● CONCLUSlON: The developed method is a simple,rapid and convenient for determination of AAs in EAU rat plasma, and these findings will provide a comprehensive insight on the metabolic profiling of the pathological changes in EAU.
INTRODUCTION
Uveitis is an in flammatory and autoimmune eye disease including Vogt-Koyanagi-Harada syndrome, Behcet’s disease, acute retinal necrosis, Fuchs syndrome and birdshot retinochoroidopathy. Uveitis is the frequent cause of visual impairment worldwide mostly affecting individuals of young adults and children[1-3]. Experimental autoimmune uveoretinitis(EAU) has been extensively used as an ideal animal model to research the pathophysiology of uveitis and to develop new effective therapeutic strategies over the last decade[4-6]. EAU can be induced in rats and mice by using pathogenic epitopes,such as interphotoreceptor retinoid-binding protein (IRBP),S-Ag, and rhodopsin. The most popular rat for EAU studies is Lewis rat, which typically takes an acute, monophasic course and develops severe uveitis, and it can be observed by external examination of the eyes with a flashlight[7]. Recently,expression changes in miRNAs, immunohistochemical analysis and in vivo optical coherence tomography assessment of EAU have facilitated the understanding its mechanisms[8-9].However, the metabolism changes in rat plasma still limits in the light of our understanding.
The metabolism of amino acids (AAs) can adjust the total amount of nitrogen balance, and can promote the synthesis of enzymes, hormones and some vitamin levels[10-12]. The metabolism of AAs was closely related to disease. The type and concentration of AAs in the blood were dynamic equilibrium state in physiological conditions. However, when the body anomalies, the dynamic balance will be out of control, and the AAs concentration will be change[13]. The analysis of metabolites is mainly involved in metabolic fingerprinting and metabolic profiling[14]. The detection techniques of metabolites were mainly gas chromatography mass spectrometry[15],nuclear magnetic resonance[16] and liquid chromatography cass spectrometry[17]. Beyond the analysis of free AAs in plasma could hold great promise to enhance our understanding of the complex relationship between AAs and EAU.
AAs were organic substances containing both amino and acid groups, which were traditionally classified as essential what mammalian cannot synthesis and non-essential what the mammalian can synthesis for humans and animals. Due to variation of side chains, AAs have their own unique catabolic pathway and have remarkably different biochemical properties and functions[18]. In recent studies, it has been showed that AAs directly participate in cell signaling, cell specific metabolism of nutrients, oxidative stress and efficiency of utilization of dietary proteins[19-21]. Abnormal metabolism of AAs impairs growth and development of body homeostasis, and even death[22]. In addition, AAs are pivotal syntheses precursors for hormones and nitrogenous substances, have enormous biological importance. The balance among AAs is crucial for the whole body. AAs exist in organisms as free or bound forms. High performance liquid chromatography (HPLC)combined with chemical derivatization is the most widely used analytical technique in AA determination in plasma, skeletal muscle, urine ciliary epithelium, aqueous and lens[23-26].
In the present study, we performed the plasma AA analysis using HPLC with phenylisothiocyanate (PITC) pre-column derivation methods in EAU rats, and mainly focused on the alterations of AAs concentration profile and the metabolism of AAs alterations of the plasma between EAU rats and control samples.
MATERIALS AND METHODS
Ethical Approval All applicable international, national, and/or institutional guidelines for the care and use of animals were followed. All procedures performed in studies involving animals were in accordance with the ethical standards of the institution or practice at which the studies were conducted. All animals were fed and maintained according to the guidelines of Care and Use of Laboratory Animals published by the China National Institute of Health.
Animals and Chemicals In the study, we used female Lewis rats (SPF grade, 160-180 g, 6-8 weeks old) to induce EAU.Lewis rats purchased from Peking Vital River Laboratory Animal Ltd., Beijing, China.
IRBP1177-1191 was synthesized by Sangon Biotech (Shanghai,China) Co., Ltd. Freund’s complete adjuvant and PITC were purchased from Sigma-Aldrich, St. Louis, MO, USA. Eighteen kinds of AAs and standard references were provided by National Institutes for Food and Drug Control of China(Beijing, China). Acetonitrile, methanol and acetic acid were HPLC grade were purchased from Tedia (Product of Tedia,USA). Other analytical grade reagents were obtained from Shanghai Sinopharm Chemical Reagent Co., Ltd.
Apparatus and Software HPLC system includes UltiMate 3000 Pump, 3000 Autosampler, 3000 RS Column Compartment,3000 Diaode Array Detector (DIONEX USA), Chromeleon software (version 6.80) for data acquisition, signal processing and calculation were used for all separation. The electronic balance (MS205DU, Mettler-Toledo, Germany) was checked with certified weight. SIMCA-P software (version 11.5) was used for data analysis.
Induction and Assessment of Experimental Autoimmune Uveoretinitis To induce EAU, the rats were immunized by a single injection 0.1 mL prepared peptide antigen in one footpad described in our previous study[27] and 14 unimmunized rats were set as control group. All animals were monitored by slitlamp biomicroscopy for ocular inflammation, and scored[28].The eye in flammation was also confirmed by histopathological analysis. After day 12 immunization, and the plasma samples and eyes tissue were collected. The plasma were anticoagulated with heparin, centrifuged at 2700 g for 10min, supernatant stored at -80℃ prior to analysis. The eyes tissues were fixed for histological examination[29].
Preparation of Sample A volume of 300 μL PITC was transferred to a brown volumetric flask (25 mL), diluted to the mark with acetonitrile and then stored at 4℃ as the solution of PITC (0.1 mol/L). Of 1.3 mL triethylamine was transferred to a brown volumetric flask (10 mL), diluted with acetonitrile and then stored at 4℃ as solution of triethylamine solution (THS,0.1 mol/L). AAs standard solutions were made by precisely weighing each reagent about 10 mg, transferred to a brown volumetric flask (10 mL), and then diluted with 0.1 mol/L hydrochloric acid. Further, 1 mL of each AAs standard solution was transferred to a 25 mL volumetric flask, diluted to the volume as mixed stock solution.
Before analysis, the samples supernatant were thawed at room temperature. For reducing the effect of solvent to obtain a good peak shape, a 300 μL of sample supernatant was diluted with 600 μL of acetonitrile, centrifuged at 13 000 g at 4℃ for 10min, 200 μL supernatants were transferred to an Eppendorf tube. Of 100 μL PITC and 100 μL THS were added and mixed,after 60min at room temperature, 600 μL of n-hexane was added and mixed thoroughly. After standing for 10min, the mixed solutions were divided into two, and the lower solution was obtained and filtered by 0.22 μm strainer before injecting into an HPLC system for analysis.
Chromatographic Conditions Isolation of rat plasma AAs was carried out with chromatography by using gradient elution on an Atlantis dC18 (3 µm, 4.6×150 mm, Waters USA)column coupled with diode array detector (DAD). Mobile A was acetonitrile, methanol and water (3:1:1, v/v). Mobile B was 925 mL water contained 12.6 g sodium acetate plus 70 mL acetonitrile, and the pH value was 6.5 after adjustment with glacial acetic acid. The above mobile were filtered by 0.22 μm and degassed ultrasonically. Gradient elution was set as 0 A to 96% A from 0 to 6min, 6% A to 9% A from 6 to 17min, 9% A to 23% A from 17 to 20min, 23% A to 45% A from 20 to 32min, 45% A to 55% A from 32 to 34min, 55% A to 100% A from 34 to 40min, 100% A to 0 A from 40 to 45min.The column temperature was 30℃, flow rate was 0.8 mL/min,and the wavelength was 254 nm. A volume of 5 μL of the plasma samples from both EAU and the control group were injected at a random order.
Series of standard AA solutions were prepared and analyzed by HPLC to establish the linear relationship. The precision was calculated by the intra-day and inter-day reproducibility of the same sample. The stability of sample was detected for 0, 8, 16, 24, 48 and 72h. The repeatability was tested by five continuous injection of the same sample. The sample recovery was also detected by divided mixed AA standard solutions in different concentrations. The detection limits for each AA was estimated by the lowest concentration accorded to three times the standard deviation of the blank signal.
Statistical Analysis The relative standard deviations (RSD)of samples peak were calculated to evaluate the precision,stability and repeatability. The raw data were exported for SIMCA-P analysis. Parameters of partial least squares discriminant analysis (PLS-DA) were used to evaluate the models indicating and the ability of prediction. Variable importance in the projection (VIP) value choice the potential biomarkers[30].
Metabolic Biomarkers and Pathways The potential biomarkers were selected according to the VIP values greater than 1. The metabolic pathways were interpreted with KEGG(http://www.kegg.com) and HMDB (http://www.hmdb.ca)databases.
RESULTS
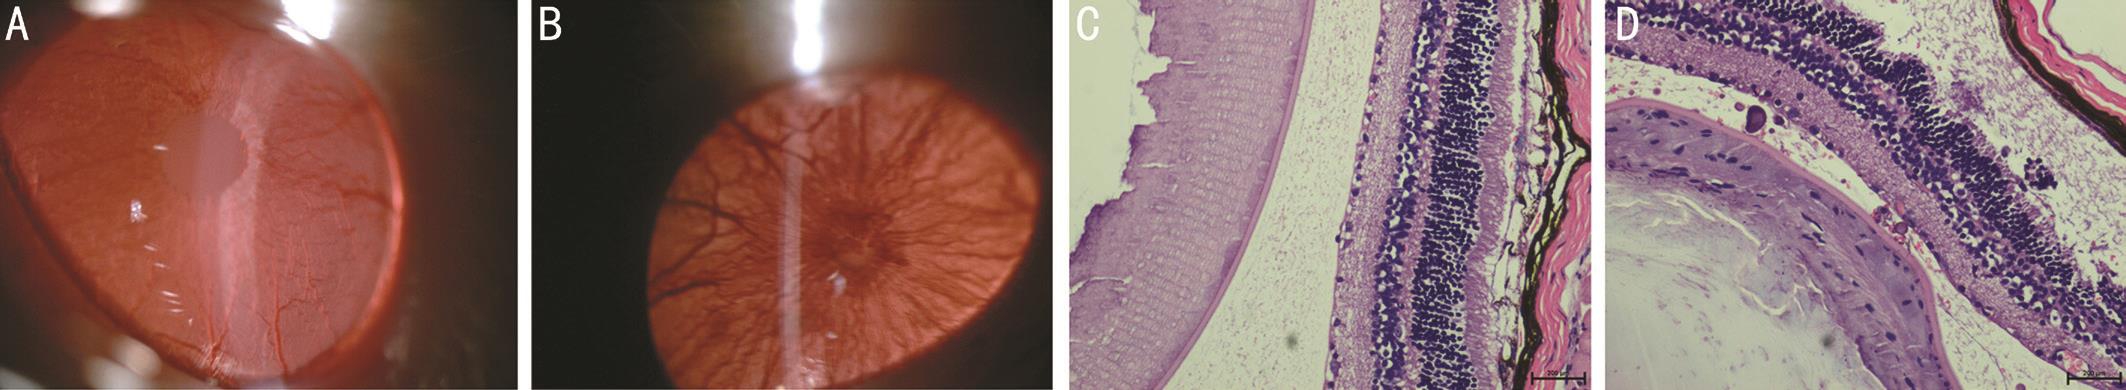
Experimental Autoimmune Uveoretinitis Clinical and Histopathology Assessment The Lewis rats’ eyes were observed every-day after immunization with IRBP emulsion.Compared with control group, EAU rats were detected every day and were found that the in flammation appeared on day 8 after immunization, and the intraocular inflammation, such as opaque anterior chamber and obscured pupil, was the most severe on day 12 (Figure 1A, 1B). The results were also similar to our previous study[28]. Histopathologic examination of the obtained eyes on day 12 after immunization demonstrated apparent changes for the iris, ciliary body and anterior chamber(Figure 1C, 1D).
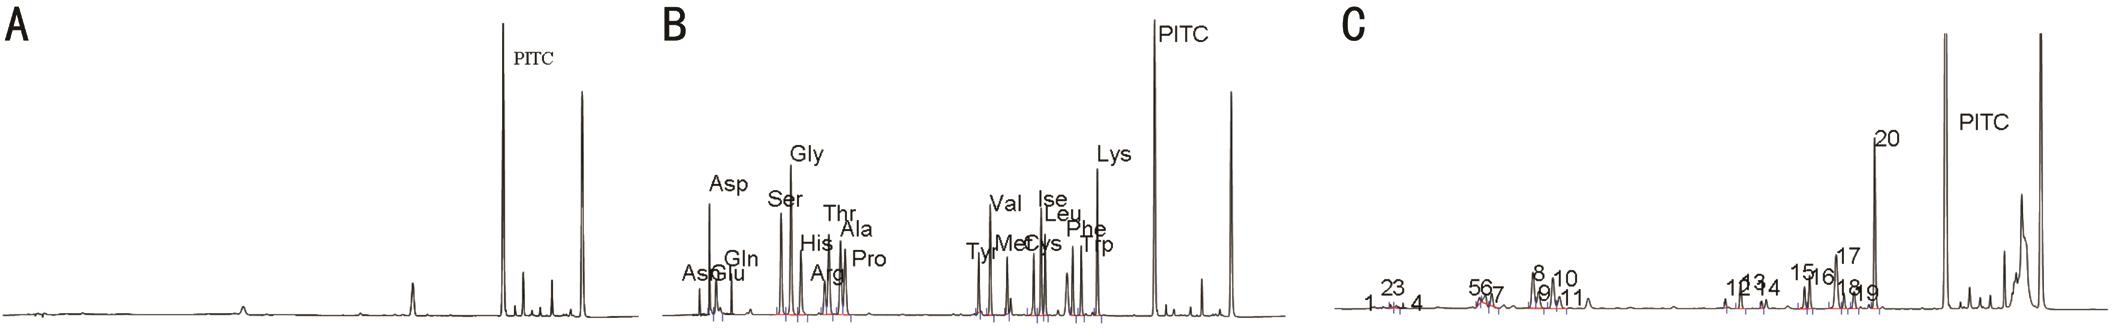
High Performance Liquid Chromatography Result We selected the PITC as derivatizing regent for plasma AA determination by HPLC method. This method produces stable derivatives and the reaction kinetic was fast to all AAs. The blank chromatogram of plasma AAs was shown in Figure 2A.The chromatogram of the standard reference containing 18 kinds of AAs was shown in Figure 2B, and the chromatogram of plasma AAs sample was shown in Figure 2C. It was found that the standard reference contained 18 kinds of AAs were separated well.
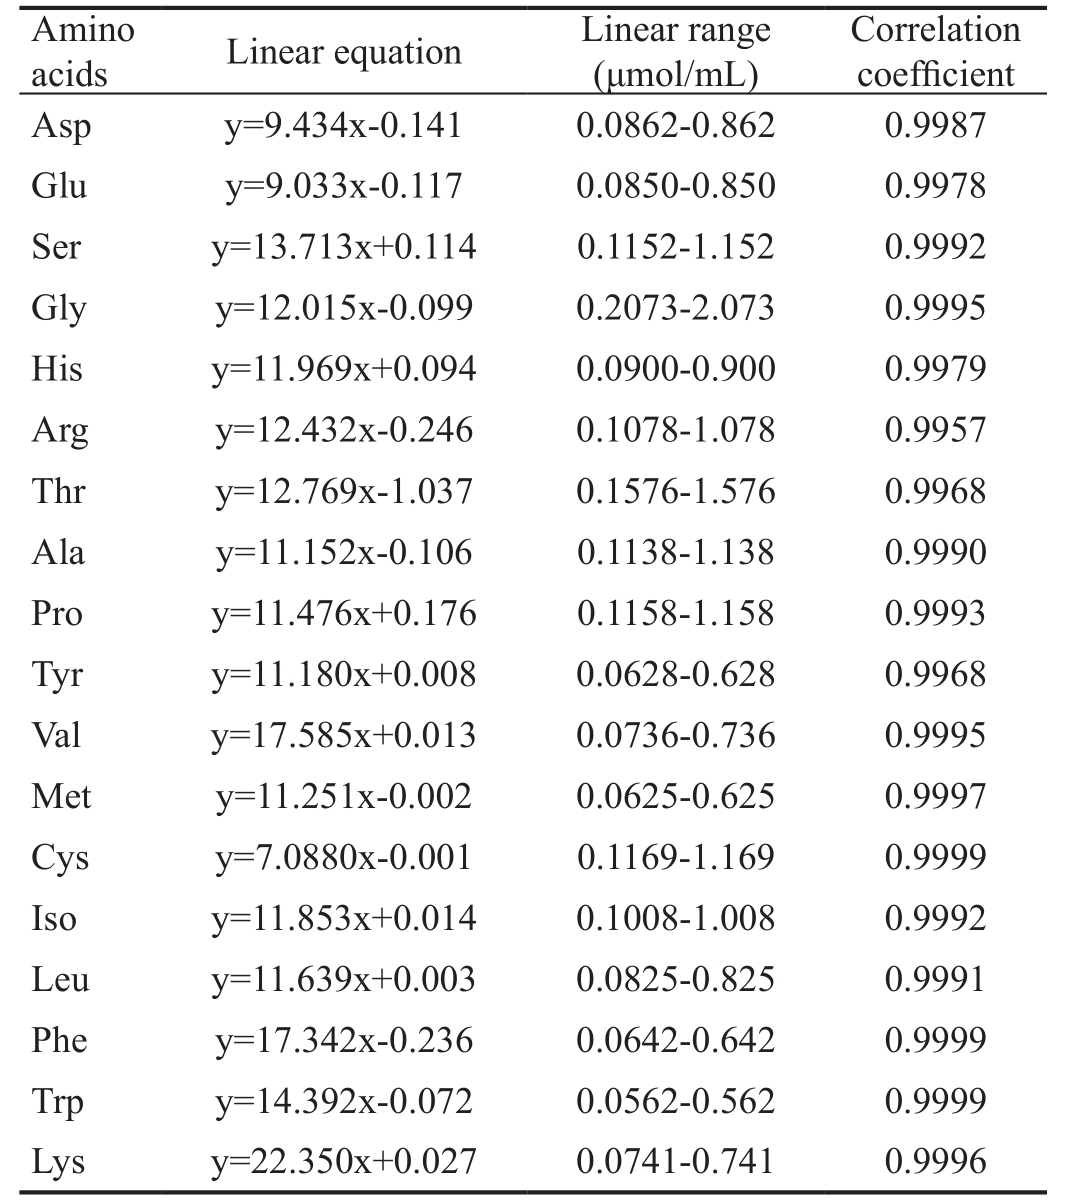
The linear equation, range and correlation coefficient for the standard reference containing 18 kinds of AAs were shown in Table 1. RSD of intra-day and inter-day within five days were less than 2% and 3%, respectively. The RSD of sample stability was less than 3% for 0, 8, 16, 24, 48 and 72h. The average recoveries of AAs RSD were between 1.98% and 4.39%, and the RSD were less than 5% (Table 2). The detection limits varied from 0.853 to 11.4 ng/mL.
In EAU group, we found that the concentrations of five AAs (i.e. Thr, Val, Cys, Iso, Leu) were increased in plasma compared to those in control group. Meanwhile, the concentrations of another eight AAs (i.e. Asp, Glu, Gly, His,Ala, Pro, Tyr, Met, Trp) were decreased compared to those in control group. The rest of AAs hardly changed (Figure 3, Table 3).
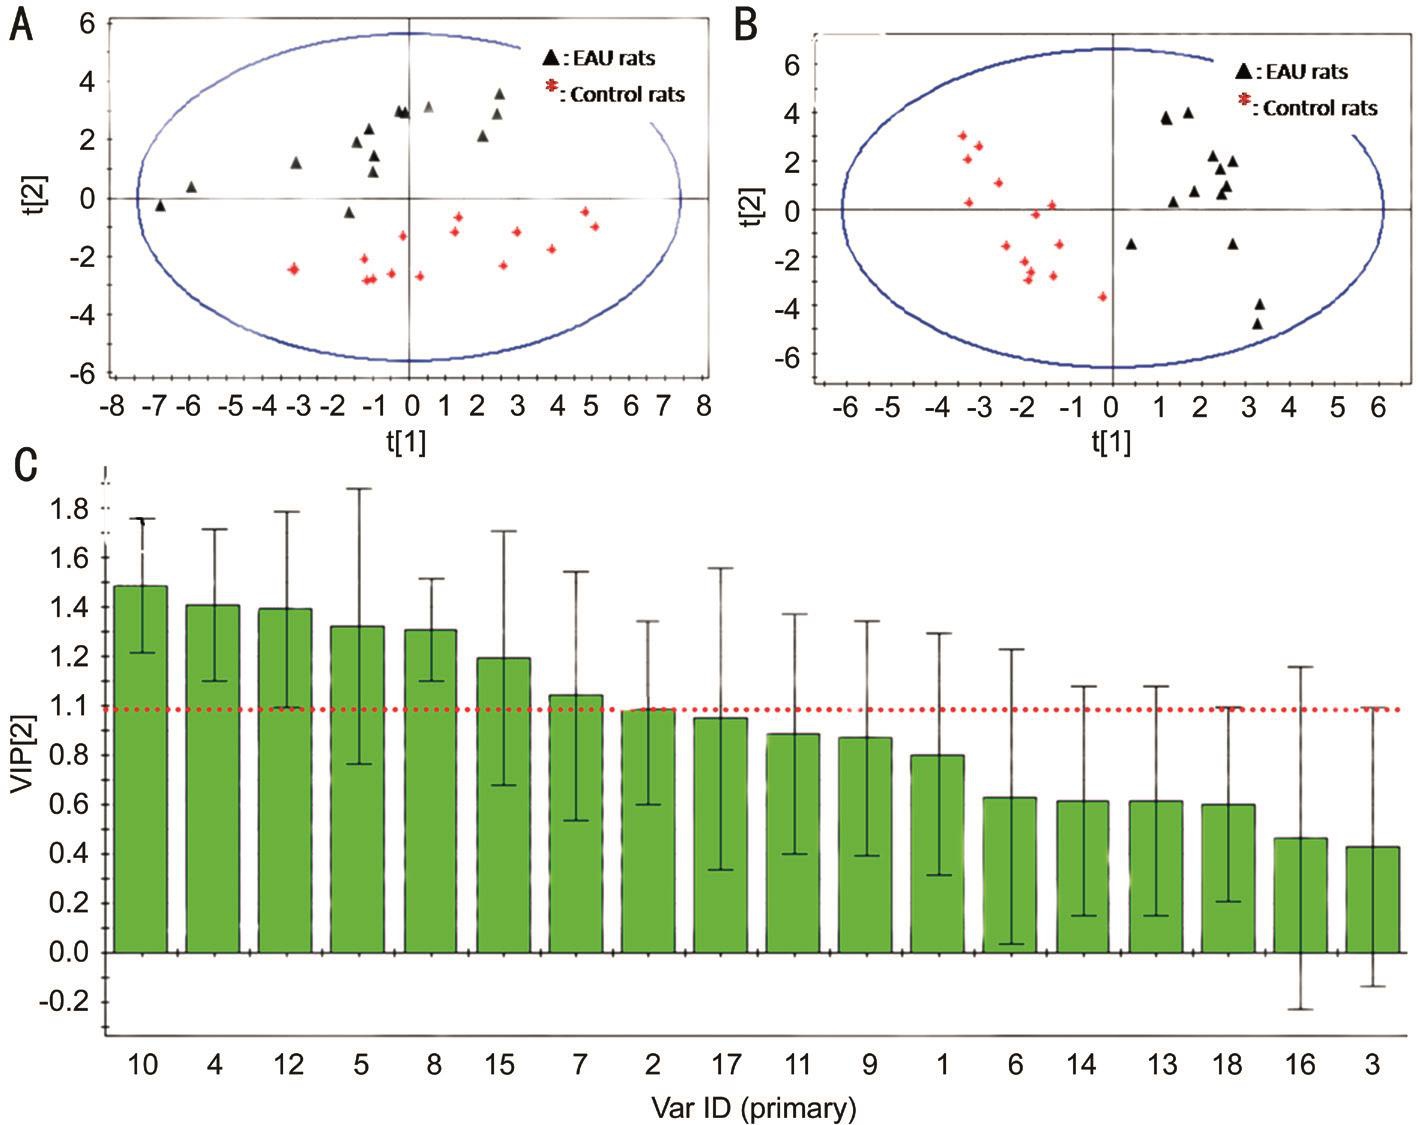
Multi-component Statistical Analysis Principal component analysis (PCA) score plot of EAU and control groups shown in Figure 4A. Separation between EAU and controls was clear.This results show that the metabolic profiling of AAs could be used for understanding EAU. In order to select the potential biomarkers, PLS-DA analysis was performed according to variable importance. A clear separation between EAU and controls could be seen in Figure 4B. The PLS-DA model had a good capability for the classification of EAU from control group.
Potential Metabolic Biomarkers and Pathways In order insight into the metabolic changes among EAU, the PLS-DA analysis was used to choice potential biomarkers. The VIP of PLS-DA of Tyr, Gly, Met, His, Ala, Leu and Thr was more than 1.00, VIP of Ser and Phe was no more than 0.50, and the others between 1.00 and 0.05 (Figure 4C). The value of VIP more than 1.00 was used in the selection, the potential biomarkers were confirmed by standard samples. Final biomarkers were Tyr, Gly, Met, His, Ala, Leu and Thr. The biomarkers related to glycine, serine and threonine metabolism, phenylalanine,tyrosine and tryptophan biosynthesis, valine, leucine and isoleucine degradation and biosynthesis, alanine metabolism,phenylalanine metabolism, alanine, aspartate and glutamate metabolism, cysteine and methionine metabolism and tyrosine metabolism, which may play important roles in the metabolic changes of EAU.
DISCUSSION
Table 1 The linear equation, range and correlation coefficient of 18 kinds of AAs
?
EAU model was first established in 1963, subsequently induced with S-Ag, IRBP, rhodopsin, recoverin, or phosducin.Further, it was found that the development of diverse retinal proteins which induced was mediated by T cells[7]. EAU are widely used to imitate human diseases of autoimmune nature,although the animal models were not reproduced the full spectrum of the disease. Clinically, the EAU has served as an ideal animal model to develop new effective therapeutic strategies. EAU in Lewis rat was typically takes an acute and anterior uveitis, a good clinical predictor. AAs represent certain nutritional conditions, and their disorders reflect various forms of aggression. However, the content of plasma AAs in EAU remain obscure. In the present study, a PITC precolumn derivation and HPLC method for the simultaneous determination of plasma AA in EAU and control Lewis rat were established. Furthermore, the concentration of AAs in EAU was compared to this in control group; PCA and PLSDA were built in order to find correlations of AAs in plasma between EAU rats and control group.
There are several deproteination methods of AAs, such as organic solvents precipitation, ultrafiltration, dialysis and strong acids[24,31]. The advantage of ultrafiltration deproteination method was simple without the other reagents,but may decrease recovery rate because of the interactions andfilter, and experimental costs are higher. The deproteination methods of high speed centrifugation and dialysis need special equipments and the experimental costs also higher.Pretreatment need strong acid, and plasma is not evidently diluted. However, strong acids can affect the life of column,the separation of samples, and not remove all plasma protein either. Organic solvents can remove most plasma protein,although requires larger volumes, cause the sample to be diluted. In the present study, the bio-sample was plasma, and the content of plasma AAs in EAU rats and control group was higher. So the plasma sample was not concentrated after the pretreatment with organic solvents for injection.
Table 2 The precision, repeatability, stability and recovery of established AA analysis methods RSD, %

AA: Amino acid; RT: Retention time; PA: Peak areas; AR: Average recoveries.
Intra-day (n=6) Inter-day (n=5)RT PA RT PA RT PA RT PA Asp 0.05 0.58 0.06 0.84 0.03 0.38 0.05 1.25 3.58 Glu 0.04 0.82 0.06 1.03 0.04 0.56 0.06 1.64 4.39 Ser 0.09 0.15 0.13 0.56 0.04 0.26 0.08 2.03 3.65 Gly 0.05 0.33 0.08 0.95 0.05 0.31 0.08 1.89 2.87 His 0.06 0.21 0.06 0.82 0.05 0.15 0.12 1.57 3.78 Arg 0.04 0.68 0.07 1.23 0.06 0.43 0.11 2.36 4.03 Thr 0.04 1.33 0.06 2.07 0.06 0.89 0.08 2.48 3.72 Ala 0.05 0.79 0.08 1.59 0.05 0.65 0.07 1.56 2.91 Pro 0.05 0.43 0.08 1.02 0.05 0.38 0.08 1.82 2.53 Tyr 0.06 0.25 0.08 1.18 0.03 0.24 0.09 1.75 3.07 Val 0.05 0.54 0.09 0.95 0.03 0.48 0.07 1.95 1.98 Met 0.04 0.36 0.05 1.05 0.04 0.32 0.06 2.08 2.69 Cys 0.08 0.57 0.1 1.31 0.04 0.51 0.07 1.91 3.04 Iso 0.11 0.83 0.12 1.58 0.05 0.14 0.08 2.51 2.59 Leu 0.12 0.76 0.12 1.61 0.05 0.12 0.09 2.37 2.82 Phe 0.12 0.61 0.13 1.39 0.06 0.34 0.11 1.38 2.38 Trp 0.13 0.29 0.15 1.24 0.06 0.31 0.11 1.65 2.55 Lys 0.15 0.34 0.18 1.37 0.07 0.28 0.13 1.73 2.94 AAs Reproducible Repeatability (n=5) Stability (n=6) Recovery(n=9)
Table 3 The concentration of plasma AAs of EAU and control group μmol/mL, n=14
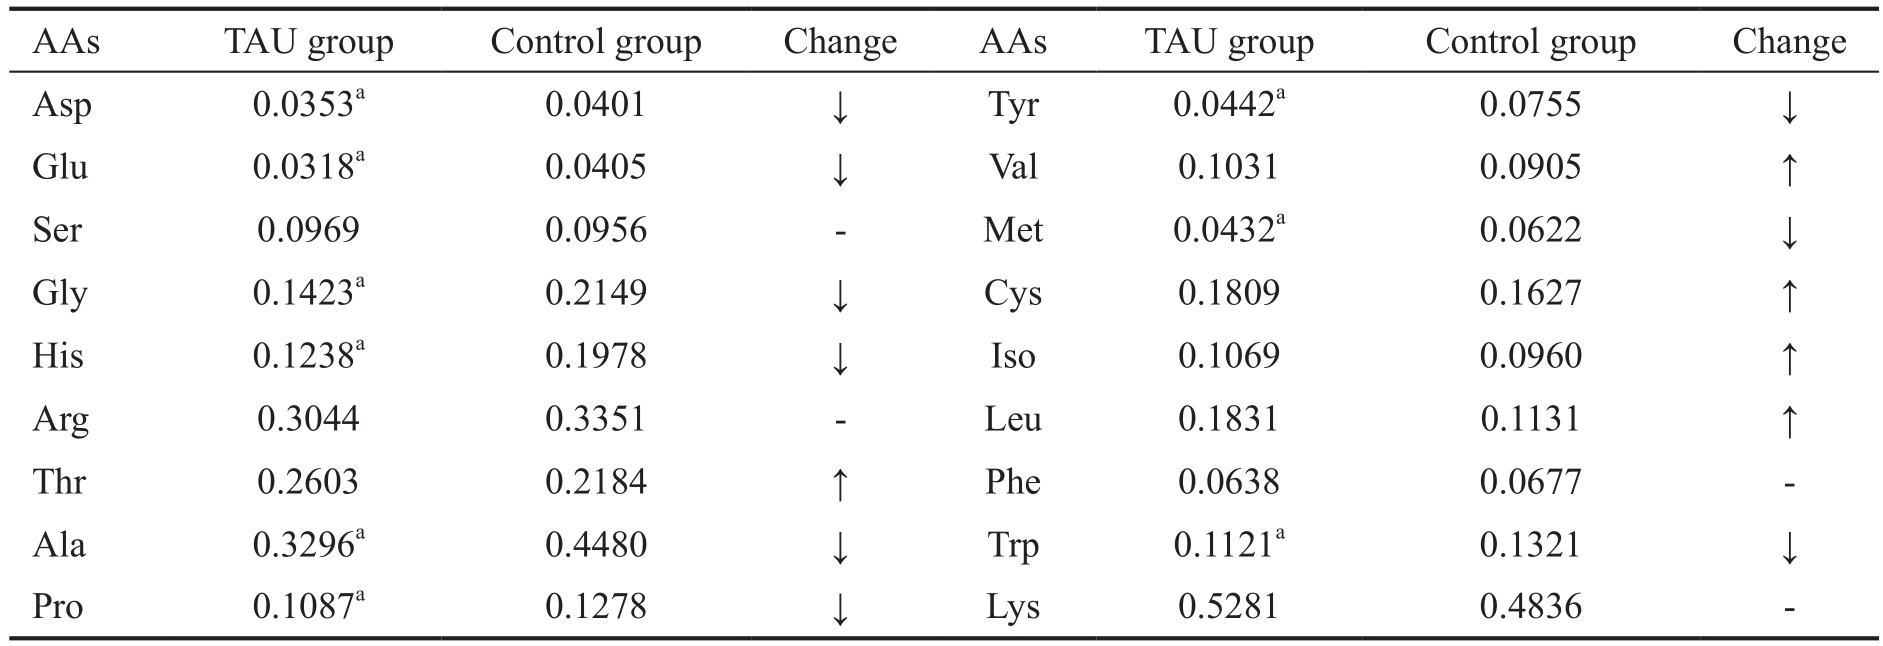
AA: Amino acid; EAU: Experimental autoimmune uveoretinitis. ↓: AAs descended more than 10% compared to control group;↑: AAs increased more than 10%; -: The change of AAs no more than 10%. Compared with control group,aP<0.05.
AAs TAU group Control group Change AAs TAU group Control group Change Asp0.0353a0.0401↓Tyr0.0442a0.0755 ↓Glu0.0318a0.0405↓Val0.1031 0.0905 ↑Ser 0.0969 0.0956 - Met 0.0432a 0.0622 ↓Gly0.1423a0.2149↓Cys0.1809 0.1627 ↑His0.1238a0.1978↓Iso0.1069 0.0960 ↑Arg 0.3044 0.3351 - Leu 0.1831 0.1131 ↑Thr0.2603 0.2184 ↑Phe0.0638 0.0677 -Ala0.3296a0.4480↓Trp0.1121a0.1321 ↓Pro0.1087a0.1278 ↓Lys0.5281 0.4836 -
The simpler and greater sensitivity method of simultaneous determination of AAs in the body-fluids is HPLC, which usually applies reversed-phase C8 or C18 silica-based column with pre-column derivization. Gas chromatography,capillary electrophoresis, ion exchange chromatography and post-column derivization are also used[32]. PITC,benzylisothiocyanate, benzenedialdehyde, 5-dimethlyamino-1-naphthalene sulfonyl chloformate, 9-fluorenylmethyl chloroformate, and 6-aminoquinoyl-N-hydroxysuccinimidyl carbamate are used for pre-column derivatization of AAs.PITC can react quantitatively with free and hydrolysis AAs to form stable phenylthiocarbamyl AA derivatives and only one product for each AA. The excess reagents and byproducts could interfere by adding organic solvents and then remove them. HPLC with pre-column derivatization was used to analysis the levels of AAs in rat plasma, urine, spinal fluid,tissue samples of mammals[20,23-24]. Based on the method of PITC derivatization, we used HPLC with DAD to separate and analyze the free AAs levels in rat’s plasma samples.
In this study, we established a method for detecting AAs contents in plasma. A single, reliable analytical method was required. We finally selected a 3 μm column (4.6×150 mm)from several different lengths, internal diameter and filler particle, such as Venusil MP C18 3 μm 2.1×100 mm, Acclaim C18 5 μm 4.6×250 mm and Atlantis dC18 3 μm 4.6×150 mm.Furthermore, we optimized the separation procedure of different gradients to obtain an appropriate resolution value.We tested different gradients from conditions according to previously method[33]. The response variable used in this way was the chromatographic resolution of the AA standard solutions. The retention time reproducibility of 18 kinds of AAs was studied, finally gradient elution was selected.
In this study, we found that plasma AAs was significant difference between EAU and control group. There were 9 kinds of AAs in EAU rats whose concentrations were lower than in control group, 5 kinds of AAs were higher in EAU (Figure 3,Table 3). Notably among these AAs, Tyr, Gly, Met, His, Ala,Glu, Try, Pro and Asp were decereased, while the levels of Leu, Thr, Val, Iso and Cys were increased. The most decreased AA was Tyr, which is the essential AA, and related to Tyr with dopa, dopamine, norepinephrine and epinephrine, and also the product of metabolism of phenylalanine. In this study,the content of Phe was hardly changed. In contrast, the most increased AA was Leu, demonstrating that signal transduction pathways related to Leu may contribute to interpretation of cellular signals[34]. Moreover, AAs can also influence protein by regulating protein synthesis and degradation. Because of Tyr, Leu, Gly and Met represent a biologic molecules exerting dynamic, highly disparate physiologic processes in EAU.Thus, we have applied an analytical tools to understand of AA in EAU.
Metabolic profiling can provide a window to study of systematic and functional living organisms[35]. The role of AAs in ophthalmology is growing, which lots of studies has been demonstrated[20-21]. Plasma metabolites was source of information about metabolic events in the organism[36]. AAs play important roles in retinal function and neurotransmission[37]. Many ocular diseases related changes to AA levels[38]. Each AA is the result of a balance between input and removal. The change of AAs in the plasma of EAU may represent markers of changed catabolism in these rats and play a role.
In the study, we found that tyrosine and histidine were significantly lower in plasma in EAU rats than in control samples. Tyr is a semi-essential AA that is only synthesized by the hydroxylation of phenylalanine and by the enzyme phenylalanine hydroxylase[39]. Histidine is an alpha-AA, which precursor for histamine and carnosine biosynthesis. Histidine metabolism are marked by increased histidine. Elevated level of histidine is accompanied by symptoms from mental to physical retardation. Histidine have anti-oxidant, antiinflammatory and anti-secretory properties[40]. Histidine has been shown to reduce insulin resistance, suppress in flammation and oxidative stress in metabolic syndrome obese women.Furthermore, histidine appears to suppress pro-inflammatory expression via NF-κB pathway by increasing oxidative stress within adipocytes[41]. Low histidine are associated with inflammation, protein-energy wasting, and greater mortality in patients with chronic kidney disease[42]. Low His maybe caused by switch from oxidative phosphorylation to glycolysis.Therefore, we speculate that observed decreases in plasma Tyr and His concentration may be attributable to the cause of EAU pathological changes. Nevertheless, further studies are needed to investigate these possibilities in uveitis.
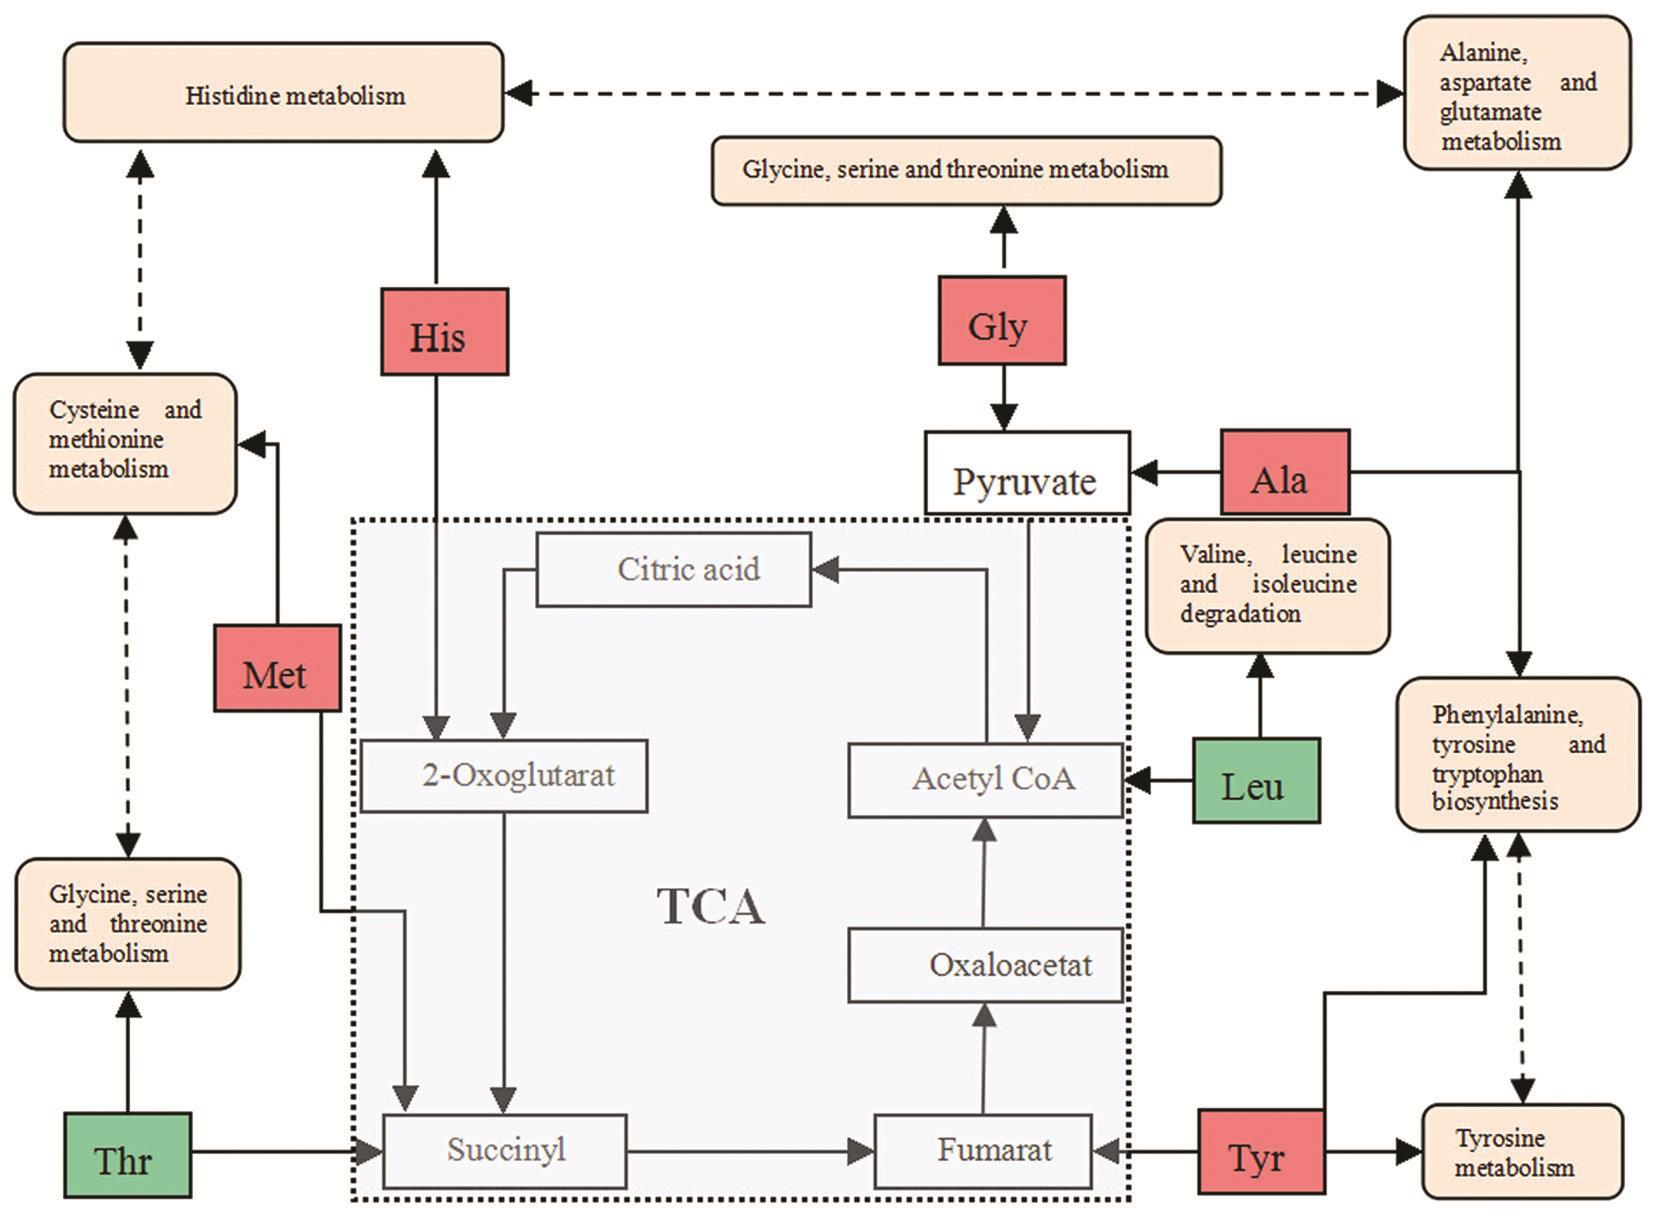
The biomarkers and their metabolic pathways merely show the isolated change of plasma AAs in EAU. However, the metabolic network built combined with biomarkers and metabolic pathways can display the holistic changes. These AAs metabolites correlated with each other affected six metabolic pathways (Figure 5). Tricarboxylic acid (TCA) cycle is a major source of adenosine triphosphate production, correlated with pathways for AA, fat, and glucose metabolisms[43]. The TCA cycle bypassed the switch from oxidative phosphorylation to glycolysis is a core pathway for the metabolism of AAs[44-45].Therefore, we hypothesize that the imbalance of AAs in the plasma in EAU rats will influence the TCA cycle by switch from oxidative phosphorylation to glycolysis. The decreased and increased levels of AAs indicate the disturbance of TCA cycle. We herein consider that the metabolic biomarkers and pathways are impacted by the conditions of internal environment based on the results obtained from plasma metabolomic profiling.
In this study, we reported the development of the model AAs analysis of the plasma samples in EAU and determination the differences of AA levels in experimental group and control.The results show that the metabolic profile in EAU rats was different from control groups five AAs concentrations were increased and nine AAs were reduced. The content of Tyr,Gly, Met, His, Ala, Leu and Thr was differences of AA in experimental group and control. It was also found that EAU might be related to five metabolic pathways, such as glycine,serine and threonine metabolism, etc. These results suggest that plasma metabolic profiling of AAs could be a platform for understanding EAU. The developed method is simple,rapid and convenient for AAs in EAU rat plasma, and these findings will provide a comprehensive insight on the metabolic profiling of the pathological changes in EAU.
ACKNOWLEDGEMENTS
Foundations: Supported by the National Natural Science Foundation of China (No.81373826; No.81674032);Natural Science Foundation of Shandong Province (No.ZR2014HQ074); Key Development & Research Program of Shandong Province (No.2017GSF19110).
Confiicts of Interest: Guo JG, None; Guo XM, None; Wang XR, None; Tian JZ, None; Bi HS, None.
REFERENCES
1 Lyu C, Bing SJ, Wandu WS, Xu B, Shi G, Hinshaw SJ, Lobera M,Caspi RR, Lu L, Yang J, Gery I. TMP778, a selective inhibitor of RORγt,suppresses experimental autoimmune uveitis development, but affects both Th17 and Th1 cell populations. Eur J Immunol 2018;48(11):1810-1816.
2 Zhao PT, Zhang LJ, Shao H, Bai LL, Yu B, Su C, Dong LJ, Liu X,Li XR, Zhang XM. Therapeutic effects of mesenchymal stem cells administered at later phase of recurrent experimental autoimmune uveitis.Int J Ophthalmol 2016;9(10):1381-1389.
3 Grif fiths PD. Viral disease of the year: anterior uveitis. Rev Med Virol 2018;28(6):e2015.
4 Fang S, Meng X, Zhang Z, Wang Y, Liu Y, You C, Yan H. Vorinostat modulates the imbalance of T cell subsets, suppresses macrophage activity, and ameliorates experimental autoimmune uveoretinitis.Neuromolecular Med 2016;18(1):134-145.
5 Zhang R, Qian J, Li X. Treatment of experimental autoimmune uveoretinitis with intravitreal injection of infliximab encapsulated in liposomes. Br J Ophthalmol 2017;101(12):1731-1738.
6 Busch M, Bauer D, Hennig M, Wasmuth S, Thanos S, Heiligenhaus A. Effects of systemic and intravitreal TNF-α inhibition in experimental autoimmune uveoretinitis. Invest Ophthalmol Vis Sci 2013;54(1):39-46.
7 Klaska IP, Forrester JV. Mouse models of autoimmune uveitis. Curr Pharm Des 2015;21(18):2453-2467.
8 Klaska IP, Muckersie E, Martin-Granados C, ChristofiM, Forrester JV. Lipopolysaccharide-primed heterotolerant dendritic cells suppress experimental autoimmune uveoretinitis by multiple mechanisms.Immunology 2017;150(3):364-377.
9 Watanabe T, Keino H, Kudo A, Sato Y, Okada AA. MicroRNAs in retina during development of experimental autoimmune uveoretinitis in rats. Br J Ophthalmol 2016;100(3):425-431.
10 Gholizadeh A. The possible involvement of D-amino acids or their metabolites in Arabidopsis cysteine proteinase/cystatin N-dependent proteolytic pathway. Tsitol Genet 2015;49(2):3-10.
11 Furuse M. Screening of central functions of amino acids and their metabolites for sedative and hypnotic effects using chick models. Eur J Pharmacol 2015;762:382-393.
12 Semba RD, Gonzalez-Freire M, Moaddel R, Sun K, Fabbri E, Zhang P,Carlson OD, Khadeer M, Chia CW, Salem N, Ferrucci L. Altered plasma amino Acids and lipids associated with abnormal glucose metabolism and insulin resistance in older adults. J Clin Endocrinol Metab 2018;103(9):3331-3339.
13 Gar C, Rottenkolber M, Prehn C, Adamski J, Seissler J, Lechner A.Serum and plasma amino acids as markers of prediabetes, insulin resistance, and incident diabetes. Crit Rev Clin Lab Sci 2018;55(1):21-32.
14 Kosmides AK, Kamisoglu K, Calvano SE, Corbett SA, Androulakis IP. Metabolomic fingerprinting: challenges and opportunities. Crit Rev Biomed Eng 2013;41(3):205-221.
15 Lin W, Liu Z, Zheng X, Chen M, Gao D, Tian Z. High-salt diet affects amino acid metabolism in plasma and muscle of Dahl salt-sensitive rats.Amino Acids 2018;50(10):1407-1414.
16 Parveen A, Rizvi SH, Gupta A, Singh R, Ahmad I, Mahdi F, Mahdi AA. NMR-based metabonomics study of sub-acute hepatotoxicity induced by silica nanoparticles in rats after intranasal exposure. Cell Mol Biol 2012;58(1):196-203.
17 Guijarro-Díez M, Nozal L, Marina ML, Crego AL. Metabolomic fingerprinting of saffron by LC/MS: novel authenticity markers. Anal Bioanal Chem 2015;407(23):7197-7213.
18 Kandasamy P, Gyimesi G, Kanai Y, Hediger MA. Amino acid transporters revisited: new views in health and disease. Trends Biochem Sci 2018;43(10):752-789.
19 Anderson JG, Hintze K, Marchant ED. Restricting branched-chain amino acids: an approach to improve metabolic health. J Physiol 2018;596(13):2469-2470.
20 Rossary A, Farges MC, Lamas B, Miles EA, Noakes PS, Kremmyda LS, Vlachava M, Diaper ND, Robinson SM, Godfrey KM, Calder PC,Vasson MP. Increased consumption of salmon during pregnancy partly prevents the decline of some plasma essential amino acid concentrations in pregnant women. Clin Nutr 2014;33(2):267-273.
21 Dunstan RH, Sparkes DL, Macdonald MM, De Jonge XJ, Dascombe BJ, Gottfries J, Gottfries CG, Roberts TK. Diverse characteristics of the urinary excretion of amino acids in humans and the use of amino acid supplementation to reduce fatigue and sub-health in adults. Nutr J 2017;16(1):19.
22 Hill CM, Morrison CD. Dietary branched chain amino acids and metabolic health: when less is more. J Physiol 2018;596(4):555-556.
23 Zhou Y, Qiu L, Xiao Q, Wang Y, Meng XY, Xu R, Wang SY, Na R.Obesity and diabetes related plasma amino acid alterations. Clin Biochem 2013;46(15):1447-1452.
24 Mo XM, Li Y, Tang AG, Ren YP. Simultaneous determination of phenylalanine and tyrosine in peripheral capillary blood by HPLC with ultraviolet detection. Clin Biochem 2013;46(15):1074-1078.
25 Reidy PT, Rasmussen BB. Role of ingested amino acids and protein in the promotion of resistance exercise-induced muscle protein anabolism. J Nutr 2016;146(2):155-183.
26 Hu RG, Zhu Y, Donaldson P, Kalloniatis M. Alterations of glutamate,glutamine, and related amino acids in the anterior eye secondary to ischaemia and reperfusion. Curr Eye Res 2012;37(7):633-643.
27 Tian QM, Bi HS, Cui Y, Guo DD, Xie XF, Su WH, Wang XR.Qingkailing injection alleviates experimental autoimmune uveitis in rats via inhibiting Th1 and Th17 effector cells. Biol Pharm Bull 2012;35(11):1991-1996.
28 Jha P, Manickam B, Matta B, Bora PS, Bora NS. Proteolytic cleavage of type I collagen generates an autoantigen in autoimmune uveitis. J Biol Chem 2009;284(45):31401-31411.
29 Song JK, Bi HS, Xie XF, Guo JG, Wang XR, Liu DM. Preparation and evaluation of sinomenine hydrochloride in situ gel for uveitis treatment.Int Immunopharmacol 2013;17(1):99-107.
30 Chong IG, Jun CH. Performance of some variable selection methods when multicollinearity is present. Chemometr Intell Lab Syst 2015;78(1-2):103-112.
31 Lorenzo MP, Villaseñor A, Ramamoorthy A, Garcia A. Optimization and validation of a capillary electrophoresis laser-induced fluorescence method for amino acids determination in human plasma: application to bipolar disorder study. Electrophoresis 2013;34(11):1701-1709.
32 Huang X, Kao SJ, Lin J, Qin X, Deng C. Development and validation of a HPLC/FLD method combined with online derivatization for the simple and simultaneous determination of trace amino acids and alkyl amines in continental and marine aerosols. PLoS One 2018;13(11):e0206488.
33 Cohen SA, Bidlingmeyer BA, Tarvin TL. PITC derivatives in amino acid analysis. Nature 1986;320(6064):769-770.
34 Kurt TD, Jiang L, Bett C, Eisenberg D, Sigurdson CJ. A proposed mechanism for the promotion of prion conversion involving a strictly conserved tyrosine residue in the β2-α2 loop of PrPC. J Biol Chem 2014;289(15):10660-10667.
35 Suarez-Diez M, Saccenti E. Effects of sample size and simensionality on the performance of four algorithms for inference of association networks in metabonomics. J Proteome Res 2015;14(12):5119-5130.
36 Iida M, Harada S, Kurihara A, et al. Profiling of plasma metabolites in postmenopausal women with metabolic syndrome. Menopause 2016;23(7):749-758.
37 Nivison-Smith L, Chua J, Tan SS, Kalloniatis M. Amino acid signatures in the developing mouse retina. Int J Dev Neuro sci 2014;33(2014):62-80.
38 Gibson R, Fletcher EL, Vingrys AJ, Zhu Y, Vessey KA, Kalloniatis M. Functional and neurochemical development in the normal and degenerating mouse retina. J Comp Neurol 2013;521(6):1251-1267.
39 Pena MJ, Lambers Heerspink HJ, Hellemons ME, Friedrich T,Dallmann G, Lajer M, Bakker SJ, Gansevoort RT, Rossing P, de Zeeuw D, Roscioni SS. Urine and plasma metabolites predict the development of diabetic nephropathy in individuals with type 2 diabetes mellitus. Diabet Med 2014;31(9):1138-1147.
40 Lopez-Rituerto E, Avenoza A, Busto JH, Peregrina JM. NMR study of histidine metabolism during alcoholic and malolactic fermentations of wine and their in fluence on histamine production. J Agric Food Chem 2013;61(39):9464-9469.
41 Feng RN, Niu YC, Sun XW, Li Q, Zhao C, Wang C, Guo FC, Sun CH, Li Y. Histidine supplementation improves insulin resistance through suppressed in flammation in obese women with the metabolic syndrome: a randomised controlled trial. Diabetologia 2013;56(5):985-994.
42 Wan PJ, Yuan SY, Tang YH, Li KL, Yang L, Fu Q, Li GQ. Pathways of amino acid degradation in nilaparvata lugens (Stål) with special reference to lysine-ketoglutarate reductase/saccharopine dehydrogenase (LKR/SDH). PLoS One 2015;10(5):e0127789.
43 Izac M, Garnier D, Speck D, Lindley ND. A functional tricarboxylic acid cycle operates during growth of bordetella pertussis on amino acid mixtures as sole carbon substrates. PLoS One 2015;10(12):e0145251.
44 Kakazu E, Kondo Y, Kogure T, Ninomiya M, Kimura O, Ueno Y, Shimosegawa T. Plasma amino acids imbalance in cirrhotic patients disturbs the tricarboxylic acid cycle of dendritic cell. Sci Rep 2013;3:3459.
45 Mansilla WD, Htoo JK, de Lange CFM. Replacing dietary nonessential amino acids with ammonia nitrogen does not alter amino acid profile of deposited protein in the carcass of growing pigs fed a diet deficient in nonessential amino acid nitrogen. J Anim Sci 2017;95(10):4481-4489.
Citation: Guo JG, Guo XM, Wang XR, Tian JZ, Bi HS. Metabolic profile analysis of free amino acids in experimental autoimmune uveoretinitis rat plasma. Int J Ophthalmol 2019;12(1):16-24
DOl:10.18240/ijo.2019.01.03
● KEYWORDS: experimental autoimmune uveoretinitis;phenylisothiocyanate; high performance liquid chromatography;amino acid; metabolic profile; rat
Correspondence to: Jing-Zhen Tian. No.4655, Daxue Road,Jinan 250355, Shandong Province, China. tianjingzhen@163.com; Hong-Sheng Bi. No.48, Yingxiongshan Road, Jinan 250002, Shandong Province, China. hongshengbi1@163.com Received: 2018-01-17 Accepted: 2018-11-21