Evaluation of spectral domain optical coherence tomography parameters in discriminating preperimetric glaucoma from high myopia
Xiao-Yu Xu, Hui Xiao, Jing-Yi Luo, Xing Liu
State Key Laboratory of Ophthalmology, Zhongshan Ophthalmic Center, Sun Yat-sen University, Guangzhou 510060, Guangdong Province, China
Abstract● AlM: To evaluate the diagnostic ability of macular ganglion cell-inner plexiform layer (GClPL) thickness obtained by spectral-domain optical coherence tomography (SD-OCT) in discriminating non-highly myopic eyes with preperimetric glaucoma (PPG) from highly myopic healthy eyes.● METHODS: A total of 254 eyes, including 76 normal controls (NC), 116 eyes with high myopia (HM) and 62 non-highly myopic eyes with PPG were enrolled. The diagnostic ability of OCT parameters was accessed by the areas under the receiver operating characteristic (AUROC)curve in two distinguishing groups: PPG eyes with nonglaucomatous eyes including NC and HM (Group 1), and PPG eyes with HM eyes (Group 2). Differences in diagnostic performance between GClPL and RNFL parameters were evaluated.● RESULTS: The minimum (AUROC curve of 0.782),inferotemporal (0.758) and inferior (0.705) GClPL thickness were the top three GClPL parameters in discriminating PPG from non-glaucomatous eyes, all of which had statistically significant lower diagnostic ability than average RNFL thickness (0.847). ln discriminating PPG from HM, the best GClPL parameter was minimum (0.689),statistically significant lower in diagnostic ability than average RNFL thickness (0.789) and three other RNFL thickness parameters of temporal and inferotemporal clock-hour sectors.● CONCLUSlON: The minimum GClPL thickness is the best GClPL parameter to detect non-highly myopic PPG from highly myopic eyes, whose diagnostic ability is inferior
INTRODUCTION
It is believed that almost half of the world’s population is likely to develop myopia by the year of 2050, as many as 10% of whom have high myopia (HM)[1]. One of its common associated pathologies is primary open angle glaucoma(POAG), a progressive optic neuropathy characterized by progressive loss of retinal ganglion cells (RGCs) and their axons, eventually resulting in visual field loss. Diagnosis of early glaucoma in highly myopic eyes is challenging because HM itself shares some morphological and functional similarity with POAG, including peripapillary retinal nerve fiber layer(RNFL) thinning, peripapillary crescent, optic disc torsion and tilting, shallow and large cup, and non-progressive visual field defect[2]. At molecular level, the two conditions also showed some associations including the similarity of collagen changes and hypersensitive responses to glucocorticoids[3]. Moreover,the visual field defect cannot be detected until 30%-50% of RGCs are lost[4]. Thus, distinguishing eyes with characteristic glaucomatous structural changes, but without detectable visual field loss, termed preperimetric glaucoma (PPG), in eyes with HM, is even harder in clinical practice. More effective and accurate diagnostic tools and parameters are needed.
As optical coherence tomography (OCT) technology evolves over the past 20y, OCT-based RNFL and ONH evaluation have become a mainstream methodology in diagnosing and monitoring of glaucoma. Recently, several studies have demonstrated that ganglion cell-inner plexiform layer (GCIPL)thickness performs better than, or comparable to RNFL thickness in detecting glaucoma[5-9]. However, reports on glaucoma diagnosis for highly myopic eyes showed conflicting results, due to factors including greater variability of RNFL and GCIPL thickness in highly myopic eyes[10], differences in the characteristics of study populations, and possible statistical bias.To clinicians, it is the detection of glaucoma in its earliest stage, not in the moderate or late stage, counts for greater clinical significance and challenge. However, evaluations of the diagnostic ability of OCT parameters in PPG eyes were rare.In non-highly myopic eyes, Begum et al[11] reported that the diagnostic ability of the GCIPL parameters was similar to that of the RNFL and ONH parameters in diagnosing perimetric glaucoma, but significantly lower than those of the RNFL and ONH parameters in distinguishing PPG. Aydogan et al[12]reported that the average RNFL thickness and rim volume surpassed GCIPL parameters in diagnosing PPG. But Kim et al[13] and Sung et al[14] showed that the GCIPL parameters were comparable with the RNFL and ONH parameters in diagnosing PPG in Korean populations.
To the best of our knowledge, the only study that included highly myopic PPG eyes was from Seol et al[15]. They reported that the inferotemporal macular GCIPL thickness was the best parameter in discriminating highly myopic PPG eyes from highly myopic healthy eyes, with significantly better performance than other OCT parameters. However, many studies have shown that the GCIPL thickness is highly correlated to the RNFL thickness[16-17]. It is expected that the GCIPL thickness thinning can also be detected in PPG eyes,whose RNFL thickness decrease, as the disease definition indicates. In Seol et al’s[15] study, the dioptric difference was insignificant between case (highly myopic PPG eyes) and control (highly myopic healthy eyes). Hence, the in fluence of high myopia on GCIPL thickness could be regarded as equal between the two groups. After adjusting for the influence of high myopia, it was not surprising that GCIPL thickness had good diagnostic performance in identifying PPG from healthy eyes. As far as we know, there has no studies by far regarding the performance of OCT parameters in diagnosing nonhighly myopic PPG from highly myopic healthy eyes, a more confusing clinical scenario. Therefore, the purpose of our study was 2-fold: to investigate the diagnostic ability of macular GCIPL thickness parameters in differentiating non-highly myopic PPG from highly myopic healthy eyes, and to compare their performances with those of RNFL thickness parameters.
SUBJECTS AND METHODS
Ethical Approval The study followed the tenets of the Declaration of Helsinki and was approved by our Institutional Review Board (IRB). Written informed consent was obtained from all participants.
Participants Participants were consecutively enrolled at Zhongshan Ophthalmic Center of Sun Yat-sen University,Guangzhou, China from August 2014 to December 2015.
All participants underwent ophthalmic examinations, including examinations of uncorrected and best-corrected visual acuity(BCVA), slit lamp biomicroscopy examination, intraocular pressure (IOP) measurement using a Goldman applanation tonometer, gonioscopy, dilated fundus examination, stereo disc photography (Kowa nonmyd a-D III; Kowa Optimed Inc, Aichi, Japan), visual field testing (Humphrey Visual Field Analyzer II with SITA standard 24-2; Carl Zeiss Meditec,Dublin, CA, USA), and OCT scanning (Cirrus HD-OCT; Carl Zeiss Meditec, Dublin, CA, USA). Manifest refraction and cycloplegic refraction following instillation of three drops of 0.5% tropicamide and 0.5% phenylephrine (Mydrin-P, Santen,Osaka, Japan) were obtained with autorefractor (KR-8900;Topcon Corporation, Tokyo, Japan). The refraction data were converted to spherical equivalent [the spherical diopter (D)plus one-half the cylindrical dioptric power].
PPG was defined as the appearance of structural glaucomatous changes (RNFL defects corresponding to glaucomatous optic disc changes) with a normal perimetry test. Glaucomatous optic disc changes were defined on stereoscopic color disc photography as vertical cup/disc ratio (C/D) of greater than 0.6,C/D asymmetry of greater than 0.2, neuroretinal rim thinning,notching, or excavation. The stereoscopic disc photography was assessed separately by two glaucoma specialists (Xu XY and Xiao H) who were masked to all clinical information. Any inconsistencies between these two doctors were reevaluated and decided by a third senior glaucoma specialist (Liu X). If all three doctors did not agree on the classification, the eye was not used for further analysis. A normal visual field was defined as a mean deviation (MD) and pattern standard deviation(PSD) within the 95% confidence limit and a glaucoma hemifield test result within the normal limits.
High myopia as defined as cycloplegic refraction of -6 D or lower in individuals <30y of age, or manifest refraction of -6 D or lower in individuals ≥30y of age, with BCVA of at least 20/20 and without other known ocular or systemic diseases.
Normal eyes were defined as eyes with BCVA of at least 20/20,reliable normal perimetry results, normal disc appearance,no RNFL defects, IOP less than 21 mm Hg, and without any known ocular or systemic diseases.
The inclusion criteria were: age ≥18y, gonioscopy-confirmed open angle, macular cube scans and optic disc cube scans of good quality, and reliable visual field testing results (defined as fixation losses less than 20%, and both false-positive and false-negative rates less than 15%). For PPG group and normal control (NC), only those who with refraction between -3 D to +3 D (spherical equivalent) were included for this study.Exclusion criteria were: unsuccessful image acquisition due to reasons such as refractive media opacity, poor fixation and poor dilation; history of uveitis, vitreoretinal diseases,nonglaucomatous optic neuropathy or ocular trauma; previous intraocular surgery; medications usage that could possibly induce secondary glaucoma or optic neuropathy; neurological or systemic diseases that could affect retina health and visual field results; any current life-threatening diseases. One eye was randomly selected for the study if both eyes of a participant met the inclusion criteria.
Optical Coherence Tomography Measurements OCT data were obtained from qualifying eyes dilated with 0.5%tropicamide and 0.5% phenylephrine with the same Cirrus HDOCT device (Cirrus 6.5 software) by a well-trained examiner(Xu XY). At least 3 scans were obtained by Macular Cube 512×128 protocol (128 horizontal B-scans comprising 512 A-scan per B-scan within a cube measuring 6×6×2 mm3 centered at the foveal) and Optic Disc Cube 200×200 protocol (200 horizontal B-scans comprising 200 A-scan per B-scan within a cube measuring 6×6×2 mm3 centered at optic disc center),respectively at the same visit. A 5-minute interval between each scan was guaranteed and artificial tear was provided if dryness or dazzle was complained by the participants. Images with signal strength of <6 and those with visible eye motion or blinking artifacts (discontinuous jump) and segmentation failure were considered of poor quality and discarded.
The ganglion cell analysis (GCA) algorithm was used to process the data obtained by Macular Cube 512×128 protocol to calculate the thickness of the macular GCIPL within a 14.13 mm2 elliptical annulus area (dimensions: a vertical inner and outer radius of 0.5 mm and 2.0 mm and a horizontal inner and outer radius of 0.6 and 2.4 mm, respectively) centered on the fovea. The algorithm identifies the outer boundary of the RNFL and the IPL so that the combined thickness of the GCL and IPL (termed “GCIPL”) was yielded. The average,minimum, and sectoral (superior, superonasal, inferonasal,inferior, inferotemporal, and superotemporal) GCIPL thickness was analyzed. The minimum GCIPL thickness was defined as the minimum measurement of the 1-degree intervals by sampling 360 spokes extending from the center of the fovea to the edge of the ellipse. As for peripapillary RNFL thickness parameters, the average RNFL, and the 12-clock-hour RNFL thickness were included in the study. The superonasal RNFL thickness (1 o’clock for the right eyes and 11 o’clock for the left eyes) was labeled as S1, and the RNFL thickness of 12 o’clock was labeled as S2. S3 to S12 was labeled sequentially in an anticlockwise direction for right eyes and in a clockwise direction for left eyes.
Statistical Analysis Statistical analyses were performed using SPSS version 22.0 (SPSS Inc., Chicago, IL, USA). The data were analyzed with frequency and descriptive statistics.Kolmogorov-Smirov test and Levene test were conducted to test the normality and homogeneity of variance, respectively.Age, IOP, refraction, MD, GCIPL and RNFL thickness was compared between groups using analysis of variance(ANOVA). Multiple comparisons with Bonferroni adjustments were used for pairwise comparisons. The glaucoma diagnostic ability of each OCT parameter was determined by the area under the receiver operating characteristic (AUROC) curve.Age-adjusted AUROCs were further performed between groups using a covariate adjustment regression method[18-19].The glaucoma diagnostic ability of OCT parameters was assessed in two distinguishing groups: eyes with PPG and non-glaucomatous eyes including normal controls and highly myopic eyes (Group 1), and eyes with PPG and highly myopic eyes (Group 2). The AUROCs of different variables were compared using MedCalc software version 12.0 (Med-Calc Statistical Software bvba, Mariakerke, Belgium) based on the method of DeLong et al[20]. P<0.05 was considered statistically significant.
RESULTS
A total of 254 eyes were included in this study. The baseline demographic and clinical characteristics were displayed in Table 1. Compared with normal control subjects and subjects with high myopia, patients with PPG were significantly older(all P<0.001). The IOP showed significant difference between groups (P=0.046). The refraction of normal eyes and eyes with PPG were of no statistical difference (P=0.909). The MD of perimetry test was of no significant difference between each group (P=0.065).
The macular GCIPL thickness and peripapillary RNFL thickness of each group as well as the pairwise comparisons were presented in Table 2. Almost all GCIPL parameters decreased from normal control, high myopia to PPG. However,the RNFL thickness, especially the temporal and nasal RNFL thickness, lacked such regularity. Significant differences between each group were found in all parameters but the nasal RNFL thickness (S10 and S11). For further pairwise comparisons, all GCIPL thickness of HM and PPG were significantly thinner than NC, respectively. Only minimum,inferior and inferotemporal GCIPL thickness of the highly myopic eyes were significantly thicker than those of eyes with PPG. The average RNFL thickness and almost all superior and inferior RNFL thickness of HM and PPG were significantly thinner than NC. The temporal RNFL thickness of highly myopic eyes was the thickest, with statistical significance than those of NC and PPG eyes.
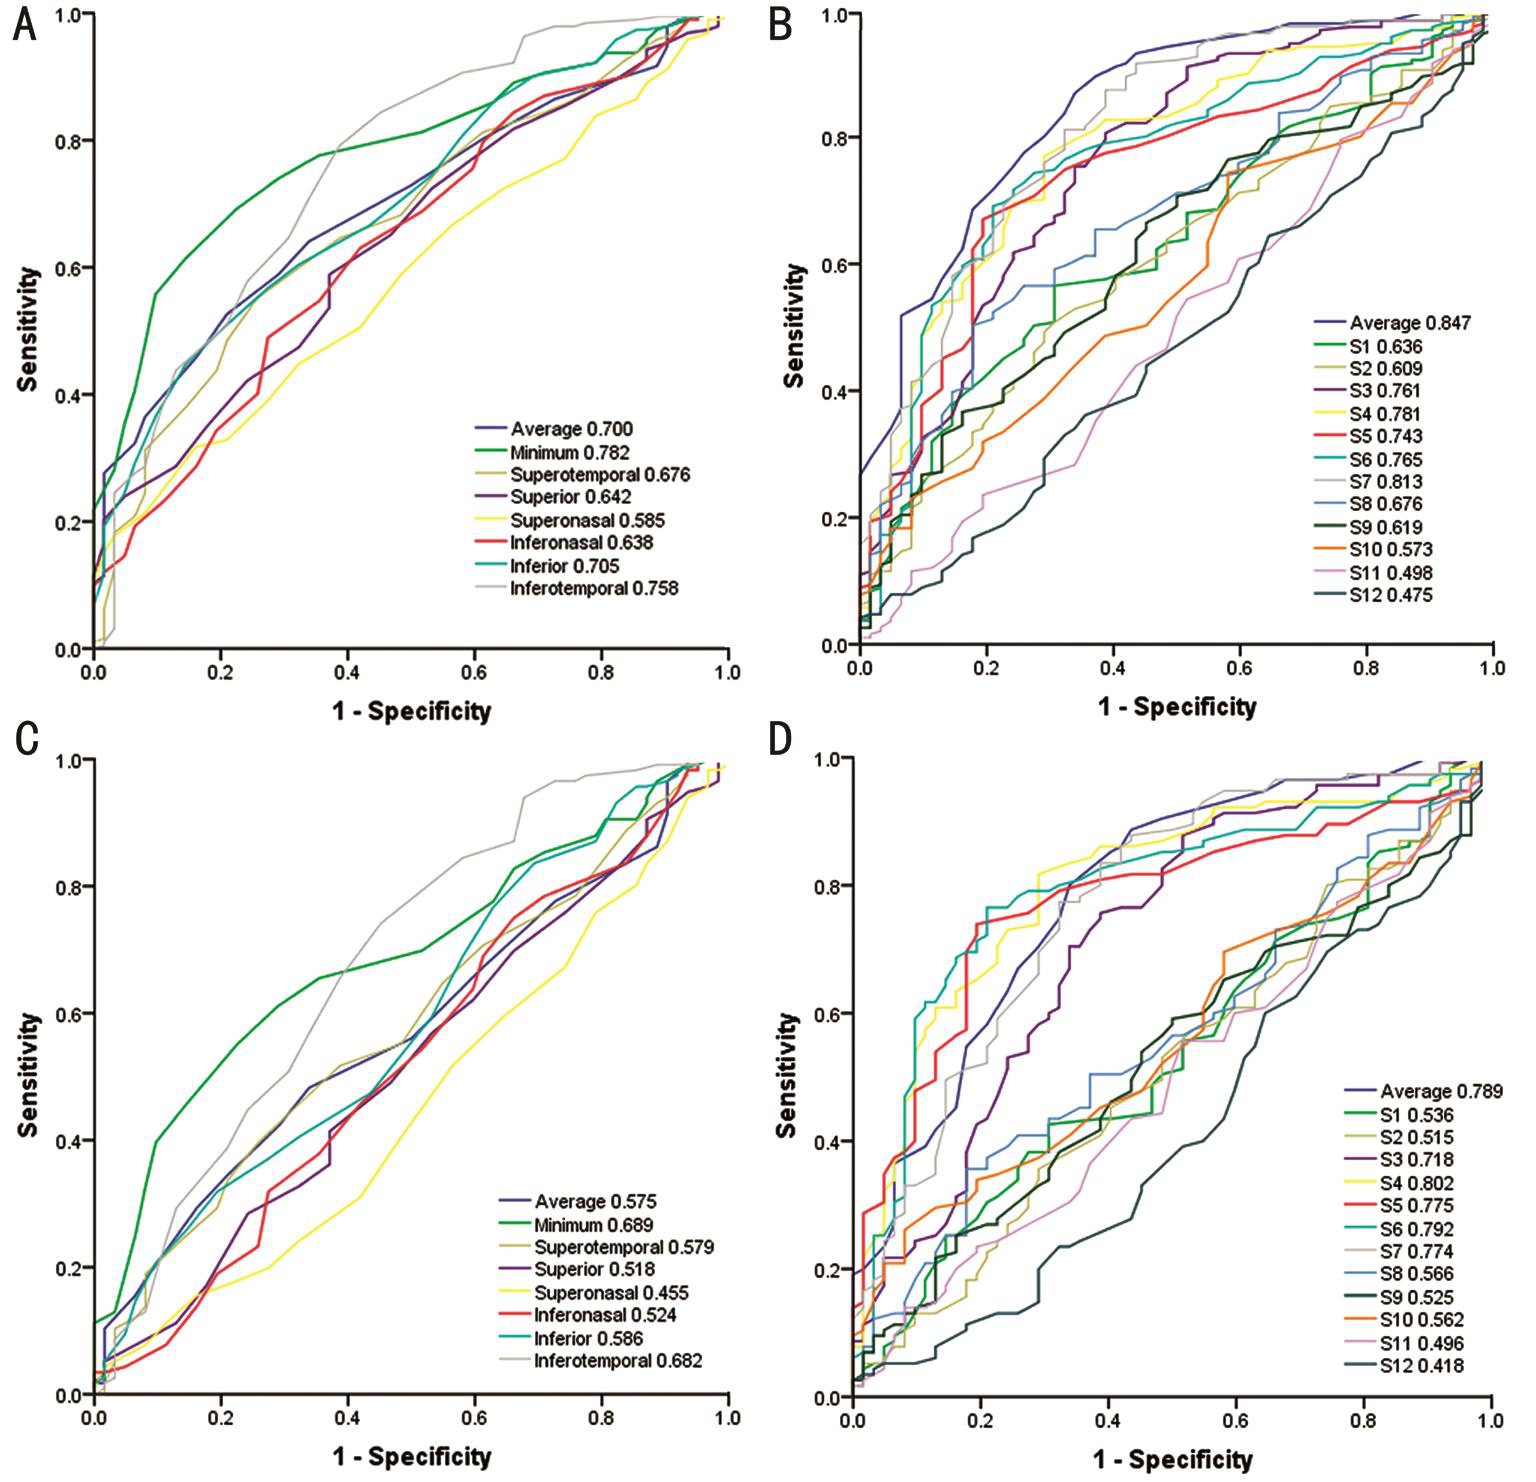
The age-adjusted AUROCs were summarized in Table 3 and Figure 1. In discriminating PPG from non-glaucomatous eyes,minimum GCIPL thickness was the GCIPL parameters withthe best diagnostic performance, followed by inferotemporal and inferior GCIPL thickness. Average RNFL thickness had the largest AUROC among all RNFL parameters, followed by RNFL thickness of S7 and S4. In discriminating PPG from highly myopic eyes, the rank of GCIPL parameters with distinctive diagnostic performance were identical with the first distinguishing group. Average RNFL thickness and RNFL thickness from S3 to S7 had higher AUROC (>0.7)than other RNFL parameters, in which the RNFL thickness of S4 demonstrated the best diagnostic ability among all RNFL parameters. There were statistically significant differences in AUROC between minimum GCIPL thickness and RNFL parameters (Table 4).
Table 1 Demographic and clinical characteristics of the study population

aValue are presented as mean±standard deviation; MD: Mean deviation.
Group Age (y)a Sex (M/F) Intraocular pressure (mm Hg) Refraction (D) MD (dB)Normal control (n=76) 28.1±6.9 32/44 14.3±3.5 -1.40±1.36 -0.89±0.85 High myopia (n=116) 27.9±6.3 36/26 15.0±3.9 -8.51±2.09 -1.03±1.01 Preperimetric glaucoma (n=62) 45.2±17.9 36/80 18.3±4.7 -1.62±1.72 -1.27±1.18
Table 2 Macular GCIPL and peripapillary RNFL thickness obtained by spectral-domain OCT
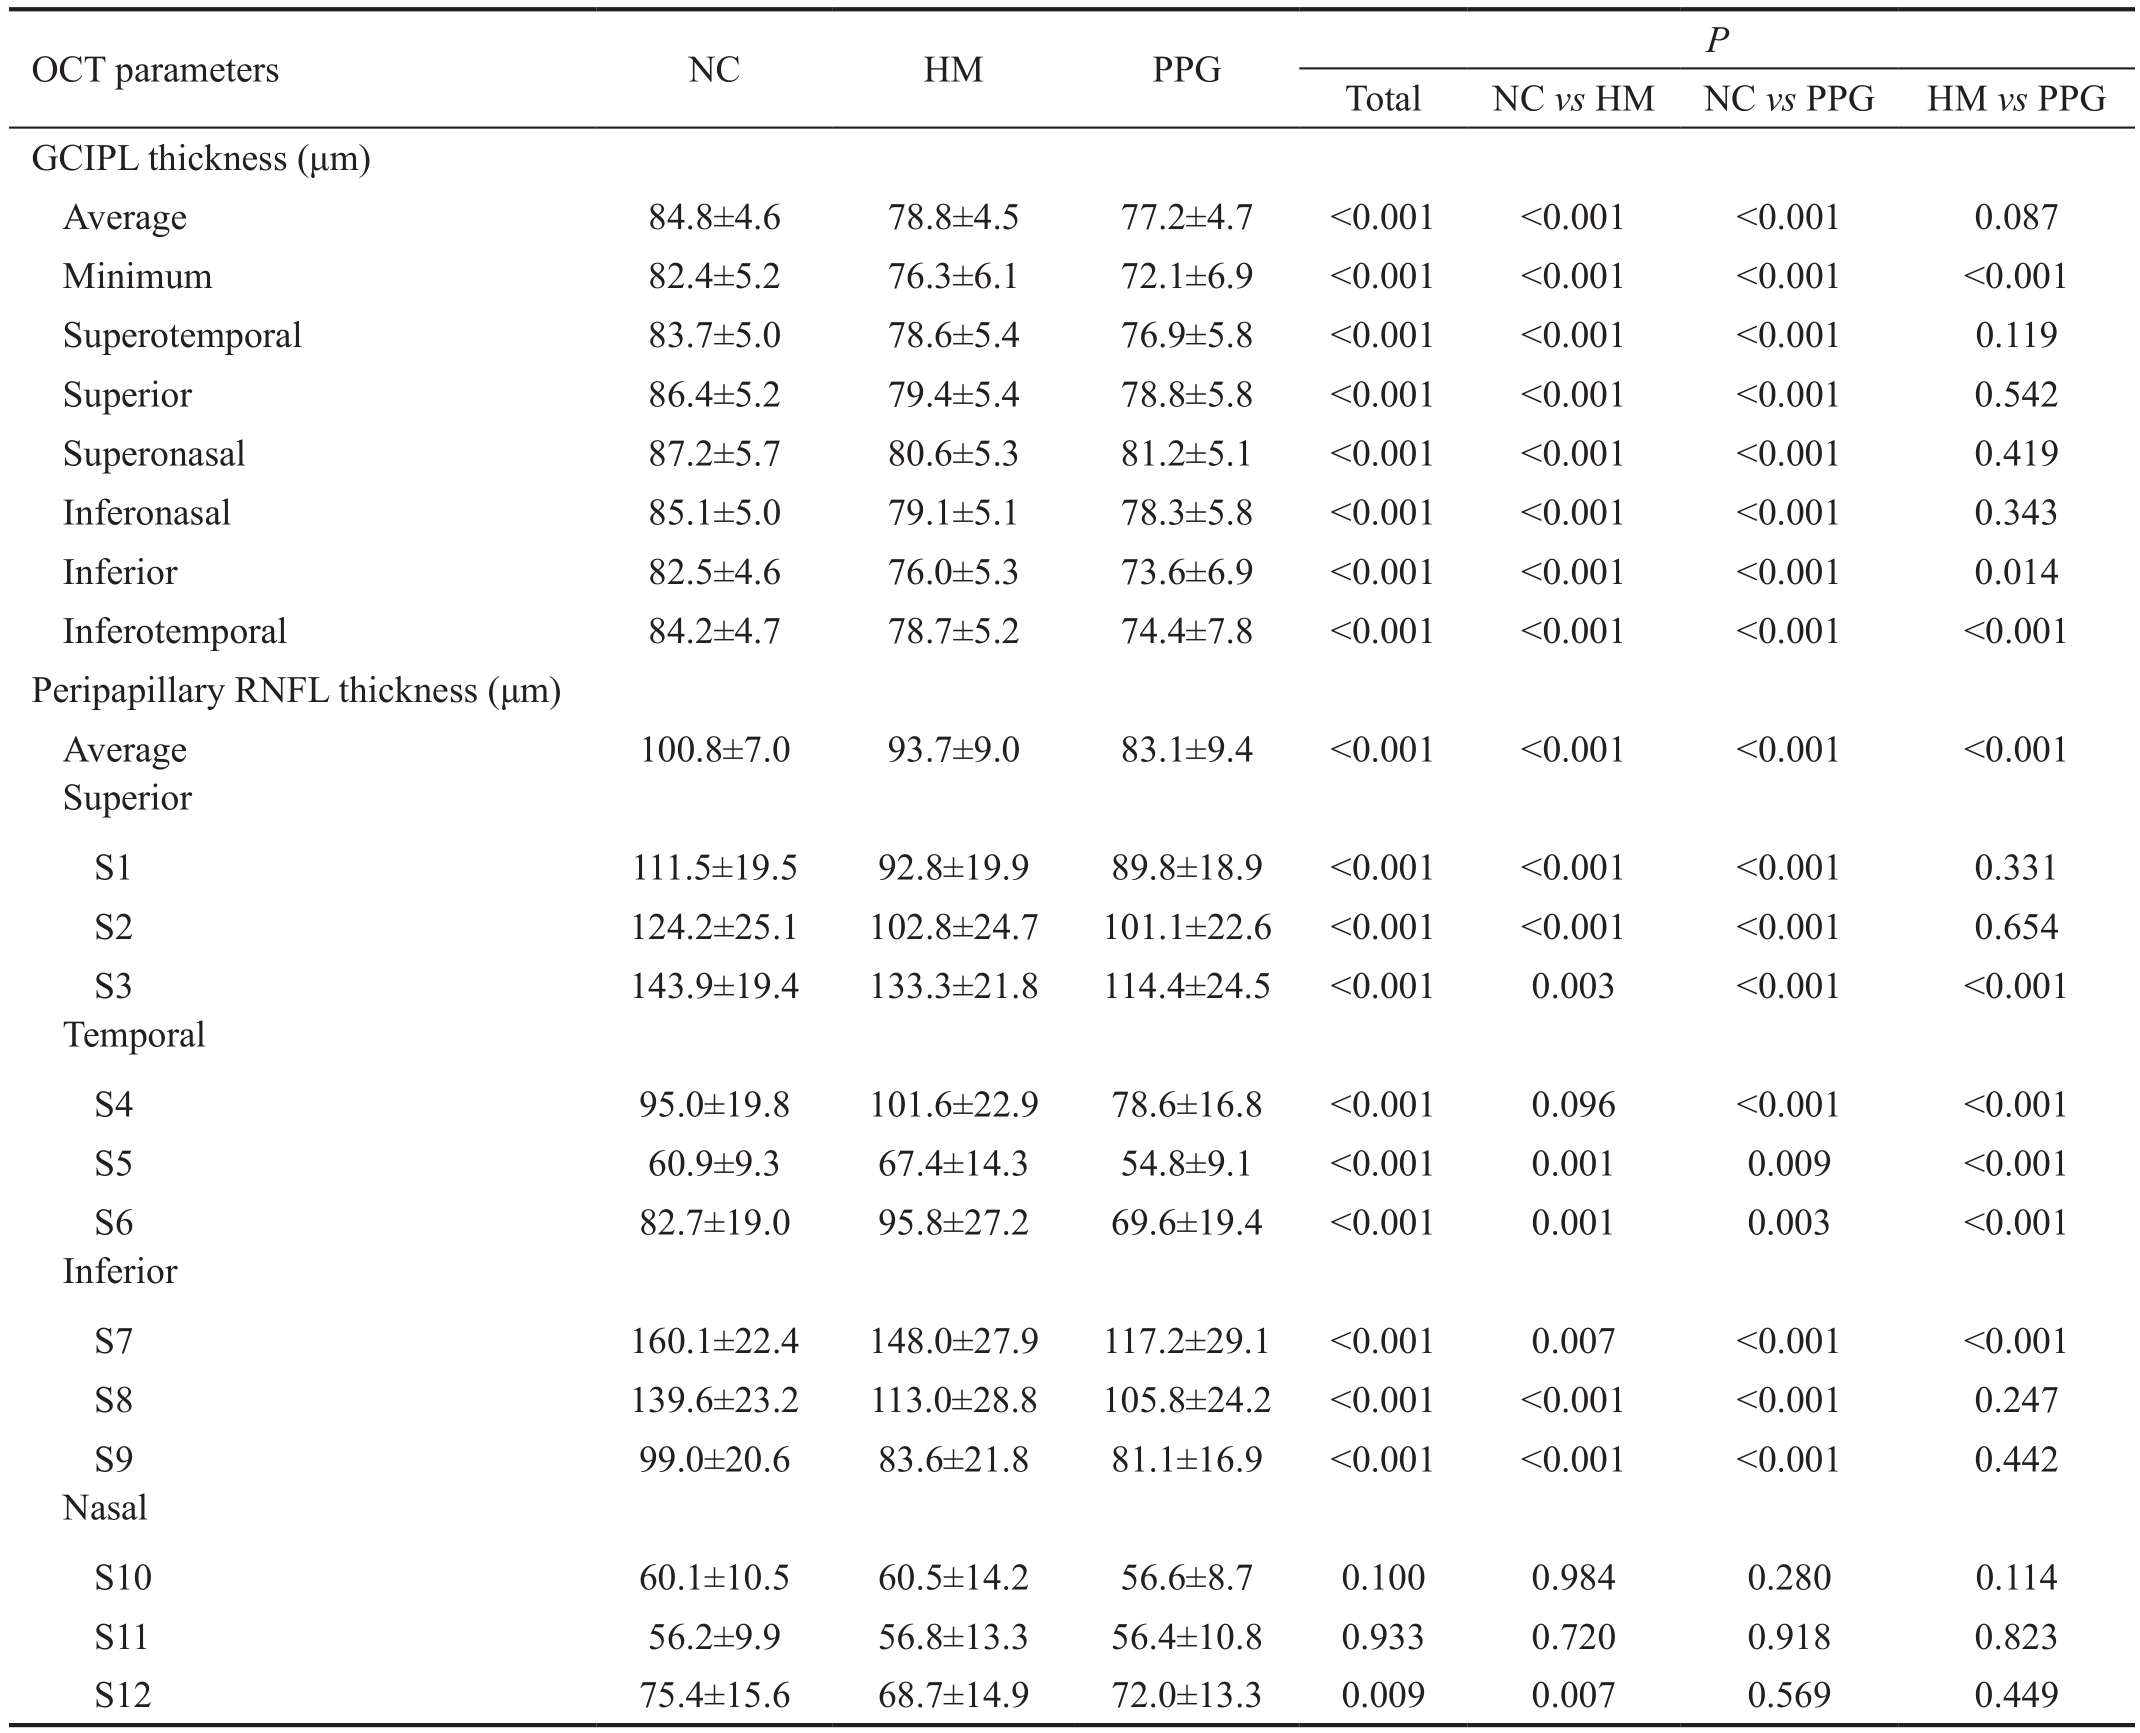
NC: Normal control; HM: High myopia; PPG: Preperimetric glaucoma; GCIPL: Ganglion cell-inner plexiform layer; RNFL: Retinal nerve fiber layer.
OCT parameters NC HM PPG P Total NC vs HM NC vs PPG HM vs PPG GCIPL thickness (μm)Average 84.8±4.6 78.8±4.5 77.2±4.7 <0.001 <0.001 <0.001 0.087 Minimum 82.4±5.2 76.3±6.1 72.1±6.9 <0.001 <0.001 <0.001 <0.001 Superotemporal 83.7±5.0 78.6±5.4 76.9±5.8 <0.001 <0.001 <0.001 0.119 Superior 86.4±5.2 79.4±5.4 78.8±5.8 <0.001 <0.001 <0.001 0.542 Superonasal 87.2±5.7 80.6±5.3 81.2±5.1 <0.001 <0.001 <0.001 0.419 Inferonasal 85.1±5.0 79.1±5.1 78.3±5.8 <0.001 <0.001 <0.001 0.343 Inferior 82.5±4.6 76.0±5.3 73.6±6.9 <0.001 <0.001 <0.001 0.014 Inferotemporal 84.2±4.7 78.7±5.2 74.4±7.8 <0.001 <0.001 <0.001 <0.001 Peripapillary RNFL thickness (μm)Average 100.8±7.0 93.7±9.0 83.1±9.4 <0.001 <0.001 <0.001 <0.001 Superior S1 111.5±19.5 92.8±19.9 89.8±18.9 <0.001 <0.001 <0.001 0.331 S2 124.2±25.1 102.8±24.7 101.1±22.6 <0.001 <0.001 <0.001 0.654 S3 143.9±19.4 133.3±21.8 114.4±24.5 <0.001 0.003 <0.001 <0.001 Temporal S4 95.0±19.8 101.6±22.9 78.6±16.8 <0.001 0.096 <0.001 <0.001 S5 60.9±9.3 67.4±14.3 54.8±9.1 <0.001 0.001 0.009 <0.001 S6 82.7±19.0 95.8±27.2 69.6±19.4 <0.001 0.001 0.003 <0.001 Inferior S7 160.1±22.4 148.0±27.9 117.2±29.1 <0.001 0.007 <0.001 <0.001 S8 139.6±23.2 113.0±28.8 105.8±24.2 <0.001 <0.001 <0.001 0.247 S9 99.0±20.6 83.6±21.8 81.1±16.9 <0.001 <0.001 <0.001 0.442 Nasal S10 60.1±10.5 60.5±14.2 56.6±8.7 0.100 0.984 0.280 0.114 S11 56.2±9.9 56.8±13.3 56.4±10.8 0.933 0.720 0.918 0.823 S12 75.4±15.6 68.7±14.9 72.0±13.3 0.009 0.007 0.569 0.449
DISCUSSION
In this study, we evaluated the diagnostic ability of macular GCIPL thickness parameters in discriminating non-highly myopic eyes with PPG from highly myopic eyes and compared their performances with those of peripapillary RNFL thickness parameters. The minimum GCIPL thickness was the best GCIPL parameter in discriminating PPG from HM, whose diagnostic ability was though statistically significantly lower than average RNFL thickness and three other RNFL thickness parameters in temporal and inferotemporal clockhour sectors.
In our study, all GCIPL thickness parameters were significantly thinner in HM group than in the control group. Although the retinal thickness in the central-most area tend to be preserved in high myopia[21], it has been well confirmed that the elongation of the globe leads to mechanical stretching and thinning of peripapillary RNFL and macular GCIPL in highly myopic eyes[22-23]. Possible reasons include the nature of chorioretinal atrophy[24] and blood flow retardation[25-26]in highly myopic eyes and the magnification effect[27-28] of OCT imaging. The minimum, inferior and inferotemporal GCIPL thickness in highly myopic eyes were significantly thicker than those of eyes with PPG. In discriminating PPG from highly myopic eyes, minimum GCIPL thickness was the GCIPL parameters with the highest AUROC value, followed by inferotemporal and inferior GCIPL thickness. Average RNFL thickness and RNFL thickness from S3 to S7 had higher AUROC value (all >0.7) than all GCIPL parameters and other RNFL parameters, in which the RNFL thickness of S4 demonstrated the best diagnostic ability among all OCT parameters. The AUROC value of RNFL parameters (average,S4, S6 and S7) were significantly higher than those of minimum and Inferotemporal GCIPL thickness. We presumed that there might be two reasons that RNFL performed better than GCIPL in diagnosing PPG. First, unlike moderate to advanced glaucoma, the structural damages are focal and subtle in PPG. The GCIPL thickness generated by GCA algorithm reflects the RGC population in a 14.13 mm2 elliptical annulus area centered on the fovea, where locates only 50% of the total ganglion cell population in the retina[29]. As a result, any focal RGC damage outside the measurement area cannot be detected by the algorithm. On the contrary, peripapillary RNFL reflects the axons of all ganglion cells of the retina[11]. RNFL provides more comprehensive information of ganglion cell damage compared to GCIPL parameters. Second, according to the definition of PPG in the present study, our diagnostic criteria of PPG were mostly based on the RNFL thickness,making the RNFL thickness both the “golden standard” and one of the parameters being evaluated. Such inherent bias could overstate the diagnostic abilities of RNFL parameters[30].In all six sectional GCIPL parameters, the inferotemporal GCIPL thickness is the best parameter in discriminating PPG from HM. However, in clock-hour peripapillary OCT parameters, S4 is the parameter with the best discriminating power. There was a spatial discrepancy of RNFL and GCIPLdistribution. Due to factors like optic disc tilting and torsion,peripapillary crescent, and optical artifacts, the distribution pattern of the RNFL bundles in highly myopic eyes should be considered when interpreting the RNFL thickness map in these patients. Leung et al[31] showed that the inferotemporal and superotemporal nerve fiber bundles tend to be more temporally oriented in eyes with increasing myopia in RNFL thickness map. Therefore, it was reasonable to assume that the temporal RNFL was more sensitive in revealing even minor glaucoma damages. In this study, the average refraction of the high myopia participants was -8.51±2.09 D, and temporal RNFL thickness (S4 to S6) showed a better discriminating power than RNFL parameters in other sectors. Specifically, the AUROC values of S4 (0.802) and S6 (0.792) were very close to each other and the difference was statistically insignificant.Interestingly, these results were inconsistent to our previous study showing inferior and superior quadrant RNFL thickness had higher diagnostic ability than temporal RNFL thickness in non-myopic eyes[32]. On the other hand, we previously showed that the inferotemporal GCIPL thickness was the best sectoral parameter in discriminating early glaucoma in nonmyopic eyes. Likewise, Takayama et al[7] found the same result in Japanese population, indicating that the ganglion cell inferotemporal to the fovea may have a nature of likelihood of being affected by glaucoma prior to ganglion cells in other sectors. The histological correlation with retinal ganglion cells and retinal nerve fiber in the very early stage of glaucoma needs to be studied in further investigations.
Table 3 AUROC of macular GCIPL and peripapillary RNFL thickness
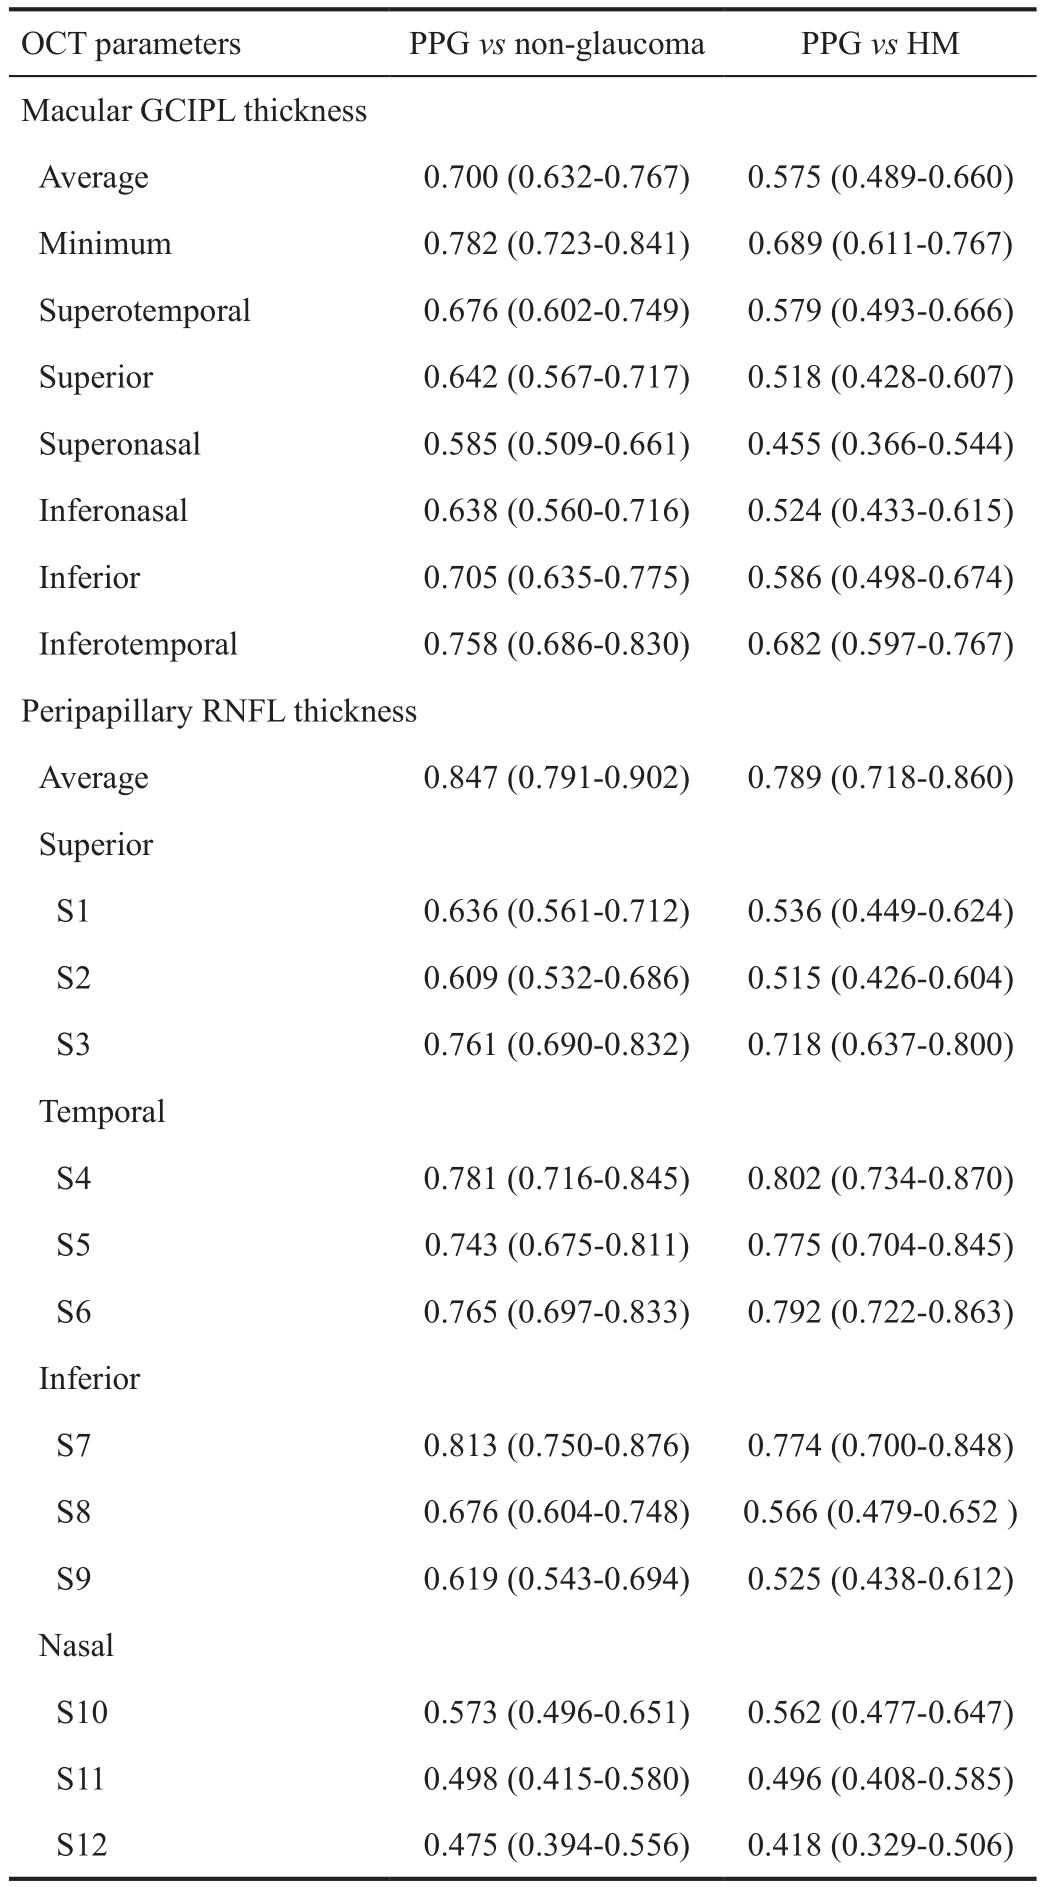
PPG: preperimetric glaucoma; HM: high myopia; GCIPL: Ganglion cell-inner plexiform layer; RNFL: Retinal nerve fiber layer.
OCT parameters PPG vs non-glaucoma PPG vs HM Macular GCIPL thickness Average 0.700 (0.632-0.767) 0.575 (0.489-0.660)Minimum 0.782 (0.723-0.841) 0.689 (0.611-0.767)Superotemporal 0.676 (0.602-0.749) 0.579 (0.493-0.666)Superior 0.642 (0.567-0.717) 0.518 (0.428-0.607)Superonasal 0.585 (0.509-0.661) 0.455 (0.366-0.544)Inferonasal 0.638 (0.560-0.716) 0.524 (0.433-0.615)Inferior 0.705 (0.635-0.775) 0.586 (0.498-0.674)Inferotemporal 0.758 (0.686-0.830) 0.682 (0.597-0.767)Peripapillary RNFL thickness Average 0.847 (0.791-0.902) 0.789 (0.718-0.860)Superior S1 0.636 (0.561-0.712) 0.536 (0.449-0.624)S2 0.609 (0.532-0.686) 0.515 (0.426-0.604)S3 0.761 (0.690-0.832) 0.718 (0.637-0.800)Temporal S4 0.781 (0.716-0.845) 0.802 (0.734-0.870)S5 0.743 (0.675-0.811) 0.775 (0.704-0.845)S6 0.765 (0.697-0.833) 0.792 (0.722-0.863)Inferior S7 0.813 (0.750-0.876) 0.774 (0.700-0.848)S8 0.676 (0.604-0.748) 0.566 (0.479-0.652 )S9 0.619 (0.543-0.694) 0.525 (0.438-0.612)Nasal S10 0.573 (0.496-0.651) 0.562 (0.477-0.647)S11 0.498 (0.415-0.580) 0.496 (0.408-0.585)S12 0.475 (0.394-0.556) 0.418 (0.329-0.506)
Table 4 Comparisons of AUROCs between minimum GCIPL thickness and other OCT parameters

GCIPL: Ganglion cell-inner plexiform layer; PPG: Preperimetric glaucoma; HM: High myopia; RNFL: Retinal nerve fiber layer;
aThe value of the difference of AUROC between minimum GCIPL thickness and other parameters.
Parameters PPG vs non-glaucoma PPG vs HM Differencea P Difference P Average RNFL thickness -0.063 0.003 -0.099 0.014 RNFL thickness of S4 0.001 0.953 -0.112 0.020 RNFL thickness of S6 0.018 0.676 -0.102 0.041 RNFL thickness of S7 -0.030 0.358 -0.084 0.046 Inferotemporal GCIPL thickness 0.026 0.426 0.0089 0.823
Our results were somewhat different from the previous work reported by Seol et al[15], the reason for which would be the differences in study design and subject selection. The hospital-based case-control design of the previous publication enrolled highly myopic PPG as “case” and refractive dioptermatched highly myopic healthy eyes as “control”. However,the purpose of a diagnostic test is to discover a disease in subjects suspected of having it, but not in subjects without any suspicious signs of the disease. PPG and high myopia can both manifest RNFL thinning and changes in ONH morphology,causing difficulty and confusion in identifying each other in clinical practice. Therefore, high myopia could be regarded as one of the forms of glaucoma suspects. If the estimate of the diagnostic performance is extrapolated to the population including glaucoma suspects, such bias is likely to exist.Unlike the previous study which investigated the diagnostic ability of OCT parameters in differentiating highly myopic PPG from highly myopic healthy eyes, our study explored the ability of those parameters in diagnosing non-highly myopic PPG from highly myopic healthy eyes, trying to minimize the effect of overestimating the diagnostic performance of the evaluated parameters. Besides, the diagnostic criteria of PPG in the previous publication failed to clearly identify which kind of localized RNFL defect was glaucomatous but not caused by high myopia. It is important to note that the internal normative database of Cirrus HD-OCT does not include any highly myopic subjects. Therefore, the RNFL defect indicated by OCT might be relevant to high myopia, but not PPG itself. To the best of our knowledge, there are no universally accepted identification criteria for glaucomatous RNFL defect of PPG with high myopia. In case of recruiting highly myopic PPG without clear diagnosis, our study was designed to employ the eyes with non-highly myopic PPG as case, and highly myopic eyes as control.
Despite of good diagnostic accuracy of individual OCT parameters in a static evaluation pattern, clinicians cannot easily determine which parameters are the most efficient in different clinical dilemma. For instance, in some situation ONH parameters may appear to be the most sensitive when in another situation RNFL thickness turns the most sensitive parameters. Moreover, the large quantity of parameters can be problematic, because most of them are highly correlated to each other and have reduplicative information[33]. Mwanza et al[34] have developed a multivariable model using a combination of OCT parameters and confirmed that the model was able to successfully predict glaucoma with early visual field loss whose performance outperformed individual OCT parameters. Such combination model could reduce the number of parameters lack of clinical significance and introduce indicators loading sufficient information for effective clinical decisions.
There were several limitations of our study. First, the PPG patients were significantly older than normal control and highly myopic subjects. Age-adjusted AUROCs were used for the diagnostic ability evaluation of spectral-domain optical coherence tomography (SD-OCT) parameters. In a cohort of our unpublished data, we found that the all eight GCIPL thickness parameters in healthy volunteers had no significant difference between the age groups of 20 to 29y, 30 to 39y, 40 to 50y, and even 50 to 59y (all P<0.001). Based on these findings,we assumed that the difference in age between groups at the baseline would put minimal in fluence on our final conclusions.Second, the sample size was not large enough and unbalanced between HM and PPG group. Large cohort investigations will be required in the future for more convincing results.Third, this was a retrospective study without follow-up data,so the potential of highly myopic eyes being develop into real glaucoma could not be excluded. Last, the retrospective study design and the lack of golden standard to diagnose PPG with HM may miss “real” PPG in the HM group, especially if the glaucoma is in the earliest stage when the IOP is not always over 21 mm Hg and no ONH morphology change is found.This situation may result in bias and underestimation of the diagnostic performances of the GCIPL parameters. More sensitive indicators are expected to be introduced for more precise investigations.
A strength of this study is the introduction of non-highly myopic PPG as case and high myopia as control in determining the glaucoma diagnostic ability of OCT parameters, as discriminating non-highly myopic PPG instead of highly myopic PPG from high myopia is more confusing in clinical practice. In summary, although the minimum GCIPL thickness was the best GCIPL parameter to discriminate non-highly myopic PPG from highly myopic eyes, its diagnostic ability was not as good as that of average RNFL thickness and RNFL thickness of several temporal and inferotemporal clockhour sectors (S4, S6 and S7). Based on the current study, the average RNFL thickness is recommended for discriminating PPG from highly myopic healthy eyes. However, as one of the most challenging and confusing situations in clinical practice,new algorithms and platforms that combine information conveyed by each individual parameter may be more helpful and clinically valuable for identifying early glaucoma from high myopia.
ACKNOWLEDGEMENTS
Foundations: Supported by National Natural Science Foundation of China (No.81800879); Natural Science Foundation of Guangdong Province (No.2017A030310372);Fundamental Research Funds of the State Key Laboratory of Ophthalmology, China (No.2017QN05); Sun Yat-sen University Clinical Research 5010 Program (No.2014016).
Confiicts of Interest: Xu XY, None; Xiao H, None; Luo JY,None; Liu X, None.
REFERENCES
1 Holden BA, Fricke TR, Wilson DA, Jong M, Naidoo KS, Sankaridurg P, Wong TY, Naduvilath TJ, Resnikoff S. Global prevalence of myopia and high myopia and temporal trends from 2000 through 2050.Ophthalmology 2016;123(5):1036-1042.
2 Hsu CH, Chen RI, Lin SC. Myopia and glaucoma. Curr Opin Ophthalmol 2015;26(2):90-95.
3 Ma F, Dai JH, Sun XH. Progress in understanding the association between high myopia and primary open-angle glaucoma. Clin Exp Ophthalmol 2014;42(2):190-197.
4 Kerrigan-Baumrind LA, Quigley HA, Pease ME, Kerrigan DF,Mitchell RS. Number of ganglion cells in glaucoma eyes compared with threshold visual field tests in the same persons. Invest Ophthalmol Vis Sci 2000;41(3):741-748.
5 Xu XY, Xiao H, Guo XX, Chen XX, Hao LL, Luo JY, Liu X. Diagnostic ability of macular ganglion cell-inner plexiform layer thickness in glaucoma suspects. Medicine 2017;96(51):e9182.
6 Mwanza JC, Durbin MK, Budenz DL, Sayyad FE, Chang RT,Neelakantan A, Godfrey DG, Carter R, Crandall AS. Glaucoma diagnostic accuracy of ganglion cell-inner plexiform layer thickness:comparison with nerve fiber layer and optic nerve head. Ophthalmology 2012;119(6):1151-1158.
7 Takayama K, Hangai M, Durbin M, Nakano N, Morooka S, Akagi T,Ikeda HO, Yoshimura N. A novel method to detect local ganglion cell loss in early glaucoma using spectral-domain optical coherence tomography.Invest Ophthalmol Vis Sci 2012;53(11):6904-6913.
8 Kim MJ, Park KH, Yoo BW, Jeoung JW, Kim HC, Kim DM.Comparison of macular GCIPL and peripapillary RNFL deviation maps for detection of glaucomatous eye with localized RNFL defect. Acta Ophthalmol 2015;93(1):e22-e28.
9 Hwang YH, Ahn SI, Ko SJ. Diagnostic ability of macular ganglion cell asymmetry for glaucoma. Clin Exp Ophthalmol 2015;43(8):720-726.
10 Choi YJ, Jeoung JW, Park KH, Kim DM. Glaucoma detection ability of ganglion cell-inner plexiform layer thickness by spectral-domain optical coherence tomography in high myopia. Invest Ophthalmol Vis Sci 2013;54(3):2296-2304.
11 Begum VU, Addepalli UK, Yadav RK, Shankar K, Senthil S, Garudadri CS, Rao HL. Ganglion cell-inner plexiform layer thickness of high definition optical coherence tomography in perimetric and preperimetric glaucoma. Invest Ophthalmol Vis Sci 2014;55(8):4768-4775.
12 Aydogan T, Akçay BS, Kardeş E, Ergin A. Evaluation of spectral domain optical coherence tomography parameters in ocular hypertension, preperimetric, and early glaucoma. Indian J Ophthalmol 2017;65(11):1143-1150.
13 Kim YJ, Kang MH, Cho HY, Lim HW, Seong M. Comparative study of macular ganglion cell complex thickness measured by spectraldomain optical coherence tomography in healthy eyes, eyes with preperimetric glaucoma, and eyes with early glaucoma. Jpn J Ophthalmol 2014;58(3):244-251.
14 Sung MS, Yoon JH, Park SW. Diagnostic validity of macular ganglion cell-inner plexiform layer thickness deviation map algorithm using cirrus HD-OCT in preperimetric and early glaucoma. J Glaucoma 2014;23(8):e144-e151.
15 Seol BR, Jeoung JW, Park KH. Glaucoma detection ability of macular ganglion cell-inner plexiform layer thickness in myopic preperimetric glaucoma. Invest Ophthalmol Vis Sci 2015;56(13):8306-8313.
16 Choi JA, Shin HY, Park HL, Park CK. The pattern of retinal nerve fiber layer and macular ganglion cell-inner plexiform layer thickness changes in glaucoma. J Ophthalmol 2017;2017:6078365.
17 Mwanza JC, Durbin MK, Budenz DL, Girkin CA, Leung CK,Liebmann JM, Peace JH, Werner JS, Wollstein G. Profile and predictors of normal ganglion Cell-Inner plexiform layer thickness measured with frequency-domain optical coherence tomography. Invest Ophthalmol Vis Sci 2011;52(11):7872-7879.
18 Pepe M, Longton G, Janes H. Estimation and comparison of receiver operating characteristic curves. Stata J 2009;9(1):1.
19 Alonzo TA. Distribution-free ROC analysis using binary regression techniques. Biostatistics 2002;3(3):421-432.
20 Delong ER, Delong DM, Clarke-Pearson DL. Comparing the areas under two or more correlated receiver operating characteristic curves: a nonparametric approach. Biometrics 1988;44(3):837.
21 Wakitani Y, Sasoh M, Sugimoto M, Ito Y, Ido M, Uji Y. Macular thickness measurements in healthy subjects with different axial lengths using optical coherence tomography. Retina 2003;23(2):177-182.
22 Seo S, Lee CE, Jeong JH, Park KH, Kim DM, Jeoung JW. Ganglion cell-inner plexiform layer and retinal nerve fiber layer thickness according to myopia and optic disc area: a quantitative and three-dimensional analysis. BMC Ophthalmology 2017;17:22.
23 Zhao ZN, Jiang CH. Effect of myopia on ganglion cell complex and peripapillary retinal nerve fibre layer measurements: a Fourier-domain optical coherence tomography study of young Chinese persons. Clin Exp Ophthalmol 2013;41(6):561-566.
24 Guo XX, Xiao O, Chen YX, Wu HW, Chen LX, Morgan IG, He MG.Three-dimensional eye shape, myopic maculopathy, and visual acuity: the Zhongshan ophthalmic Center-Brien holden vision institute high myopia cohort study. Ophthalmology 2017;124(5):679-687.
25 Li M, Yang Y, Jiang H, Gregori G, Roisman L, Zheng F, Ke BL,Qu DY, Wang JH. Retinal microvascular network and microcirculation assessments in high myopia. Am J Ophthalmol 2017;174:56-67.
26 Yang YS, Koh JW. Choroidal blood flow change in eyes with high myopia. Korean J Ophthalmol 2015;29(5):309-314.
27 Parthasarathy MK, Bhende M. Effect of ocular magnification on macular measurements made using spectral domain optical coherence tomography. Indian J Ophthalmol 2015;63(5):427-431.
28 Akhtar N, Kausar A, Afzal F, Khalid Ali S, Hamid N. Peripapillary retinal nerve fiber layer (RNFL) thickness measurements by topcon SDOCT in myopic patients. JCPSP 2018;28(1):26-30.
29 Agudo-Barriuso M, Villegas-Pérez M, de Imperial JM, Vidal-Sanz M.Anatomical and functional damage in experimental glaucoma. Curr Opin Pharmacol 2013;13(1):5-11.
30 Garway-Heath DF, Hitchings RA. Sources of bias in studies of optic disc and retinal nerve fibre layer morphology. Br J Ophthalmol 1998;82(9):986-986.
31 Leung CKS, Yu M, Weinreb RN, Mak HK, Lai G, Ye C, Lam DSC.Retinal nerve fiber layer imaging with spectral-domain optical coherence tomography: interpreting the RNFL maps in healthy myopic eyes. Invest Ophthalmol Vis Sci 2012;53(11):7194-7200.
32 Xu XY, Xiao H, Guo XX, Chen XX, Hao LL, Luo JY, Liu X.Diagnostic ability of macular ganglion cell-inner plexiform layer thickness in glaucoma suspects. Medicine 2017;96(51):e9182.
33 Mwanza JC, Budenz DL. Optical coherence tomography platforms and parameters for glaucoma diagnosis and progression. Curr Opin Ophthalmol 2016;27(2):102-110.
34 Mwanza JC, Warren JL, Budenz DL. Combining spectral domain optical coherence tomography structural parameters for the diagnosis of glaucoma with early visual field loss. Invest Opthalmol Vis Sci 2013;54(13):8393-8400.
Citation: Xu XY, Xiao H, Luo JY, Liu X. Evaluation of spectral domain optical coherence tomography parameters in discriminating preperimetric glaucoma from high myopia. Int J Ophthalmol 2019;12(1):58-65
DOl:10.18240/ijo.2019.01.09
● KEYWORDS: ganglion cell-inner plexiform layer; diagnostic ability; preperimetric glaucoma; high myopia.
Received: 2018-03-28 Accepted: 2018-09-11to that of average RNFL thickness and RNFL thickness of several temporal and inferotemporal clock-hour sectors. The average RNFL thickness is recommended for discriminating PPG from highly myopic healthy eyes in current clinical practice in a Chinese population.
Correspondence to: Xing Liu. State Key Laboratory of Ophthalmology, Zhongshan Ophthalmic Center, Sun Yatsen University, 54 South Xianlie Road, Yuexiu District,Guangzhou 510060, Guangdong Province, China. liuxing@mail.sysu.edu.cn