The association between socioeconomic status and visual disability among older adults in China
Wan-Wei Dai1,2, Jia-Min Gao1,3, Ping He1,4, Zheng Ma1, Xiao-Xiao Tian1, Xiao-Ying Zheng1
1Institute of Population Research, APEC Health Science Academy (HeSAY), Peking University, Beijing 100891, China
2The Third Hospital, Peking University, Beijing 100191, China
3Guanghua School of Management, Institute of Strategic Research, Peking University, Beijing 100891, China
4China Center for Health Development Studies, Peking University, Beijing 100891, China
Abstract● AlM: To investigate the association between socioeconomic status (SES) and visual disability (VD) among older Chinese adults.● METHODS: We obtained data from the Second National Sample Survey on Disability, conducted in China in 2006.A total number of 192 375 older adults (aged≥65y) were screened for suspected VD via interviews with trained examiners. Those who screened positively for VD were referred to ophthalmologists to obtain a final diagnosis.● RESULTS: VD was prevalent among 7.29% of Chinese adults aged 65 and older, and was higher in rural areas(8.71%) than in urban areas (4.82%). After adjusting for SES indicators and covariates, we found that lesseducated older adults were more likely to suffer from VD, with an odds ratio (OR) of 2.50 (95%Cl: 2.26-2.82) for illiterates, compared with those who graduated from senior high school or above. Older adults who were in the lowest income quintile were more at risk of VD, with an OR of 1.81(95%Cl: 1.68-2.95), compared with adults in the highest income quintile. ln urban areas, when compared with adults who graduated from senior high school or above,those who did not continue their education after junior high school, primary school, or those who were illiterate,were more likely to suffer from VD, with an OR of 1.35(95%Cl: 1.51-1.59), 1.84 (95%Cl: 1.60-2.12), and 2.63 (95%Cl:2.27-3.04), respectively. Lower levels of income were statistically significant when associated with VD. ln rural areas, adults who were illiterate had an OR of 2.21 (95%Cl:1.75-2.79) when compared to adults with senior high school or above education level. Per capita, household income remained significantly associated with VD. Older adults who were ≥85, female, single, and residing in rural areas were associated with higher risks of VD.● CONCLUSlON: lndividual-level SES among the elderly,in the form of education and income, is associated with VD among elderly Chinese adults in both urban and rural areas; however, the association is stronger in rural areas.Further studies are still required to explore the mechanism behind the relationships.
INTRODUCTION
Visual disability (VD), which is defined as blindness or visual impairment, is the third leading cause of impairment after anemia and hearing loss[1]. The World Health Organization (WHO) defines blindness as having a best corrected visual acuity (BCVA) level of ≤20/400 in the better eye and defines visual impairment as having a BCVA level of <20/60 in the better eye. Disorders of the sensory organs(vision loss and hearing loss) are the top-ranked cause of disability in older adults (those older than 65y)[1]. VD has become an increasingly important public-health issue. Blindness and visual impairment negatively impact on both physical and mental health. Individuals who are visually impaired or blind have a higher risk of accidents[2], depression[3], social withdrawal, and mortality[4-5]. Vision loss, like cancer, is one of mankind’s most fearful diseases[6].
It is estimated that 36 million people worldwide were blind and an additional 216.6 million people had moderate to severe visual impairment[7]. In 2004, the WHO estimated that vision loss was responsible for 3.9% of the total global burden of disease, measured as disability-adjusted life years, even higher than that of coronary heart disease, which is the leading cause of death worldwide[8]. China has the largest number of people with VD in the world, and this number is increasing rapidly.According to of ficial estimates from the Chinese government in 2010, the total number of people with VD was 20.03 million,and new annual cases numbered 450 000[9-10]. Older adults account for the majority of the visually impaired population in China; this is due to demographic transitions and population aging. Lower socioeconomic status (SES), including area-level SES and individual-level SES, has been recognized as a crucial determinant of health, especially visual health. However,area-level SES and individual-level SES are closely linked and may affect visual health in different ways[11]. Although studies have been conducted on the relationship between SES and visual health, most, such as the Singapore Epidemiology of Eye Diseases study and the UK Biobank study, have been carried out in developed countries[12-13]. Literature that focuses on the association between SES and VD among older adults on an individual level in middle- and low-income countries is extremely limited, especially in China[14-15]. The current study uses data from the Second National Sample Survey on Disability (2nd CSSD), the most nationally representative survey of people with disabilities so far, ongoing to investigate the relationship between SES and VD in Chinese adults ≥65.This study fills in gaps within this field related to China and contributes to global literature on low- and middle-income countries.
SUBJECTS AND METHODS
Ethical Approval The survey was approved by the State Council of China (No.20051104) and conducted according to legal guidelines governed by the Statistical Law of the People’s Republic of China (1996 Amendment). Visualfunction tests and assessments of VD were performed by capable ophthalmologists (≥5y of clinical experience) after they obtained informed consent from each individual.
Data Source and Study of Population We utilized data collected as part of the 2nd CSSD, which was conducted from April 1, 2006 to May 31, 2006. This survey was designed to estimate the population-based prevalence, cause, and severity of disability; to examine SES as it relates to disability; and to document the functional conditions and health-service needs of adults with disabilities. A multistage, stratified, random cluster,and probability proportional to size sampling method was used to obtain a representative sample of the non-institutionalized populations in all province-level administrative regions of mainland China. Over 6000 doctors, 20 000 interviewers, and 50 000 survey assistants participated in this survey. Prior to the survey, a total of 2 526 145 residents from 5964 communities in 734 counties were selected. Information about the number of households, population numbers, and suspected numbers of disabled people in the sampling community was collected to ensure the survey was completed on time. Residents with potential disabilities were later examined by trained ophthalmologists. The response rate of the survey was 83.5%.The results of the survey were evaluated as valid and reliable and have been used as scientific evidence for policymaking by national and local governments in China. Details of the survey protocol and implementation have been described in previous studies[16-17]. In this study, we restricted our analysis to 192 375 adults aged 65 or older.
Vision Assessment Vision evaluation was based on the established protocol of the 2nd CSSD. The vision evaluation consisted of two steps. First, interviewers used Snellen charts and visualfield cards to survey households and identify individuals with suspected VD. Second, individuals suspected of having VD were referred to an ophthalmologist for further diagnosis. The procedure for diagnosing VD included a survey of medical history, visual-function tests, and an etiological diagnosis. According to the classification criteria for blindness and visual impairment proposed by the WHO,patients with a BCVA of ≤0.3 were diagnosed with VD.Etiological diagnoses were based on medical history, general ophthalmologic examinations, slit-lamp microscopies,and ophthalmoscopies. When individuals were unable to tolerate a physical examination (due to psychotic disorders,intellectual impairment, etc.), ophthalmologists would make comprehensive judgement[18].
Measures The outcome variable was to establish whether an older adult had a VD. The independent variable was individual-level SES, defined by two categorical variables:education (illiterate, primary school, junior high school, or senior high school) and income (quintiles of annual family income per capita). The majority of Chinese adults retire at age 60, therefore, occupation was not considered as an SES measure in this study. Covariates included age (65-74, 75-84,85 or older), sex (man or woman), marital status (married,single, divorced, or widowed) and residence (urban or rural).Residence is an area-level SES variable. The independent variables and covariates were all self-reported.
Analytic Approach Logistic regression models were used to estimate multivariate associations between VD and indicators of SES, and odds ratios (ORs) with 95% confidence intervals(CIs) are presented. Studies have shown that indicators of SES are correlated but interchangeable[19]. Thus, we controlled for each indicator of SES and the related covariates in order to obtain the net effect of each indicator. We reported the final model with adjusted ORs of SES on VD; P<0.05 was considered statistically significant. Stata Version 13.0 for Windows (Stata, College Station, TX, USA) was used for the statistical analyses. All analyses were run separately for urban and rural areas.
Table 1 Characteristics of older adults, aged 65y and above, in urban and rural areas n (%)
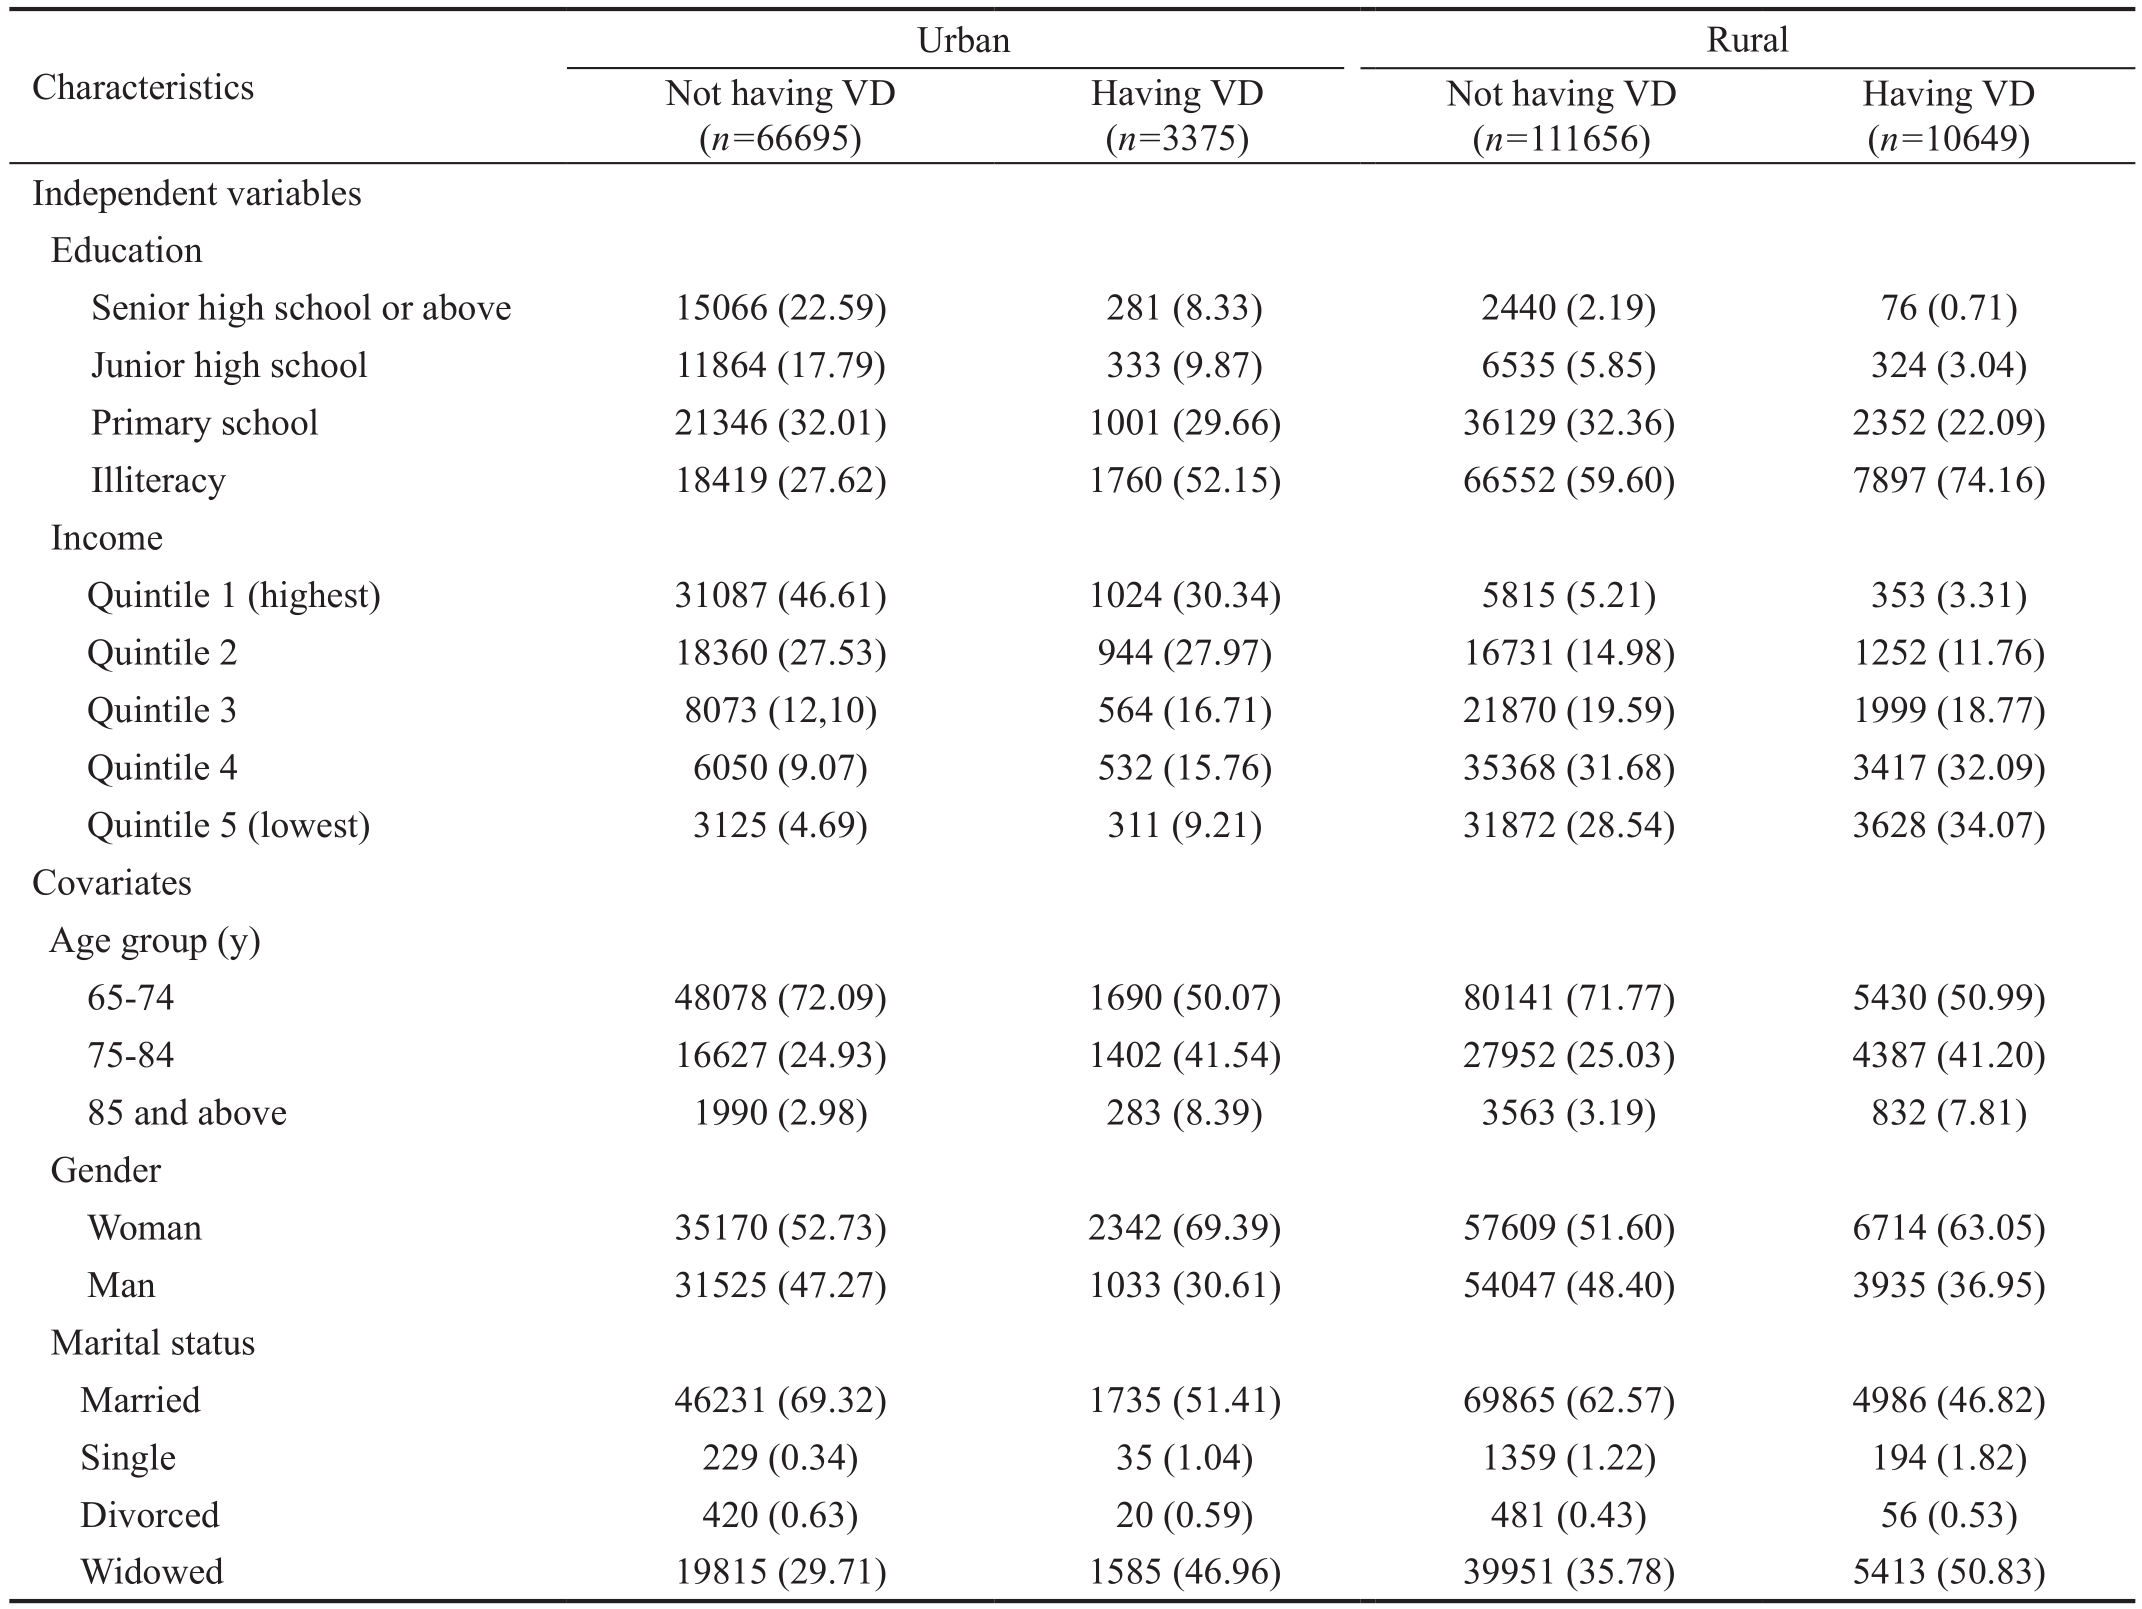
VD: Visual disability.
Having VD(n=10649)Independent variables Education Senior high school or above 15066 (22.59) 281 (8.33) 2440 (2.19) 76 (0.71)Junior high school 11864 (17.79) 333 (9.87) 6535 (5.85) 324 (3.04)Primary school 21346 (32.01) 1001 (29.66) 36129 (32.36) 2352 (22.09)Illiteracy 18419 (27.62) 1760 (52.15) 66552 (59.60) 7897 (74.16)Income Quintile 1 (highest) 31087 (46.61) 1024 (30.34) 5815 (5.21) 353 (3.31)Quintile 2 18360 (27.53) 944 (27.97) 16731 (14.98) 1252 (11.76)Quintile 3 8073 (12,10) 564 (16.71) 21870 (19.59) 1999 (18.77)Quintile 4 6050 (9.07) 532 (15.76) 35368 (31.68) 3417 (32.09)Quintile 5 (lowest) 3125 (4.69) 311 (9.21) 31872 (28.54) 3628 (34.07)Covariates Age group (y)65-74 48078 (72.09) 1690 (50.07) 80141 (71.77) 5430 (50.99)75-84 16627 (24.93) 1402 (41.54) 27952 (25.03) 4387 (41.20)85 and above 1990 (2.98) 283 (8.39) 3563 (3.19) 832 (7.81)Gender Woman 35170 (52.73) 2342 (69.39) 57609 (51.60) 6714 (63.05)Man 31525 (47.27) 1033 (30.61) 54047 (48.40) 3935 (36.95)Marital status Married 46231 (69.32) 1735 (51.41) 69865 (62.57) 4986 (46.82)Single 229 (0.34) 35 (1.04) 1359 (1.22) 194 (1.82)Divorced 420 (0.63) 20 (0.59) 481 (0.43) 56 (0.53)Widowed 19815 (29.71) 1585 (46.96) 39951 (35.78) 5413 (50.83)Characteristics Urban Rural Not having VD(n=66695)Having VD(n=3375)Not having VD(n=111656)
RESULTS
Table 1 shows the characteristics of the urban and rural samples. In urban areas, of individuals aged 65 or older with a VD, 52.15% were illiterate, 30.34% were in the highest income quintile, 50.07% were aged 65-74y, 69.39% were woman, and 51.41% were married. In rural areas, of individuals aged 65 or older with a VD, 74.16% were illiterate, 34.07% were in the lowest income quintile, 50.99% were aged 65-74y, 63.05%were woman, and 50.83% were widowed. It is notable that older adults living in households of a higher SES in urban areas had a higher percentage of VD than those living in poorer households, but the situation was reversed in rural areas: the lower the SES status, the higher the percentage of VD.
Table 2 presents the prevalence of VD in adults aged 65 or older in urban and rural areas. The prevalence of VD among all older adults studied was 7.29%, with 8.71% and 4.82% in rural and urban areas, respectively, with statistical difference. The prevalence of VD among older adults increased among those with lower levels of education and lower household income per capita. Those who were 85 and above, female, and single had a higher prevalence than others. In both urban and rural areas,the prevalence of VD increased with decreasing education levels and lower quintiles of annual family income per capita.VD prevalence also increased with age (prevalence: 12.45%and 18.93% for those aged 85y and above, respectively). In both urban and rural areas, females and those who were single or widowed had a higher prevalence of VD.
Table 3 presents the results of the logistic regression analyses conducted on the association between SES and VD among older Chinese adults. In Model 1, which only contains SES variables, education levels and annual family income per capita were statistically significant when associated with VD.In Models 2 and 3, which are adjusted for age, gender, and marital status, the association between education, income, and VD remained significant. In particular, compared to married adults, the older, single adults were more likely to have VD.In Model 4, after adjusting for age, gender, marital status, and residence, the association between education, income, and VD remained significant, but the magnitude of the association decreased.
Tables 4 and 5 present the degree of association between SES and VD among the elderly in both urban and rural areas. The
results show that the association between SES and VD remains strong, even in residence subgroups. It is of interest that the OR of the lowest individual SES is higher in urban areas than in rural areas (e.g. adults who are illiterate compared to those educated to senior-high-school level and adults with the lowest household income per capita compared to the highest).Illiterate older adults living in urban areas had a greater likelihood of contracting a VD than those who graduated from senior high school, with an OR of 2.63 (95%CI: 2.27-3.04),while in rural areas, the OR is 2.21 (95%CI: 1.75-2.79).
Table 2 Prevalence with 95% confidence intervals of VD in older adults aged 65y and above
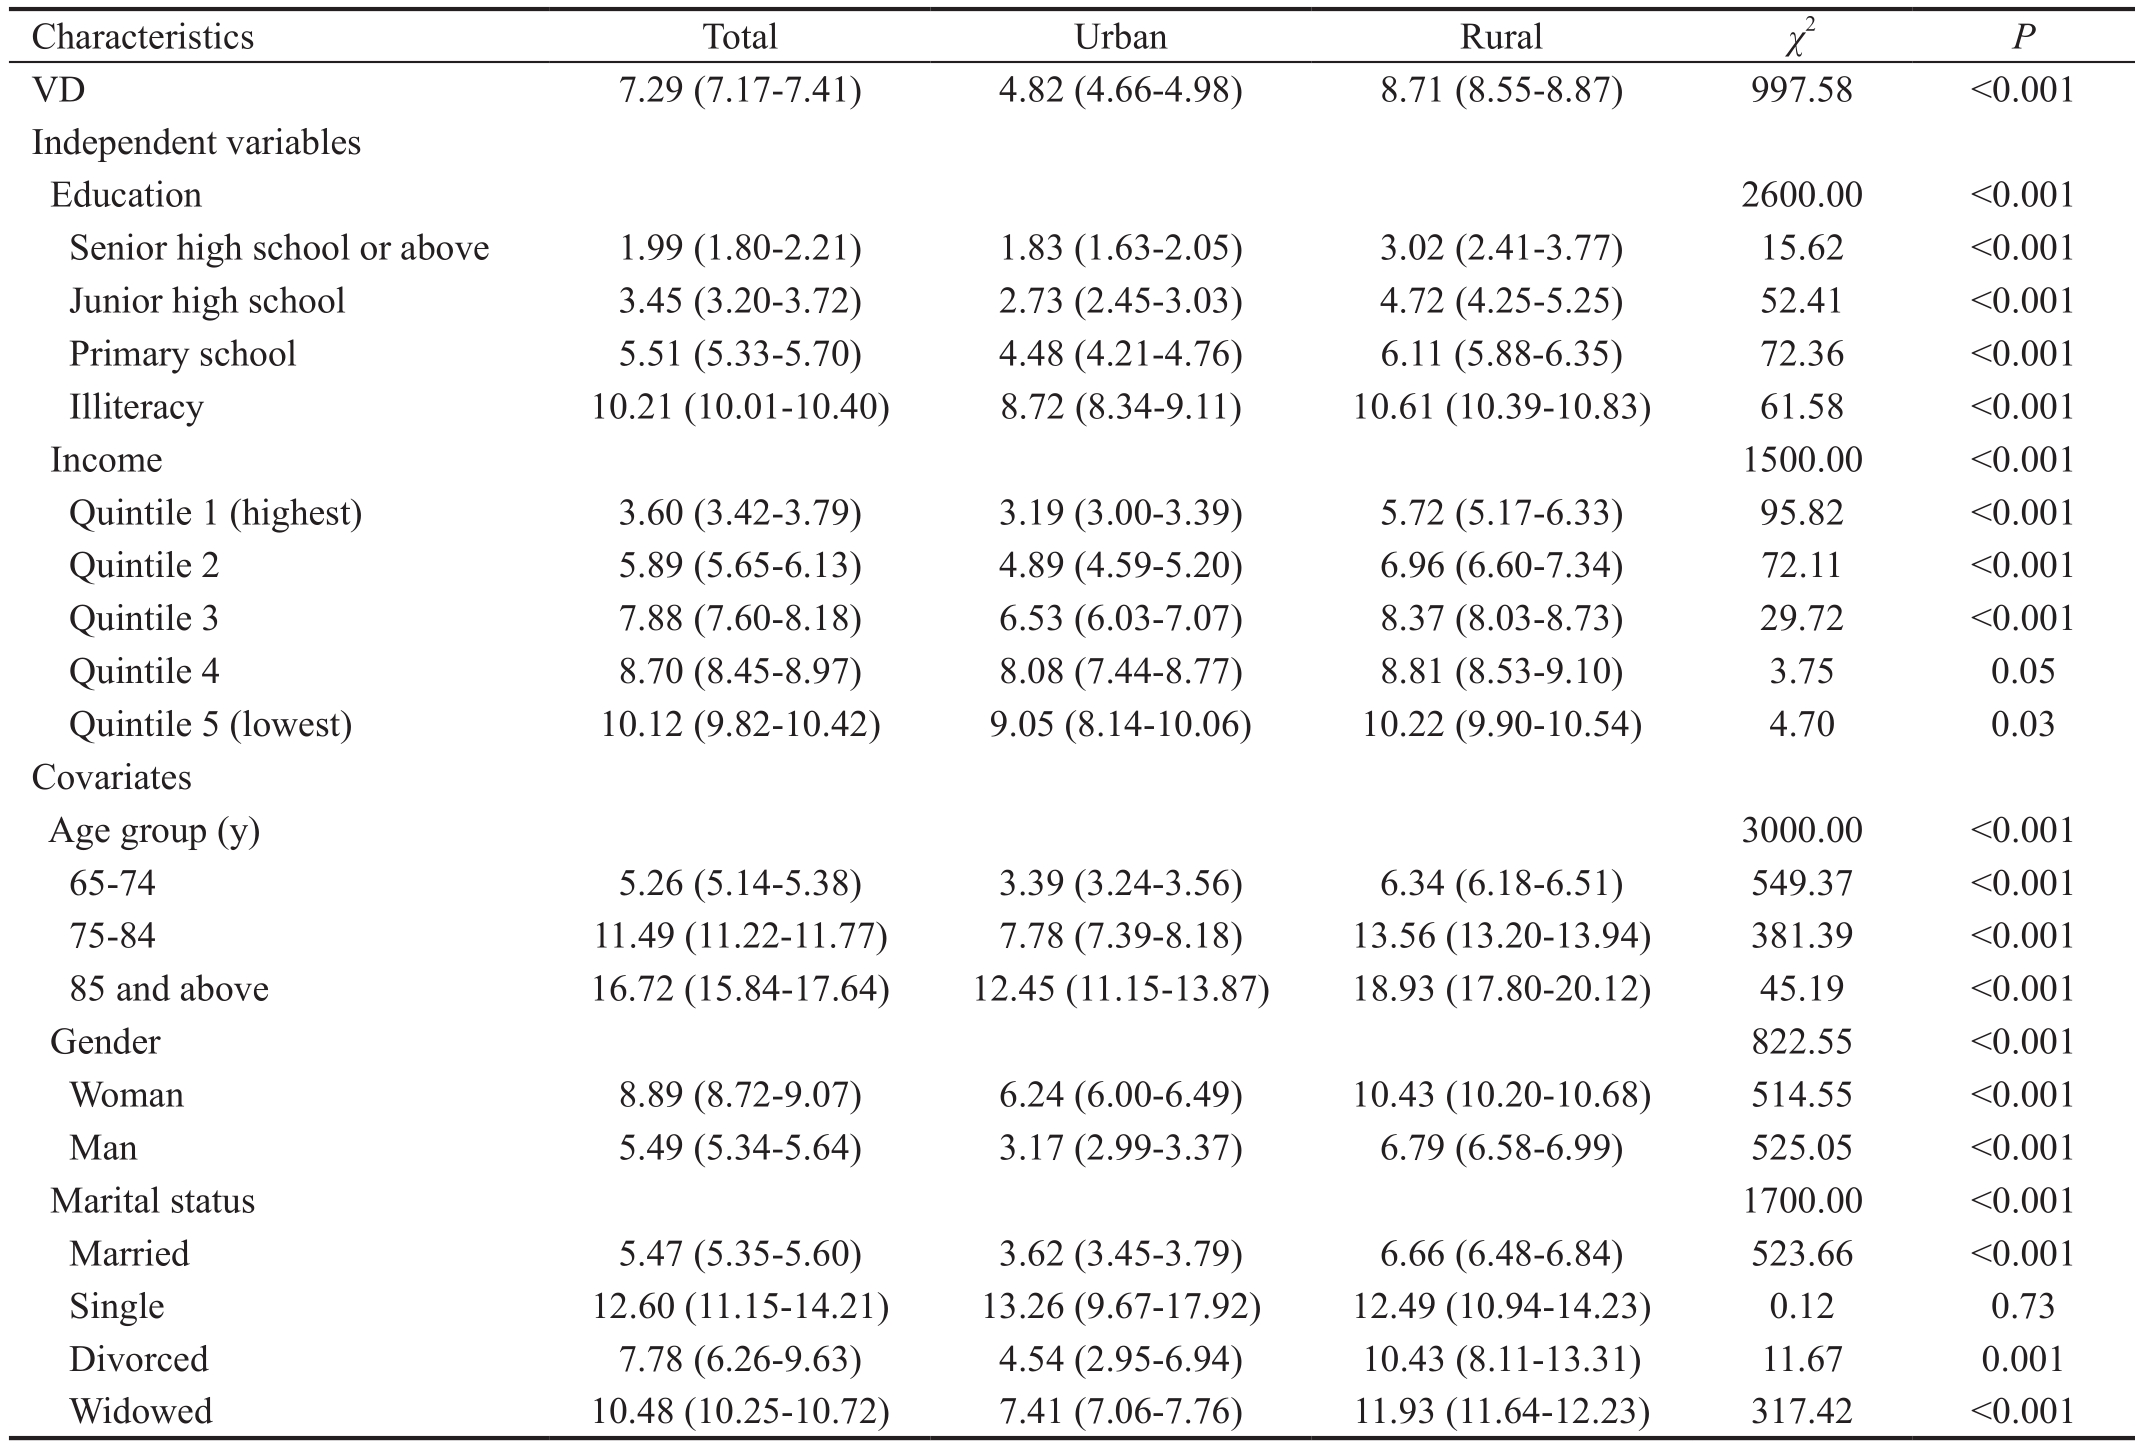
VD: Visual disability. The Wald χ2 test was used to determine the prevalence of VD within demographic and SES variables. In each category of
independent variables, the prevalence of VD within areas of residence (urban and rural) was also tested by the Wald χ2 test.
Characteristics Total Urban Rural χ2 P VD 7.29 (7.17-7.41) 4.82 (4.66-4.98) 8.71 (8.55-8.87) 997.58 <0.001 Independent variables Education 2600.00 <0.001 Senior high school or above 1.99 (1.80-2.21) 1.83 (1.63-2.05) 3.02 (2.41-3.77) 15.62 <0.001 Junior high school 3.45 (3.20-3.72) 2.73 (2.45-3.03) 4.72 (4.25-5.25) 52.41 <0.001 Primary school 5.51 (5.33-5.70) 4.48 (4.21-4.76) 6.11 (5.88-6.35) 72.36 <0.001 Illiteracy 10.21 (10.01-10.40) 8.72 (8.34-9.11) 10.61 (10.39-10.83) 61.58 <0.001 Income 1500.00 <0.001 Quintile 1 (highest) 3.60 (3.42-3.79) 3.19 (3.00-3.39) 5.72 (5.17-6.33) 95.82 <0.001 Quintile 2 5.89 (5.65-6.13) 4.89 (4.59-5.20) 6.96 (6.60-7.34) 72.11 <0.001 Quintile 3 7.88 (7.60-8.18) 6.53 (6.03-7.07) 8.37 (8.03-8.73) 29.72 <0.001 Quintile 4 8.70 (8.45-8.97) 8.08 (7.44-8.77) 8.81 (8.53-9.10) 3.75 0.05 Quintile 5 (lowest) 10.12 (9.82-10.42) 9.05 (8.14-10.06) 10.22 (9.90-10.54) 4.70 0.03 Covariates Age group (y)3000.00 <0.001 65-74 5.26 (5.14-5.38) 3.39 (3.24-3.56) 6.34 (6.18-6.51) 549.37 <0.001 75-84 11.49 (11.22-11.77) 7.78 (7.39-8.18) 13.56 (13.20-13.94) 381.39 <0.001 85 and above 16.72 (15.84-17.64) 12.45 (11.15-13.87) 18.93 (17.80-20.12) 45.19 <0.001 Gender 822.55 <0.001 Woman 8.89 (8.72-9.07) 6.24 (6.00-6.49) 10.43 (10.20-10.68) 514.55 <0.001 Man 5.49 (5.34-5.64) 3.17 (2.99-3.37) 6.79 (6.58-6.99) 525.05 <0.001 Marital status 1700.00 <0.001 Married 5.47 (5.35-5.60) 3.62 (3.45-3.79) 6.66 (6.48-6.84) 523.66 <0.001 Single 12.60 (11.15-14.21) 13.26 (9.67-17.92) 12.49 (10.94-14.23) 0.12 0.73 Divorced 7.78 (6.26-9.63) 4.54 (2.95-6.94) 10.43 (8.11-13.31) 11.67 0.001 Widowed 10.48 (10.25-10.72) 7.41 (7.06-7.76) 11.93 (11.64-12.23) 317.42 <0.001
Table 3 OR with 95%CI on the association between SES and VD in older adults aged 65y and above
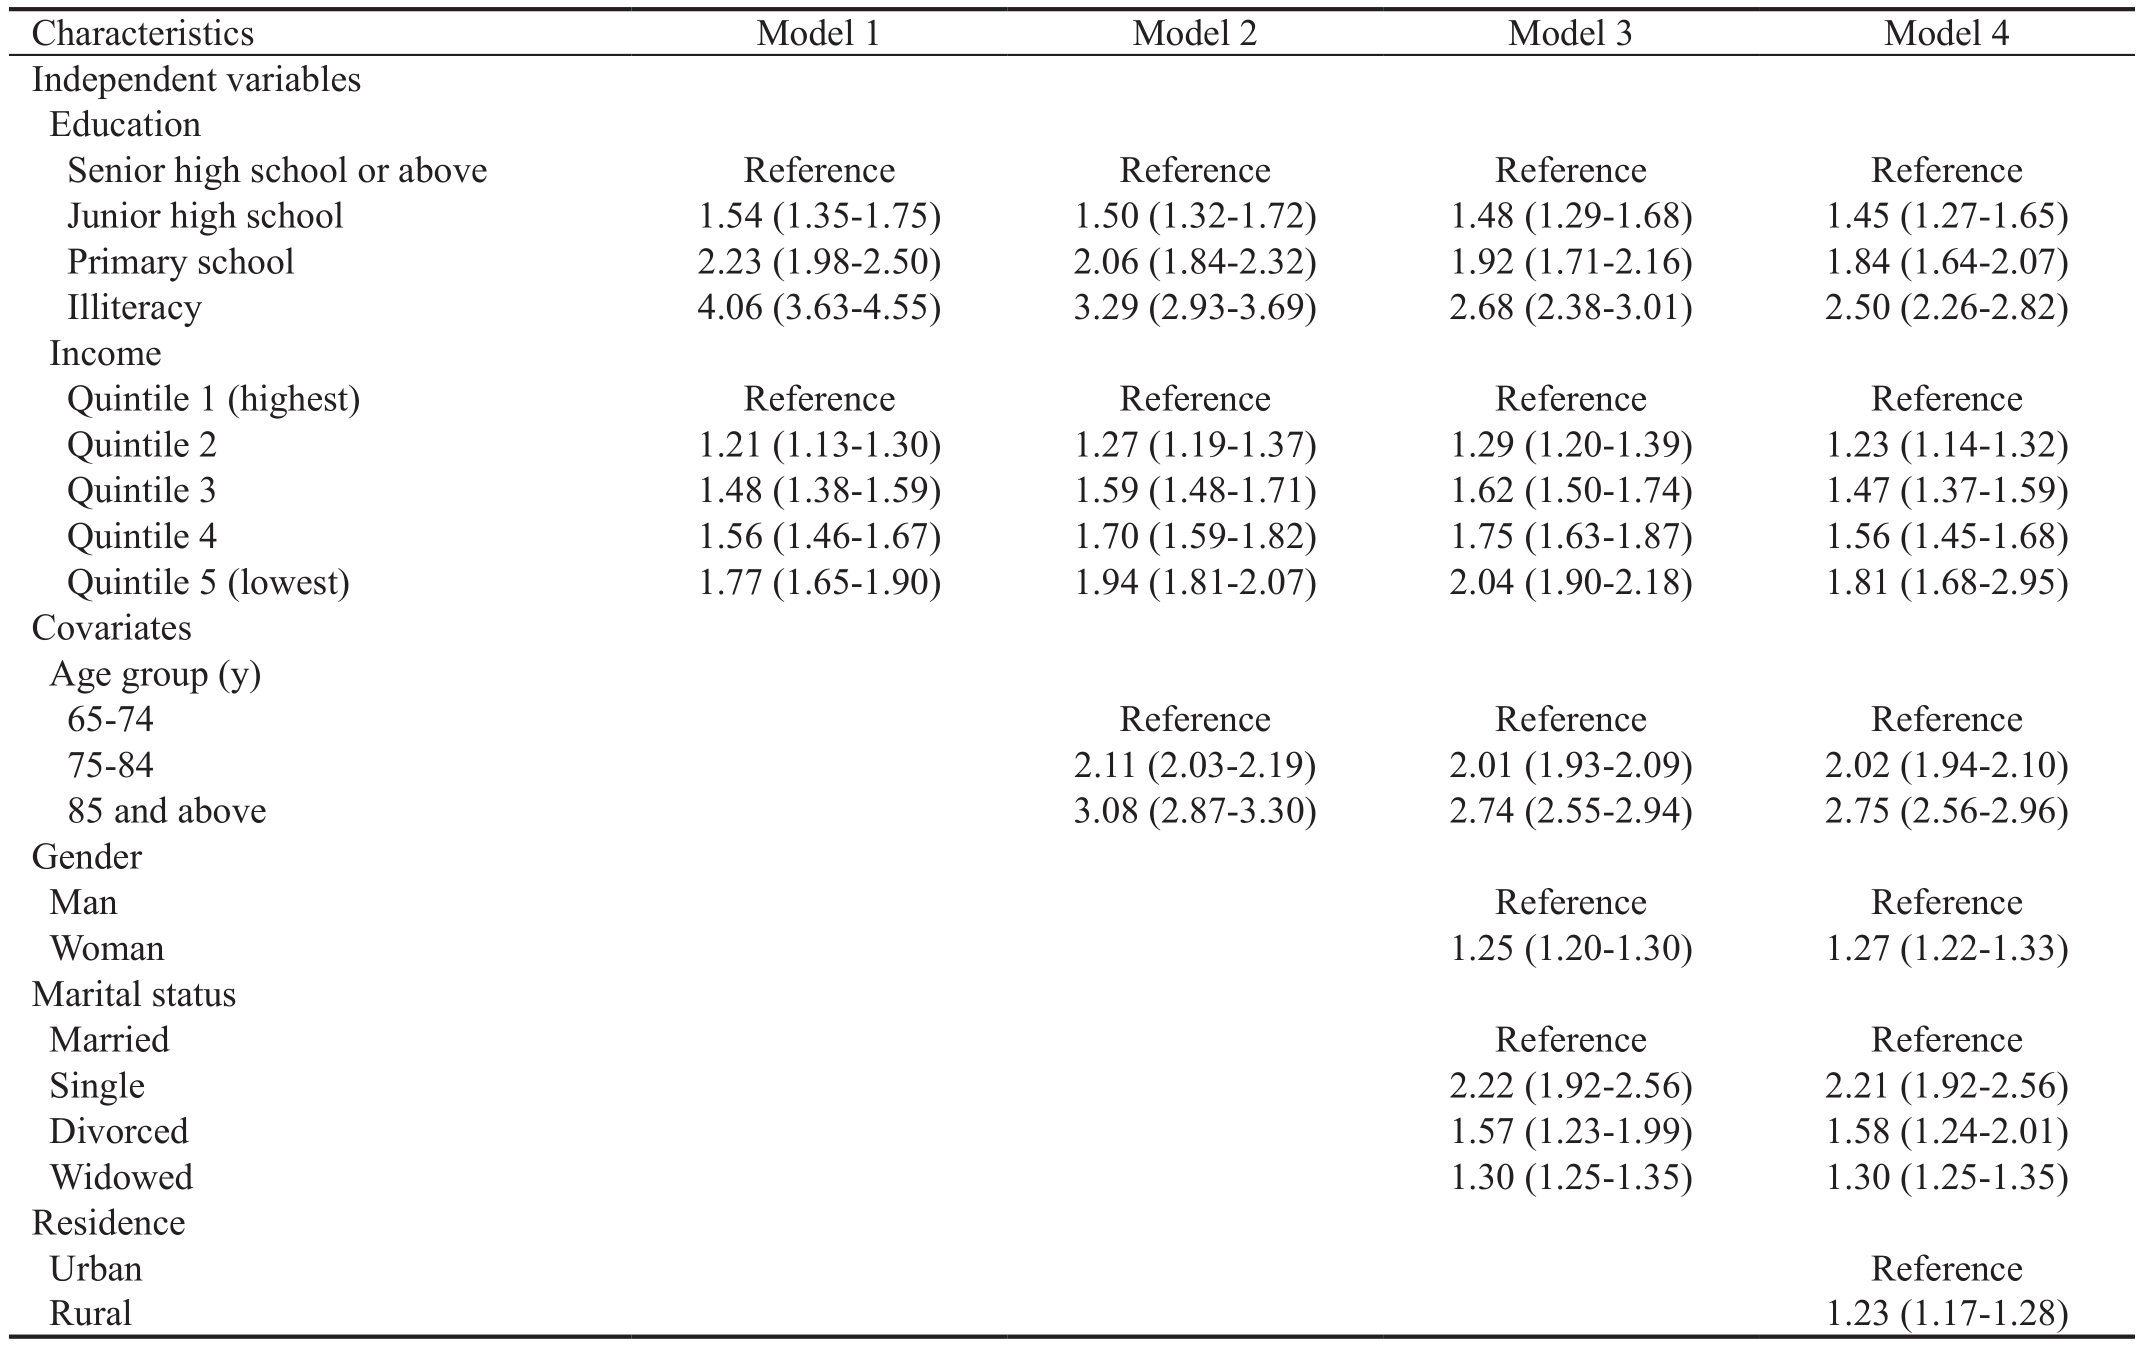
OR: Odds ratio; VD: Visual disability; SES: Socioeconomic status; CI: Confidence interval.
Characteristics Model 1 Model 2 Model 3 Model 4 Independent variables Education Senior high school or above Reference Reference Reference Reference Junior high school 1.54 (1.35-1.75) 1.50 (1.32-1.72) 1.48 (1.29-1.68) 1.45 (1.27-1.65)Primary school 2.23 (1.98-2.50) 2.06 (1.84-2.32) 1.92 (1.71-2.16) 1.84 (1.64-2.07)Illiteracy 4.06 (3.63-4.55) 3.29 (2.93-3.69) 2.68 (2.38-3.01) 2.50 (2.26-2.82)Income Quintile 1 (highest) Reference Reference Reference Reference Quintile 2 1.21 (1.13-1.30) 1.27 (1.19-1.37) 1.29 (1.20-1.39) 1.23 (1.14-1.32)Quintile 3 1.48 (1.38-1.59) 1.59 (1.48-1.71) 1.62 (1.50-1.74) 1.47 (1.37-1.59)Quintile 4 1.56 (1.46-1.67) 1.70 (1.59-1.82) 1.75 (1.63-1.87) 1.56 (1.45-1.68)Quintile 5 (lowest) 1.77 (1.65-1.90) 1.94 (1.81-2.07) 2.04 (1.90-2.18) 1.81 (1.68-2.95)Covariates Age group (y)65-74 Reference Reference Reference 75-84 2.11 (2.03-2.19) 2.01 (1.93-2.09) 2.02 (1.94-2.10)85 and above 3.08 (2.87-3.30) 2.74 (2.55-2.94) 2.75 (2.56-2.96)Gender Man Reference Reference Woman 1.25 (1.20-1.30) 1.27 (1.22-1.33)Marital status Married Reference Reference Single 2.22 (1.92-2.56) 2.21 (1.92-2.56)Divorced 1.57 (1.23-1.99) 1.58 (1.24-2.01)Widowed 1.30 (1.25-1.35) 1.30 (1.25-1.35)Residence Urban Reference Rural 1.23 (1.17-1.28)
Table 4 OR with 95%CI on the association between SES and VD in older adults, aged 65y and above, in urban areas
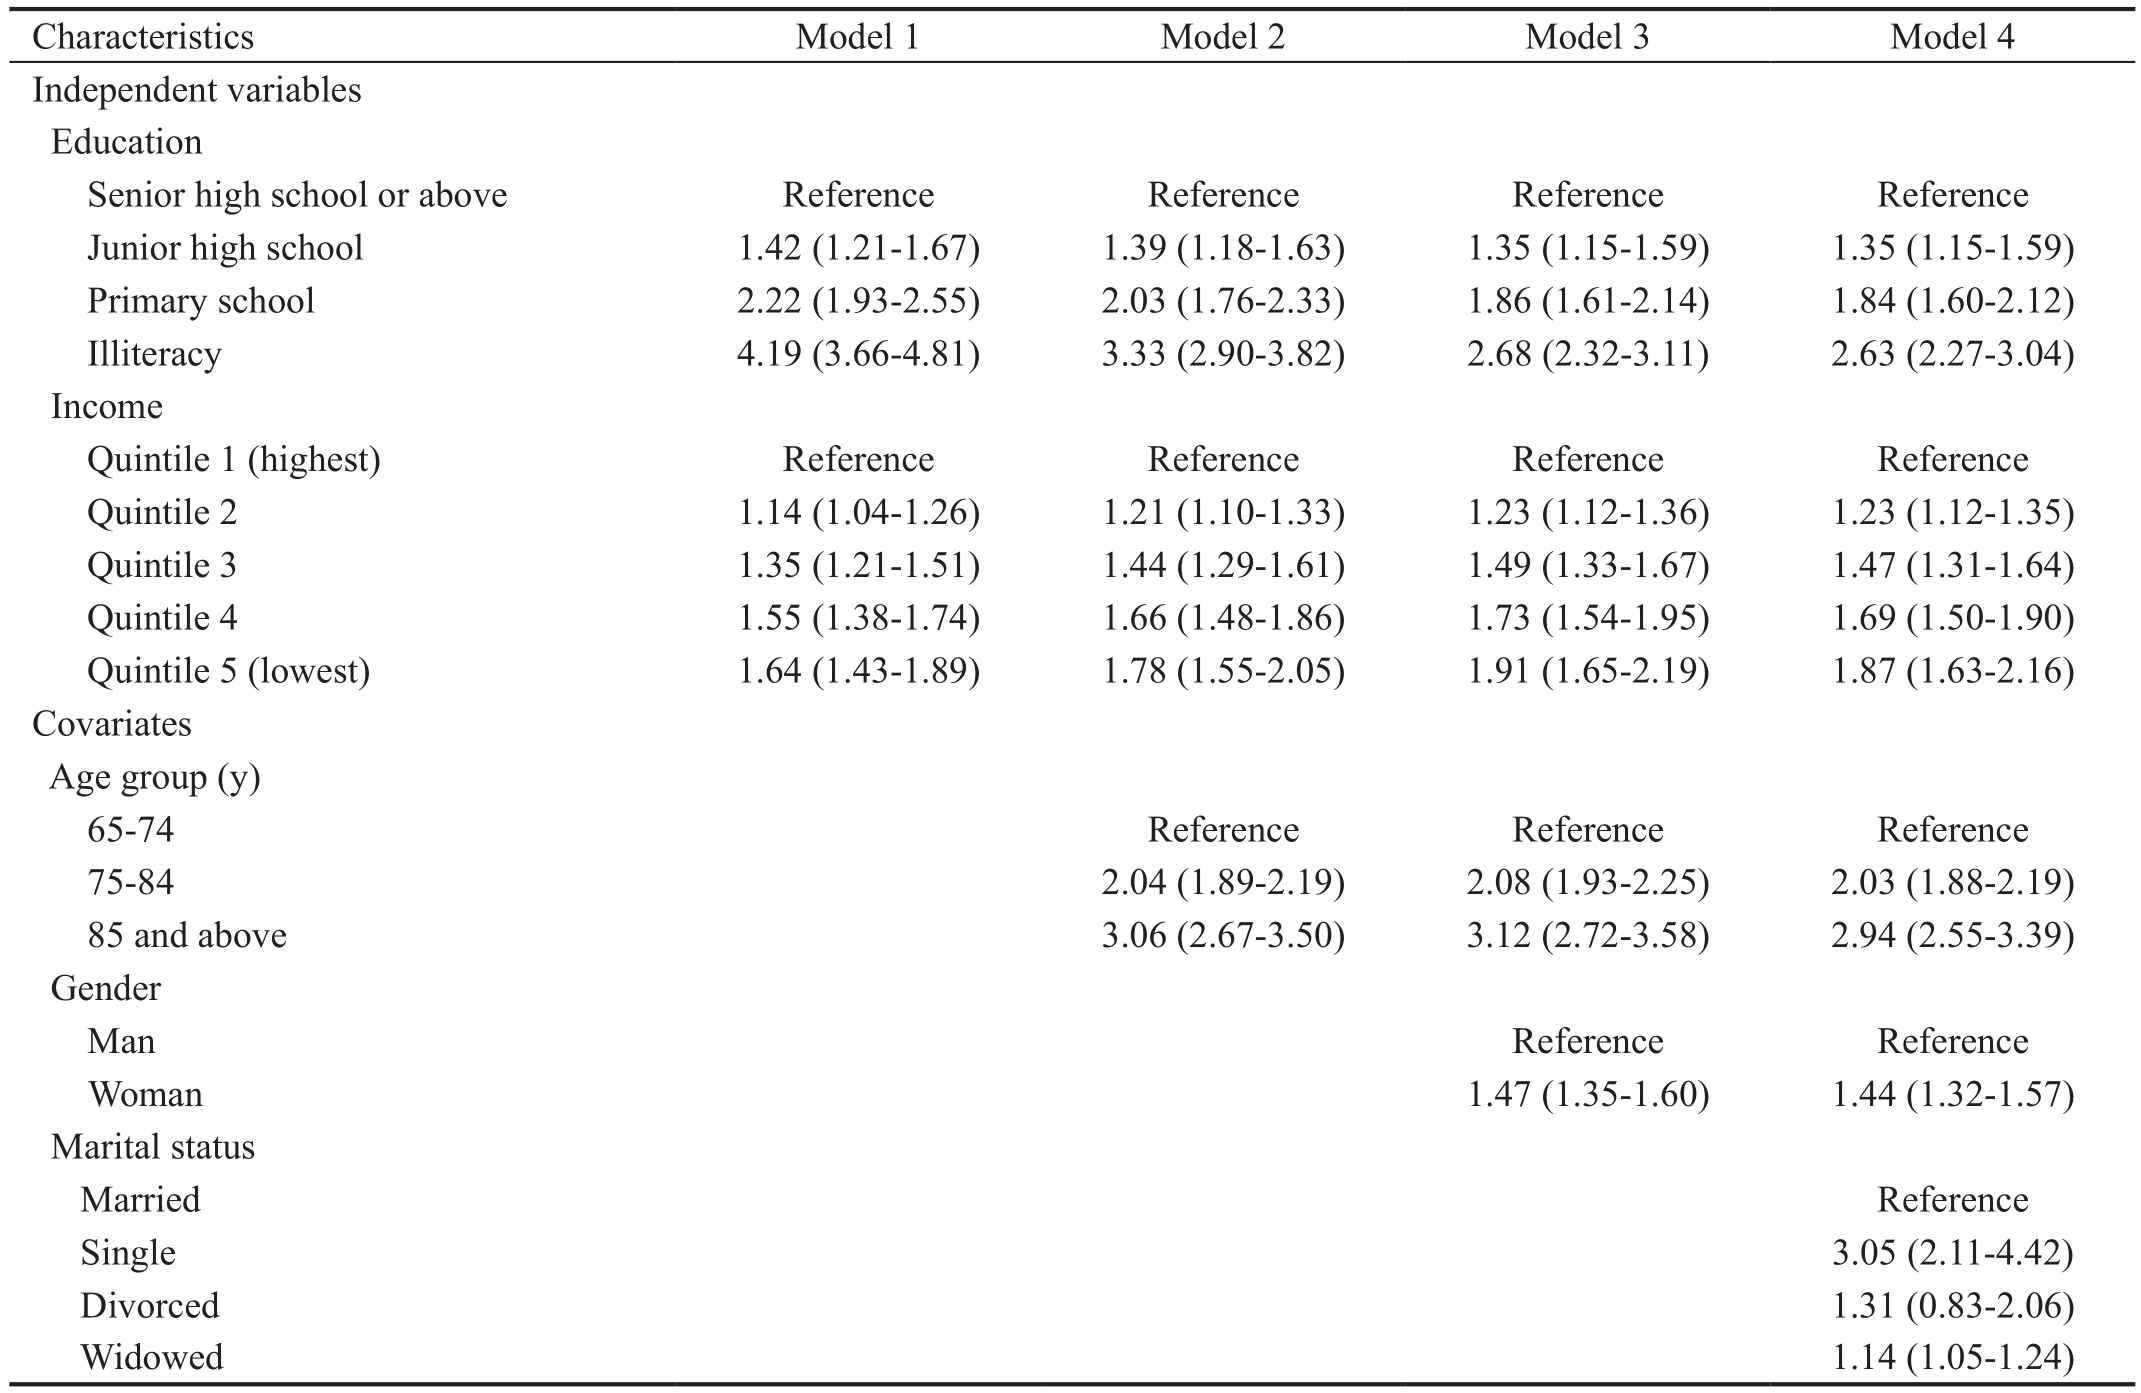
OR: Odds ratio; VD: Visual disability; SES: Socioeconomic status; CI: Confidence interval.
Characteristics Model 1 Model 2 Model 3 Model 4 Independent variables Education Senior high school or above Reference Reference Reference Reference Junior high school 1.42 (1.21-1.67) 1.39 (1.18-1.63) 1.35 (1.15-1.59) 1.35 (1.15-1.59)Primary school 2.22 (1.93-2.55) 2.03 (1.76-2.33) 1.86 (1.61-2.14) 1.84 (1.60-2.12)Illiteracy 4.19 (3.66-4.81) 3.33 (2.90-3.82) 2.68 (2.32-3.11) 2.63 (2.27-3.04)Income Quintile 1 (highest) Reference Reference Reference Reference Quintile 2 1.14 (1.04-1.26) 1.21 (1.10-1.33) 1.23 (1.12-1.36) 1.23 (1.12-1.35)Quintile 3 1.35 (1.21-1.51) 1.44 (1.29-1.61) 1.49 (1.33-1.67) 1.47 (1.31-1.64)Quintile 4 1.55 (1.38-1.74) 1.66 (1.48-1.86) 1.73 (1.54-1.95) 1.69 (1.50-1.90)Quintile 5 (lowest) 1.64 (1.43-1.89) 1.78 (1.55-2.05) 1.91 (1.65-2.19) 1.87 (1.63-2.16)Covariates Age group (y)65-74 Reference Reference Reference 75-84 2.04 (1.89-2.19) 2.08 (1.93-2.25) 2.03 (1.88-2.19)85 and above 3.06 (2.67-3.50) 3.12 (2.72-3.58) 2.94 (2.55-3.39)Gender Man Reference Reference Woman 1.47 (1.35-1.60) 1.44 (1.32-1.57)Marital status Married Reference Single 3.05 (2.11-4.42)Divorced 1.31 (0.83-2.06)Widowed 1.14 (1.05-1.24)
Table 5 OR with 95%CI on the association between SES and VD in older adults, aged 65y and above, in rural areas

OR: Odds ratio; VD: Visual disability; SES: Socioeconomic status; CI: Confidence interval.
Characteristics Model 1 Model 2 Model 3 Model 4 Independent variables Education Senior high school or above Reference Reference Reference Reference Junior high school 1.47 (1.14-1.90) 1.48 (1.15-1.91) 1.45 (1.13-1.88) 1.43 (1.11-1.85)Primary school 1.87 (1.48-2.37) 1.79 (1.41-2.26) 1.70 (1.34-2.14) 1.64 (1.30-2.08)Illiteracy 3.34 (2.65-4.21) 2.77 (2.20-3.50) 2.36 (1.86-2.98) 2.21 (1.75-2.79)Income Quintile 1 (highest) Reference Reference Reference Reference Quintile 2 1.13 (1.00-1.28) 1.15 (1.02-1.03) 1.16 (1.03-1.31) 1.16 (1.03-1.31)Quintile 3 1.34 (1.19-1.50) 1.37 (1.22-1.55) 1.39 (1.23-1.56) 1.39 (1.23-1.56)Quintile 4 1.37 (1.22-1.54) 1.42 (1.27-1.60) 1.45 (1.29-1.63) 1.45 (1.29-1.63)Quintile 5 (lowest) 1.56 (1.39-1.75) 1.63 (1.45-1.83) 1.67 (1.49-1.87) 1.69 (1.51-1.90)Covariates Age group (y)65-74 Reference Reference Reference 75-84 2.14 (2.05-2.36) 2.15 (2.06-2.24) 2.02 (1.93-2.11)85 and above 3.10 (2.85-3.36) 3.07 (2.83-3.33) 2.69 (2.48-2.93)Gender Man Reference Reference Woman 1.28 (1.22-1.34) 1.24 (1.18-1.29)Marital status Married Reference Single 2.10 (1.79-2.46)Divorced 1.69 (1.28-2.25)Widowed 1.35 (1.29-1.41)
DISCUSSION
We investigated the association between multiple measures of SES and VD among older Chinese adults in a largescale, population-based survey of disability. After the initial screening for suspected VD cases by trained interviewers, a final diagnosis of VD was made by ophthalmologists. Previous studies in Singapore and the United States have reported the influence of geographic variations, such as area-level SES indicator surrogates, on VD; geographic variation in China is usually divided into urban and rural areas[20]. To the best of our knowledge, this is the first study to report the association between multiple measures of SES and VD among older adults in mainland China using population-based survey data and medical diagnoses. We examined the association between individual SES and VD, and the association remains robust in both urban and rural areas. We found that among adults aged 65 or older, in both urban and rural areas, lower SES, in the form of education and annual household income per capita,was associated with a higher risk of VD.
The overall prevalence of VD among Chinese adults aged 65 or older in this sample was 7.29% in 2006, with 8.71% in rural areas and 4.82% in urban areas. In 2002, the WHO estimated the prevalence of blindness in people aged 50 or older in China was 2.3% and 6.46 million, respectively[21]. These estimates were mainly based on two blindness studies conducted in suburban Beijing (the Shunyi study) and rural Guangzhou(the Doumen study)[22-23]. Other surveys in mainland China have indicated that the prevalence of blindness ranges from between 1.7% to 2.3% in those aged 50 and above[24]. A population-based study of adults aged 60 or older in Hong Kong found the prevalence of blindness to be 0.49%[25]. The prevalence of blindness and poor vision was 0.59% (0.25%-1.16%) and 2.94% (2.11%-3.99%) in Taiwan, respectively[26].Population-based epidemiological studies of individuals aged between 65 and 84 in developed countries have shown that the prevalence of VD is roughly 2.87% (visual impairment:2.24%; blindness: 0.53%)[27-29]. Because of differences in age and areas studied, the prevalence of VD cannot be directly compared with previous literature, but the range of prevalenceestimates suggests that the results of this study are credible.The prevalence of VD among older adults in this study was higher than estimates provided in previous studies.
This study demonstrates that among older adults in China,lower levels of household income are associated with a greater risk of VD after important covariates (age, gender, and marital status) are considered. In a regression analyses based on area(urban or rural) and gender (supplementary materials), the results remained robust. Previous studies have shown that countries with higher levels of socioeconomic development have a lower prevalence of VD[30]. Moreover, in a given country, residents with lower income levels are more likely to suffer from VD[23,31-33]. The findings of the present study are consistent with prior research. A possible explanation for these findings may be found in the fact that people with lower levels of income are less likely to have access to medical or eye-care services that can address treatable and preventable causes of blindness.
Education, usually measured by years of schooling, is an important proxy for SES. Studies have shown that educational attainment is an independent risk factor for VD[26]. Our findings show that lower levels of education were associated with an increased risk of VD among older adults, even in urban and rural subgroups. This is consistent with previous studies[33-35]. The relationship between education and health inequality has been explained in previous studies[36]. Although the specific mechanisms of the relationship are unclear, we offer several possible explanations for this relationship. One of these possible explanations is that cataracts are a principal cause of blindness in China[37]. Studies have shown that people with lower levels of education are more likely to engage in agricultural activities that carry a risk of extensive exposure to ultraviolet radiation, which may lead to more cataract blindness[38]. Another explanation is due to a lack of medical knowledge, as people with lower education levels are more likely to develop chronic, irreversible blindness, such as glaucoma or age-related macular degeneration[39-40]. Older adults with lower levels of education may have poor access to health-care services for vision-related conditions. Furthermore,people with lower levels of education are more likely to have unhealthy habits such as smoking; these habits may be important risk factors for eye conditions[41].
There are several limitations to this study. First, uncorrected refractive errors (UREs) were not taken into consideration.UREs are the primary cause of low vision and the second leading cause of blindness. According to estimates by the WHO,roughly 153 million people experience visual impairments as a result of UREs; similar to the scale of VD causes by other eye conditions except UREs, about 161 million[8]. Global researchers emphasize the importance of refractive errors in VD[42]. To enable comparisons with previous international studies, we took BCVA as the criterion for VD, which is consistent with the WHO’s International Classification of Diseases, 10th Revision. Second, the etiological diagnosis data presented in the 2nd CSSD are retrospective, and the high prevalence of senile cataracts in China may have obscured the real causes of VD. Thus, we did not explore differences in etiology between urban and rural participants. This study shows that indicators of SES are related to the prevalence of VD among older Chinese adults. It investigated the association between individual SES and VD, with the area-level SES partially controlled. However,the causal relationship is still undefined.
Despite these limitations, the strength of this study lies in its scope: It is the largest population-based, random-sampling survey conducted in mainland China to date. Although Chinese ophthalmologists have conducted many epidemiological investigations, those studies have either been regional studies or have focused on certain age-groups. However, because the study samples and measurement methods were not uniform,the results are not perfectly comparable. Our study provides empirical baseline data for further evaluation of the prevention of age-related eye disease in mainland China.
In conclusion, lower individual-level SES, in the form of household income and education levels, was associated with a higher risk of VD among the older Chinese adults in this study. The observed associations remain significant for both urban and rural samples as well as men and women. This is a preliminary study, and further examination is needed to confirm the findings and identify the mechanisms behind the relationships. More up-to-date information and surveys with regard to VD, especially etiology-prevalence studies, are needed to identify specific policy implications.
ACKNOWLEDGEMENTS
Confiicts of Interest: Dai WW, None; Gao JM, None; He P,None; Ma Z, None; Tian XX, None; Zheng XY, None.
REFERENCES
1 GBD 2015 Disease and Injury Incidence and Prevalence Collaborators.Global, regional, and national incidence, prevalence, and years lived with disability for 310 diseases and injuries, 1990-2015: a systematic analysis for the Global Burden of Disease Study 2015. Lancet 2016;388(10053):1545-1602.
2 MacKenzie PJ, Chang TS, Scott IU, Linder M, Hay D, Feuer WJ,Chambers K. Assessment of vision-related function in patients with agerelated macular degeneration. Ophthalmology 2002;109(4):720-729.
3 Hong T, Mitchell P, Burlutsky G, Gopinath B, Liew G, Wang JJ.Visual impairment and depressive symptoms in an older Australian cohort: longitudinal findings from the Blue Mountains Eye Study. Br J Ophthalmol 2015;99(8):1017-1021.
4 Papudesu C, Clemons TE, Agrón E, Chew EY. Association of mortality with ocular diseases and visual impairment in the age-related eye disease study 2. Ophthalmology 2018;125(4):512-521.
5 Christ SL, Zheng DD, Swenor BK, Lam BL, West SK, Tannenbaum SL, Muñoz BE, Lee DJ. Longitudinal relationships among visual acuity,daily functional status, and mortality: the Salisbury Eye Evaluation Study.JAMA Ophthalmol 2014;132(12):1400-1406.
6 Gupta N, Kocur I. Chronic eye disease and the WHO Universal Eye Health Global Action Plan 2014-2019. Can J Ophthalmol 2014;49(5):403-405.
7 Bourne RRA, Flaxman SR, Braithwaite T, Cicinelli MV, Das A, Jonas JB, Keeffe J, Kempen JH, Leasher J, Limburg H, Naidoo K, Pesudovs K,Resnikoff S, Silvester A, Stevens GA, Tahhan N, Wong TY, Taylor HR;Vision Loss Expert Group. Magnitude, temporal trends, and projections of the global prevalence of blindness and distance and near vision impairment: a systematic review and meta-analysis. Lancet Glob Health 2017;5(9):e888-e897.
8 WHO) WHO. The global burden of disease: 2004 update. 2008.published by the Harvard School of Public Health on behalf of the World Health Organization and the World Bank. Avaliable at: http://www.who.int/iris/bitstream/10665/43942/1/9789241563710_eng.pdf.
9 Zhao YC. China Disabled Persons’ Federation released the latest data of disabled population in China. Disability Research 2012:11-11.
10 Ministry of Health, P. 2010 China Health Statistics Yearbook. Peking Union Medical College press 2010.
11 Pardo-Crespo MR, Narla NP, Williams AR, Beebe TJ, Sloan J,Yawn BP, Wheeler PH, Juhn YJ. Comparison of individual-level versus area-level socioeconomic measures in assessing health outcomes of children in Olmsted County, Minnesota. J Epidemiol Community Health 2013;67(4):305-310.
12 Chua J, Koh JY, Tan AG, Zhao W, Lamoureux E, Mitchell P, Wang JJ,Wong TY, Cheng CY. Ancestry, socioeconomic status, and age-related cataract in Asians: The Singapore Epidemiology of Eye Diseases Study.Ophthalmology 2015;122(11):2169-2178.
13 Cumberland PM, Rahi JS; UK Biobank Eye and Vision Consortium.Visual function, social position, and health and life chances: The UK Biobank Study. JAMA Ophthalmol 2016;134(9):959-966.
14 Tafida A, Kyari F, Abdull MM, Sivasubramaniam S, Murthy GVS,Kana I, Gilbert CE,. Poverty and blindness in nigeria: results from the national survey of blindness and visual impairment. Ophthalmic Epidemiology 2015;22(5):333-341.
15 Ulldemolins AR, Lansingh VC, Valencia LG, Carter MJ, Eckert KA.Social inequalities in blindness and visual impairment: a review of social determinants. Indian J Ophthalmol 2012;60(5):368-375.
16 Zheng XY, Chen G, Song XM, Liu JF, Yan LJ, Du W, Pang LH, Zhang L, Wu JL, Zhang BZ, Zhang J. Twenty-year trends in the prevalence of disability in China. Bull World Health Organ 2011;89(11):788-797.
17 Office of the second national sample survey of disabled persons.Compilation of documents of the second national sample survey of disabled persons. Huaxia Publication Press 2012.
18 Yan H, Zhao JL, Guan HJ, Zhang JK. Study on the formulation of visual disability standards for the Second National Disability Sample Survey. Zhonghua Yan Ke Za Zhi 2007;43:1055-1056.
19 Geyer S, Hemström O, Peter R, Vågerö D. Education, income, and occupational class cannot be used interchangeably in social epidemiology.Empirical evidence against a common practice. J Epidemiol Community Health 2006;60:804-810.
20 Zheng YF, Lamoureux E, Finkelstein E, Wu RY, Lavanya R, Chua D, Aung T, Saw SM, Wong TY. Independent impact of area-level socioeconomic measures on visual impairment. Invest Ophthalmol Vis Sci 2011;52(12):8799-8805.
21 Resnikoff S1, Pascolini D, Etya’ale D, Kocur I, Pararajasegaram R,Pokharel GP, Mariotti SP. Global data on visual impairment in the year 2002. Bull World Health Organ 2004;82(11):844-851.
22 Li SZ, Xu JJ, He MG, Wu KL, Munoz SR, Ellwein LB. A survey of blindness and cataract surgery in Doumen County, China. Ophthalmology 1999;106(8):1602-1608.
23 Zhao JL, Jia L, Sui RF, Ellwein LB. Prevalence of blindness and cataract surgery in Shunyi County, China. Am J Ophthalmol 1998;126(4):506-514.
24 Cheng JW, Cheng SW, Cai JP, Li Y, Wei RL. The prevalence of visual impairment in older adults in mainland China: a systematic review and meta-analysis. Ophthalmic Res 2013;49(1):1-10.
25 Michon JJ, Lau J, Chan WS, Ellwein LB. Prevalence of visual impairment, blindness, and cataract surgery in the Hong Kong elderly. Br J Ophthalmol 2002;86(2):133-139.
26 Liu JH, Cheng CY, Chen SJ, Lee FL. Visual impairment in a Taiwanese population: Prevalence, causes, and socioeconomic factors. Ophthalmic Epidemiol 2001;8(5):339-350.
27 Congdon N, O’Colmain B, Klaver CC, Klein R, Muñoz B, Friedman DS, Kempen J, Taylor HR, Mitchell P; Eye Diseases Prevalence Research Group. Causes and prevalence of visual impairment among adults in the United States. Arch Ophthalmol 2004;122:477-485.
28 Klaver CC, Wolfs RC, Vingerling JR, Hofman A, de Jong PT. Agespecific prevalence and causes of blindness and visual impairment in an older population: the Rotterdam Study. Arch Ophthalmol 1998;116(5):653-658.
29 Klein R, Klein BEK. The prevalence of age-related eye diseases and visual impairment in aging: current estimates. Invest Ophthalmol Vis Sci 2013;54(14):ORSF5-ORSF13.
30 Ho VH, Schwab IR. Social economic development in the prevention of global blindness. Br J Ophthalmol 2001;85(6):653-657.
31 Chou CF, Barker LE, Crews JE, Primo SA, Zhang XZ, Elliott AF,McKeever Bullard K, Geiss LS, Saaddine JB. Disparities in eye care utilization among the United States adults with visual impairment:findings from the behavioral risk factor surveillance system 2006-2009.Am J Ophthalmol 2012;154(6):S45-S52.e1.
32 Ulldemolins AR, Lansingh VC, Valencia LG, Carter MJ, Eckert KA.Social inequalities in blindness and visual impairment: a review of social determinants. Indian J Ophthalmol 2012;60(5):368-375.
33 Zhao JL, Xu X, Ellwein LB, Cai N, Guan HJ, He MG, Liu P, Lv J, Sheng XL, Yang PZ, Yi JL, Yang M, Zhang R, Ding XH, Du LP, Li FR, Lu H, Shao WQ, Wang JW, Yuan YS, Zhou R, Zhuang WJ, An L.Prevalence of vision impairment in older adults in rural China in 2014 and comparisons with the 2006 China nine-province survey. Am J Ophthalmol 2018;185:81-93.
34 Song WL, Sun X, Shao ZB, Zhou XR, Kang Y, Sui H, Yuan HP.Prevalence and causes of visual impairment in a rural North-east China adult population: a population-based survey in Bin County, Harbin. Acta Ophthalmol 2010;88(6):669-674.
35 Snellingen T, Shrestha BR, Gharti MP, Shrestha JK, Upadhyay MP,Pokhrel RP. Socioeconomic barriers to cataract surgery in Nepal: the south Asian cataract management study. Br J Ophthalmol 1998;82(12):1424-1428.
36 Marmot M. Social determinants of health inequalities. Lancet 2005;365(9464):1099-1104.
37 WHO. Global initiative for the elimination of avoidable blindness(Vision 2020): blindness as a public health problem in China. 1999.Available at: http://apps.who.int/iris/handle/10665/63748?locale=ru.
38 Delcourt C, Cougnard-Grégoire A, Boniol M, Carrière I, Doré JF,Delyfer MN, Rougier MB, Le Goff M, Dartigues JF, Barberger-Gateau P,Korobelnik JF. Lifetime exposure to ambient ultraviolet radiation and the risk for cataract extraction and age-related macular degeneration: the alienor study. Invest Ophthalmol Vis Sci 2014;55(11):7619-7627.
39 Newman-Casey PA, Dayno M, Robin AL. Systematic review of educational interventions to improve glaucoma medication adherence: an update in 2015. Expert Rev Ophthalmol 2016;11(1):5-20.
40 Tomany SC, Wang JJ, Van Leeuwen R, Klein R, Mitchell P, Vingerling JR, Klein BE, Smith W, De Jong PT. Risk factors for incident age-related macular degeneration: pooled findings from 3 continents. Ophthalmology 2004;111(7):1280-1287.
41 Age-Related Eye Disease Study Research Group. Risk factors associated with age-related macular degeneration. A case-control study in the age-related eye disease study: Age-Related Eye Disease Study Report Number 3. Ophthalmology 2000;107(12):2224-2232.
42 Fricke TR, Holden BA, Wilson DA, Schlenther G, Naidoo KS,Resnikoff S, Frick KD. Global cost of correcting vision impairment from uncorrected refractive error. Bull World Health Organ 2012;90(10):728-738.
Citation: Dai WW, Gao JM, He P, Ma Z, Tian XX, Zheng XY. The association between socioeconomic status and visual disability among older adults in China. Int J Ophthalmol 2019;12(1):106-113
DOl:10.18240/ijo.2019.01.17
● KEYWORDS: visual disability; prevalence; socioeconomic status; older adults; risk factors
Received: 2018-08-23 Accepted: 2018-11-07
Correspondence to: Xiao-Ying Zheng. Institute of Population Research, APEC Health Science Academy (HeSAY), Peking University, Beijing 100891, China. xzheng@pku.edu.cn
Co- first authors: Wan-Wei Dai and Jia-Min Gao