lntraocular pressurefluctuation and the risk of glaucomatous damage deterioration: a Meta-analysis
Zhen-Zhen Guo1,2, Karen Chang3,4, Xin Wei1,4
1Department of Ophthalmology, West China Hospital, Sichuan University, Chengdu 610041, Sichuan Province, China
2Department of Ophthalmology, First Hospital of Xi’an, Xi’an 710002, Shaanxi Province, China
3Graduate Institute of Clinical Dentistry School of Dentistry Taiwan University, Taipei 86222, Taiwan, China
4Schepens Eye Research Institute, MEEI, Harvard Medical School, Boston 02114, USA
Abstract● AlM: To systematically review whether the increased fluctuation of intraocular pressure (lOP) is a risk factor for open angle glaucoma (OAG) progression.● METHODS: Scientific studies relevant to lOP fluctuation and glaucoma progression were retrieved from MEDLlNE,EMBASE and CENTRAL databases, and were listed as references in this paper. The hazard ratio (HR) was calculated by using fixed or random-effects models according to the heterogeneity of included studies.● RESULTS: lndividual data for 2211 eyes of 2637 OAG patients in fourteen prospective studies were included in this Meta-analysis. All studies were longitudinal clinical studies with follow-up period ranging from 3 to 8.5y. The combined HR was 1.23 (95%Cl 1.04-1.46, P=0.02) for the association between lOP fluctuation and glaucoma onset or progression with the evidence of heterogeneity (P<0.1).Subgroup analyses with different types of lOP fluctuation were also evaluated. Results indicated that the summary HR was 0.98 (95%Cl 0.78-1.24) in short-term lOP fluctuation group, which showed no statistical significance with heterogeneity, whereas, the combined HR was 1.43 (95%Cl 1.13-1.82, P=0.003) in long-term lOP fluctuation group without homogeneity. Sensitivity analysis further showed that the pooled HR was 1.10 (95%Cl 1.03-1.18, P=0.004) for long-term lOP fluctuation and visual function progression with homogeneity among studies (P=0.3).● CONCLUSlON: Long-term lOP fluctuation can be a risk factor for glaucoma progression based on the presented evidence. Thus, controlling the swing of lOP is crucial for glaucoma or glaucoma suspecting patients.
INTRODUCTION
Glaucoma currently represents a leading cause of irreversible vision loss worldwide. Although the progression can be slowed or halted by hypotensive therapy via medical, surgical or laser treatments, some patients in clinical practice who fall within the normal range of intraocular pressure (IOP) still suffer from progressive visual function loss[1]. Therefore, besides measuring the IOP, researchers have commenced looking for independent risk factors for glaucoma progression. Potential risk factors as IOP fluctuation,myopia, age, blood pressure and family history have come into researchers’ sight[2]. To date, great quantity of studies on such topics have been published, especially in IOP fluctuation,including two of the large well known glaucoma clinical studies: Advanced Glaucoma Intervention Study (AGIS)[3]and Early Manifest Glaucoma Trial (EMGT)[4]. Nevertheless,the coincidence of IOP fluctuation and glaucoma progression had not been concluded within these published studies. For instance, AGIS reported that IOP fluctuation was a risk factor for glaucoma progression[3], while EMGT concluded that IOP fluctuation was not a factor for glaucoma development and progression[4].
Besides, the majority of publications mentioned above which relevant to IOP fluctuation and glaucoma were designed as large longitudinal studies with a long follow-up duration.During such long follow-up period, it is prone to result in censored data from lost to follow-up, death, or other situations.Thus, for these types of data with subsets of inevitable censored data, it has been advocated to be analyzed with Cox proportional hazards model[5] and consider hazard ratio (HR)as combined effect estimate in the Meta-analysis of survival data[6]. Hence, we objected to conduct the Meta-analysis based on time-to-event data with respect of the conflict relationship between IOP fluctuation and glaucoma onset or progression.
MATERIALS AND METHODS
Search Strategy We systematically searched PubMed,along with EMBASE and CENTRAL electronic database(up to August 2017 respectively) for relevant studies about the association between IOP fluctuation and glaucoma progression. The search strategy for PubMed and EMBASE detailed as: (intraocular pressure$ fluctuation$ OR IOP fluctuation$).af. OR (ocular perfusion pressure$ fluctuation$OR OPP fluctuation$).af. OR (diurnal IOP OR diurnal intraocular pressure$).af. OR (nocturnal intraocular pressure$OR nocturnal IOP).af. OR (24 hour intraocular pressure$OR 24 hour IOP).af. OR (24h intraocular pressure$ OR 24h IOP).af. OR (circadian intraocular pressure$ OR circadian IOP).af. OR (intraocular r pressure curve$ OR IOP curve$).af. OR (intraocular pressure variation$ OR IOP variation).af..The results of the aforesaid search strategy were incorporated with (glaucoma$ progression$).af.. Similar search terms were used in Cochrane with the pattern “intraocular pressure$fluctuation$: ti, ab, kw OR IOP fluctuation$: ti, ab, kw in Trials(word variations have been searched)”.
All retrieved items were imported into EndNote X7, and those duplicate reports were manually removed. There was no limitation of language. Included papers were shown in the reference, and were further reviewed to identify the potential eligibility.
Inclusion and Exclusion Criteria The studies were included if they met the following criteria: 1) patients were openangle glaucoma (OAG) or suspects; 2) IOP fluctuation as the covariant; 3) visual field or relative glaucomatous structure parameters progression as end point; 4) reported HR estimates with 95% confidence intervals (CIs) from Cox proportional hazards model or allowed to calculate these statistics according to presented data and survival curves[7-8]. IOP fluctuation, a time-dependent variable, was classified into short-term or long-term fluctuation. The short-term fluctuation referred to fluctuation within a time period that was less than or equal to 24h, while the long-term fluctuation was defined as fluctuation within a time period longer than 24h[9]. The long-term fluctuation could be calculated either as the difference between the highest and the lowest IOP values or the standard deviation(SD) of all IOP readings. If the same study population was presented in multiple publications, only the one which the methodology was more homologous to others would be further analyzed to avoid possible bias[10].
Data Extraction and Quality Assessment The following characteristics of each included studies were extracted: first author’s last name, publication year, study design, sample type and size, age, follow-up duration, sex distribution, ethnicity of the study population, type of tonometer and perimetry,definition of IOP fluctuation and glaucoma progression, and adjustment risk factors. Although one of the included reports was published as an abstract in the Association for Research in Vision and Ophthalmology (ARVO) annual meeting[11], its data and the segmental information were completely derived from the AGIS[12].
To compute the combined HR estimates with 95%CIs, data including the natural logarithm HR and standard error (SE)were necessary. Most HR and 95%CIs were reported in the majority of articles that the required data could be easily generated. Only one[11] of the studies provided HR and P value,hence the SE value was calculated with formula (logarithm of HR/Z statistic corresponding to P value).
There were no validated or established tools for estimating the observational studies quality[13]. Therefore, we examined and compared the included reports with following items: methods for measuring and calculating IOP fluctuation and glaucoma progression, design-specific sources of bias, methods for controlling confounding, statistical methods, and conflict of interest (COI)[14]. All included reports had no COI and were further presented in Tables 1 and 2.
Statistical Analysis Summary effect estimate was calculated with the method of inverse variance. Statistical heterogeneity among studies was examined by the Q test (P<0.1 was considered as statistically significant) and measured with I2 statistic, which was the proportion of between-study variation in total variation[15]. If I2 was no more than 50%, we used fixed effects model to calculate the pooled HR and 95%CIs.Otherwise the combined effect estimate was calculated with random effects model[16], which not only weighed the study based on sample size, but also based on between-study variation (such as inclusion criteria of cases, age and sex distribution of study populations, and differences in follow-up time) to compensate for the heterogeneity. Sensitivity analysis was conducted to investigate the potential influence on the pooled HR estimate by omitting one or more studies and combining the remainders.
Differences between the subgroups were estimated via comparing the combined effect estimates with Chi-square analysis. Potential publication bias was rated by funnel plots. All analyses were run using Review Manager (Version 5.3 Cochrane Collaboration, Nordic Cochrane Centre,Copenhagen, Denmark). A two-tailed P value less than 0.05 was considered statistically significant.
RESULTS
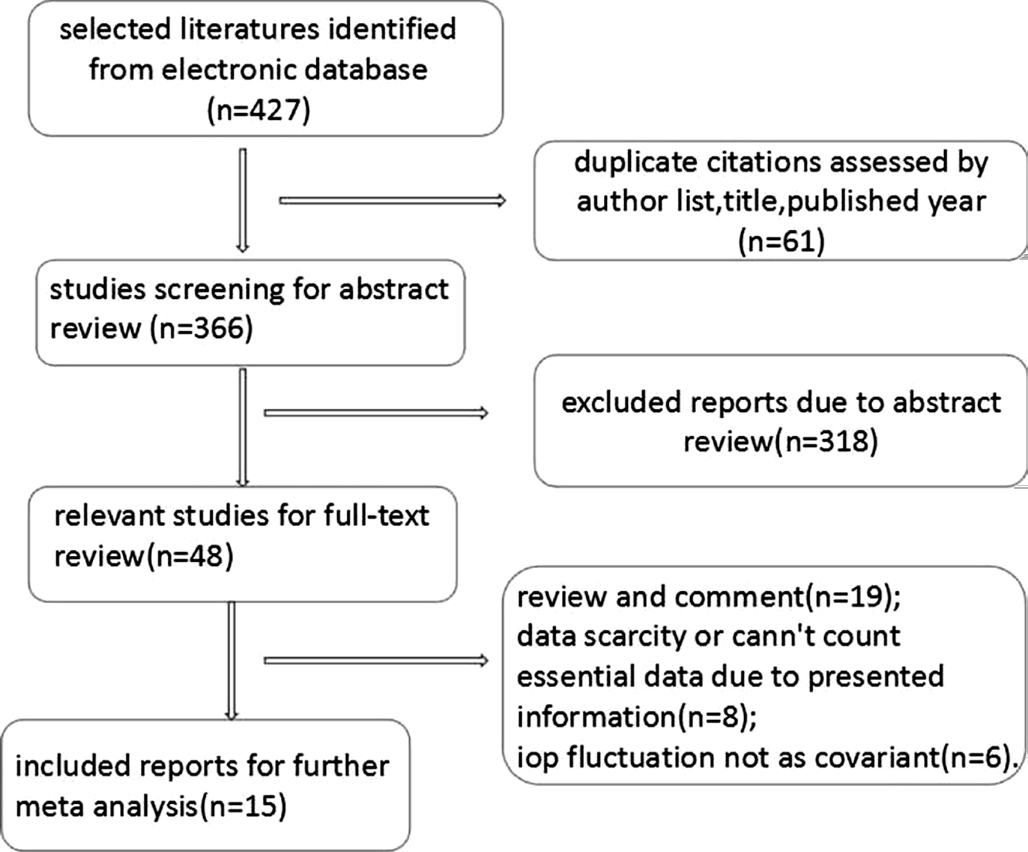
Fifteen literatures[4,11,17-29], published from 1998 to 2016, met the inclusion criteria as the flow diagram of screening eligible studies shown (Figure 1). Nevertheless, one study[25] in line with the prespecified rules was excluded on account of thesame study population and statistical method as in the Sung et al[23] study. Therefore, the overview information of final 14 eligible studies were shown as Table 1. All qualified studies referred to 2211 eyes of 2637 OAG patients, except the study with an unavailable study size[26]. These included publications were composed of 2 abstracts from the ARVO annual meeting and 12 full-text articles. Different types of IOP fluctuation reported by all included studies were specified as 4 reports on short-term IOP fluctuation (difference of the nadir and peak IOP within 24h) and 10 studies about the long-term IOP fluctuation (SD of all included IOP readings).
Table 1 The characteristic of eligible studies
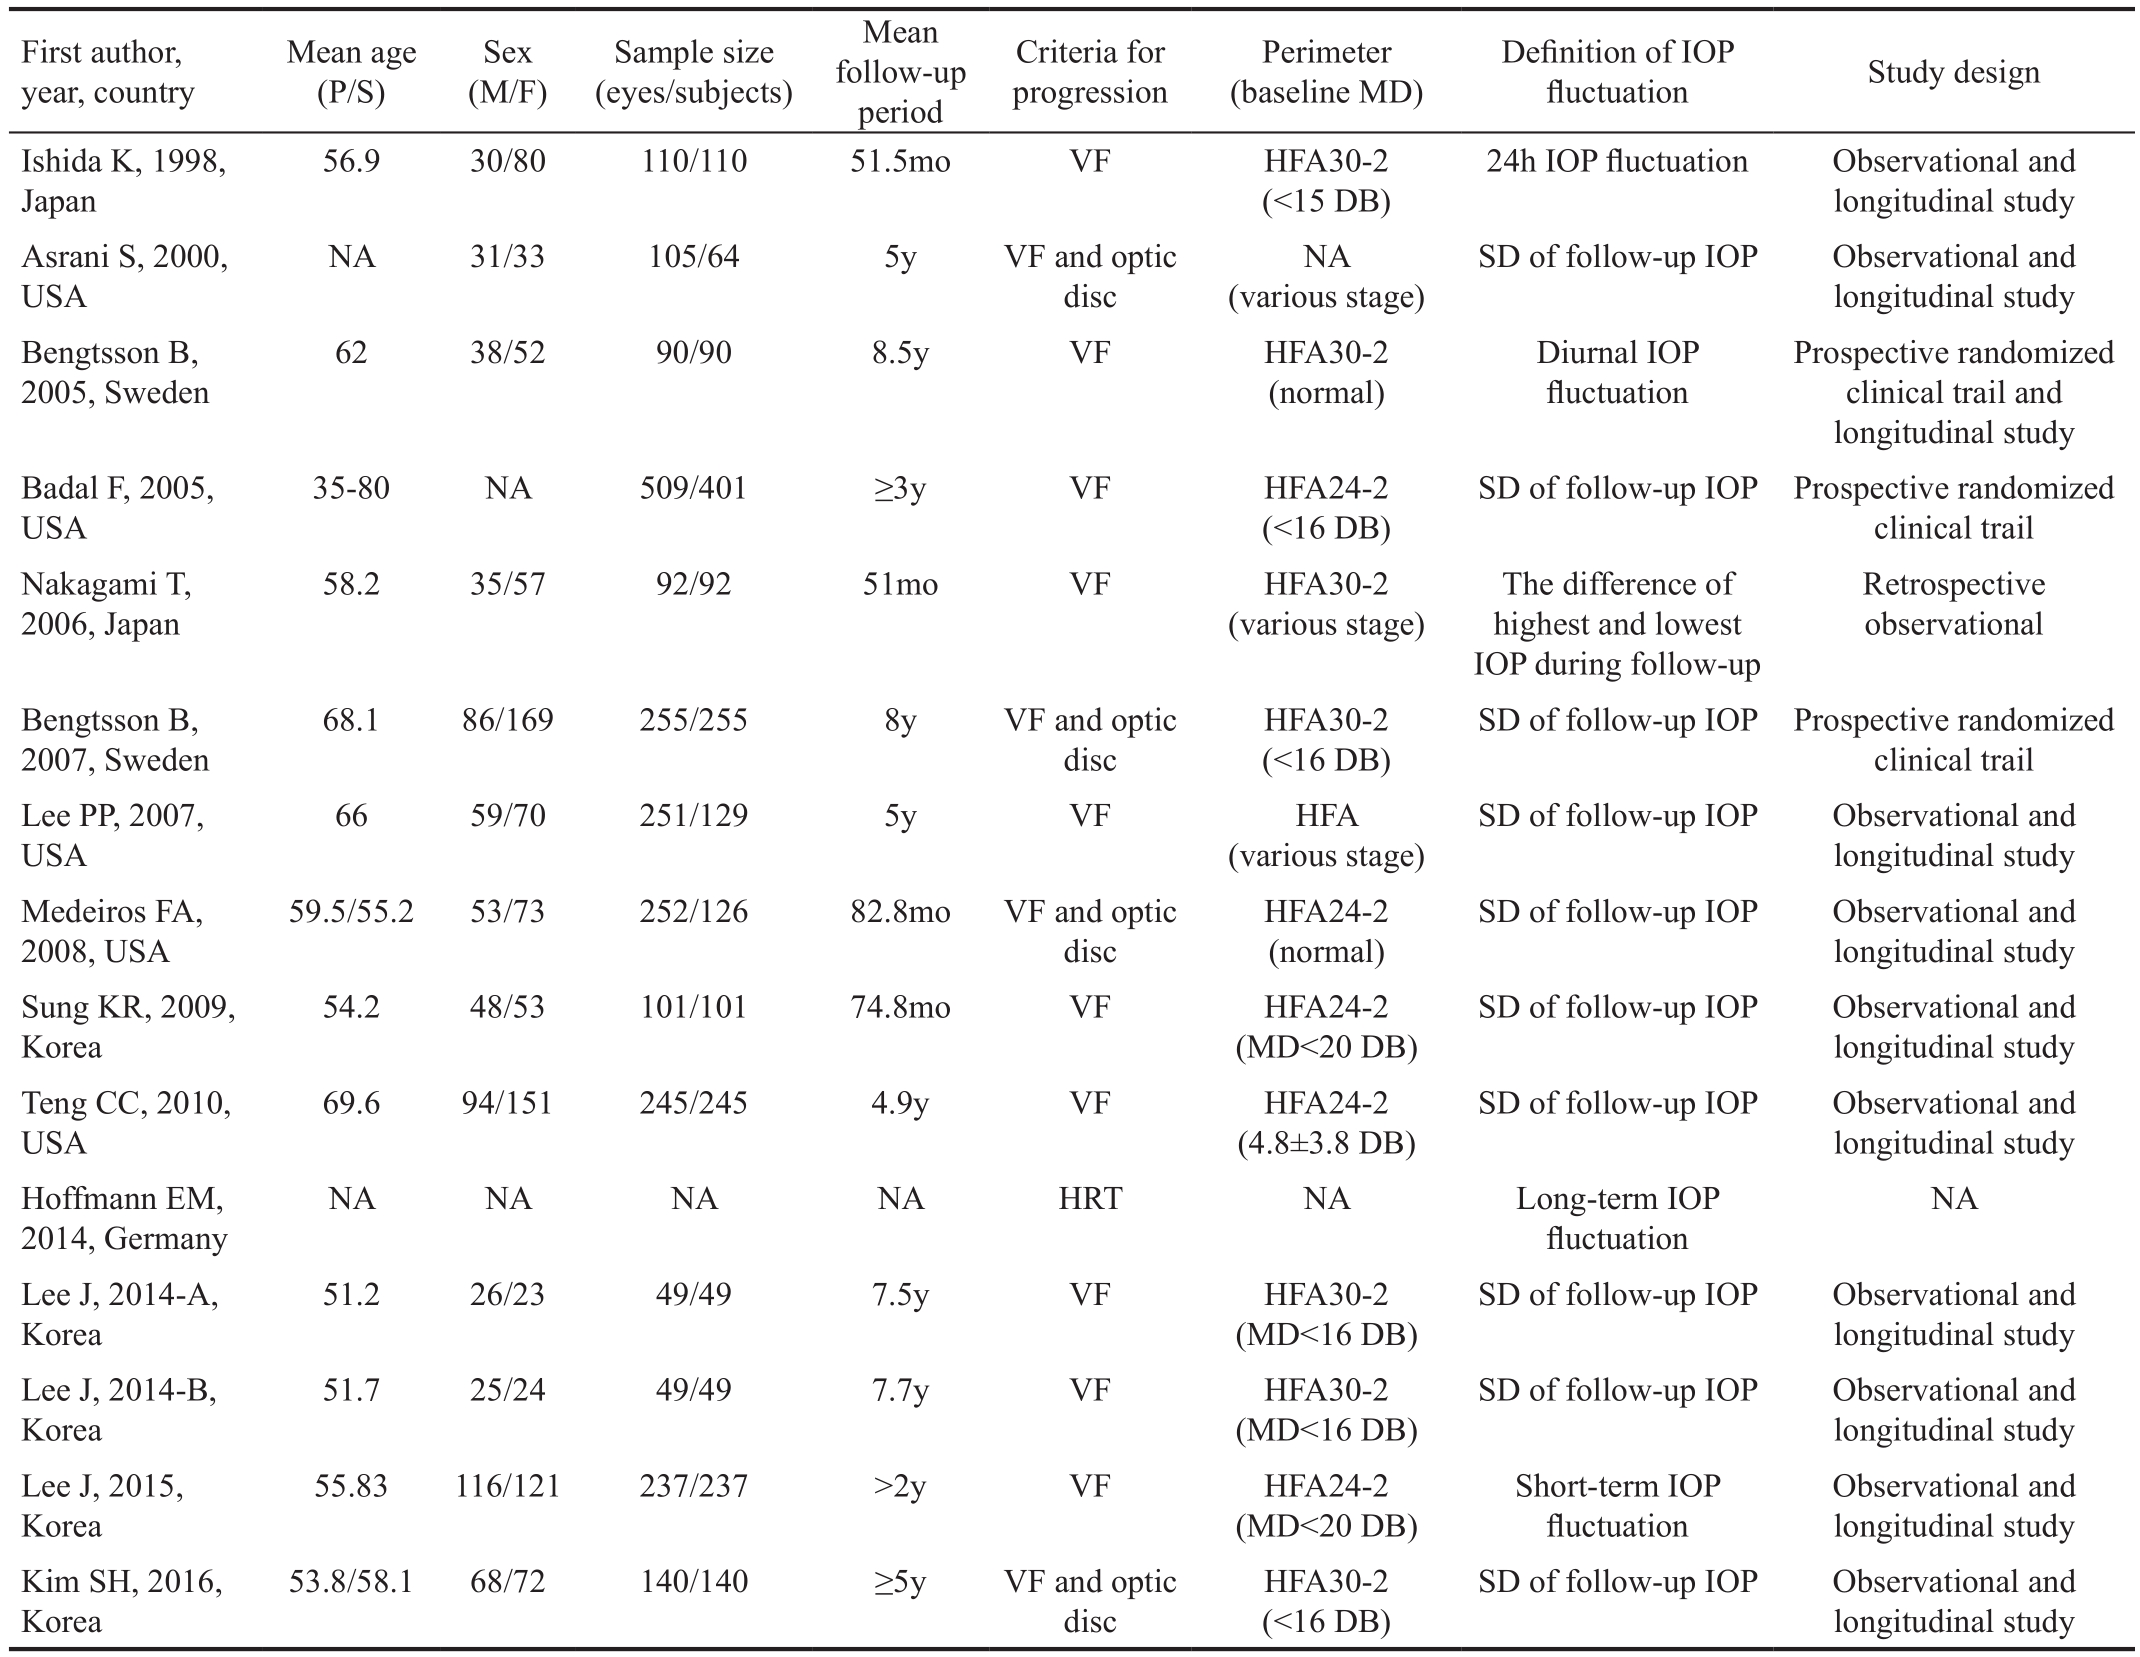
P/S: Mean age of progression/stable group; M/F: The number of male/female; VF: Visual field; MD: Mean defect; HFA 30-2/24-2: Humphrey field analyzer central 30-2/24-2 program; SD: Standard deviation; IOP: Intraocular pressure; HRT3: Heidelberg retina tomography-III; NA: Not available.
First author,year, country l uctuation Study design Ishida K, 1998,Japan Mean age(P/S)Sex(M/F)Sample size(eyes/subjects)Mean follow-up period Criteria for progression Perimeter(baseline MD)Definition of IOP f 24h IOP fluctuation Observational and longitudinal study Asrani S, 2000,USA 56.9 30/80 110/110 51.5mo VF HFA30-2(<15 DB)SD of follow-up IOP Observational and longitudinal study Bengtsson B,2005, Sweden NA 31/33 105/64 5y VF and optic disc NA(various stage)Prospective randomized clinical trail and longitudinal study Badal F, 2005,USA 62 38/52 90/90 8.5y VF HFA30-2(normal)Diurnal IOP fluctuation SD of follow-up IOP Prospective randomized clinical trail Nakagami T,2006, Japan 35-80 NA 509/401 ≥3y VF HFA24-2(<16 DB)58.2 35/57 92/92 51mo VF HFA30-2(various stage)The difference of highest and lowest IOP during follow-up Retrospective observational Bengtsson B,2007, Sweden SD of follow-up IOP Prospective randomized clinical trail Lee PP, 2007,USA 68.1 86/169 255/255 8y VF and optic disc HFA30-2(<16 DB)SD of follow-up IOP Observational and longitudinal study Medeiros FA,2008, USA 66 59/70 251/129 5y VF HFA(various stage)SD of follow-up IOP Observational and longitudinal study Sung KR, 2009,Korea 59.5/55.2 53/73 252/126 82.8mo VF and optic disc HFA24-2(normal)SD of follow-up IOP Observational and longitudinal study Teng CC, 2010,USA 54.2 48/53 101/101 74.8mo VF HFA24-2(MD<20 DB)SD of follow-up IOP Observational and longitudinal study Hoffmann EM,2014, Germany 69.6 94/151 245/245 4.9y VF HFA24-2(4.8±3.8 DB)NA NA NA NA HRT NA Long-term IOP f NA l uctuation Lee J, 2014-A,Korea SD of follow-up IOP Observational and longitudinal study Lee J, 2014-B,Korea 51.2 26/23 49/49 7.5y VF HFA30-2(MD<16 DB)SD of follow-up IOP Observational and longitudinal study Lee J, 2015,Korea 51.7 25/24 49/49 7.7y VF HFA30-2(MD<16 DB)SD of follow-up IOP Observational and longitudinal study Observational and longitudinal study Kim SH, 2016,Korea 55.83 116/121 237/237 >2y VF HFA24-2(MD<20 DB)Short-term IOP fluctuation 53.8/58.1 68/72 140/140 ≥5y VF and optic disc HFA30-2(<16 DB)
Two reports among the 14 included studies were respectively with two study subgroups, consequently 16 data items (Table 2)were for further Meta-analysis. Among these, eight raw data items were identified that the IOP fluctuation was a statistically significant risk factor for glaucoma progression, and the other eight remainders did not. The pooled HR was 1.23 (95%CI 1.04-1.46, P=0.02), which was computed by random effect model due to statistical heterogeneity (P<0.1).According to different types of IOP fluctuation within eligible publications, stratification analysis was performed between short-term IOP fluctuation group and long-term IOP fluctuation group. The difference between two subgroups was statistically significant (P=0.03) and the results showed that the combined HR was 0.98 (95%CI 0.78-1.24, P=0.89) and 1.43 (95%CI 1.13-1.82, P=0.003) respectively for short-term IOP fluctuation group and long-term IOP fluctuation group. However, both pooled HR estimates were with heterogeneity.
Table 2 Extracted data items
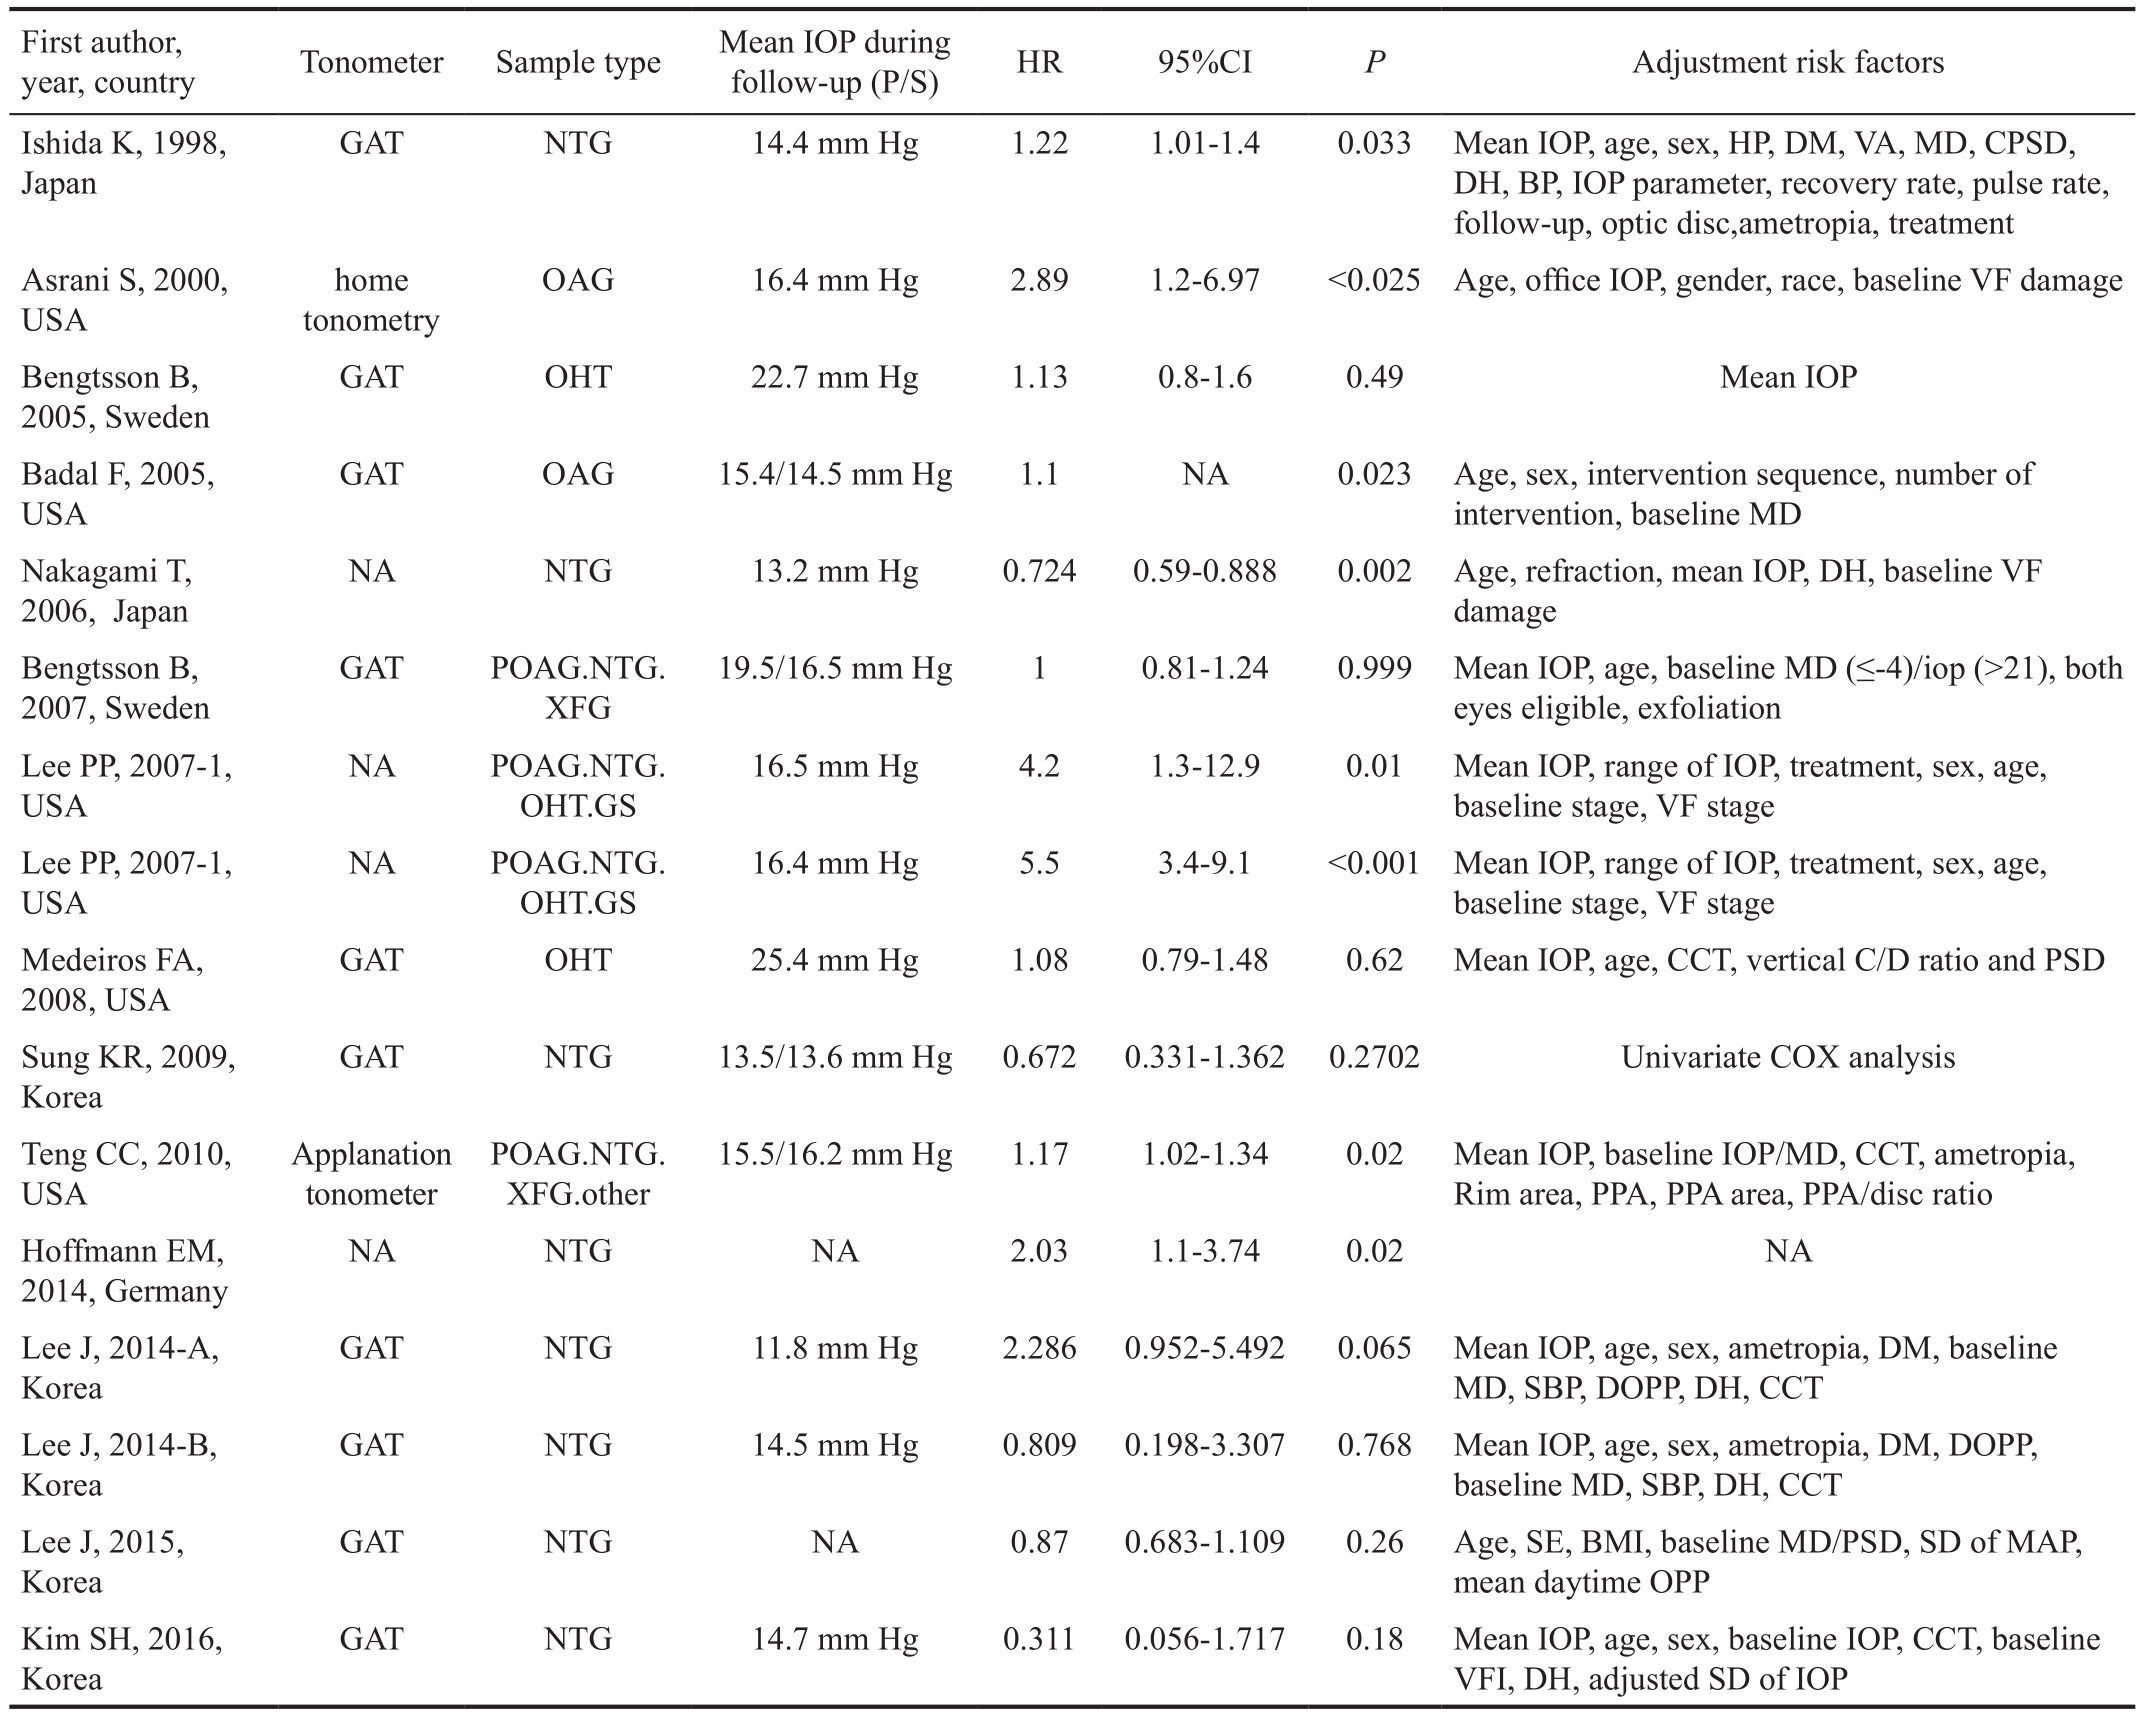
IOP: Intraocular pressure; P/S: Mean IOP of progression/stable group during follow-up; NA: Not available; OHT: Ocular hypertension; NTG:Normal-tension glaucoma; POAG: Primary open angle glaucoma; XFG: Exfoliation glaucoma; GS: Glaucoma suspect; MD: Mean defect; VF:Visual field; CCT: Central corneal thickness; PSD: Pattern standard deviation; VFI: Visual field index; DH: Disc hemorrhage; SE: Spherical equivalent; PPA: Parapapillary atrophy; VA: Visual acuity; GAT: Goldmann applanation tonometer; DM: Diabetes mellitus; HP: Hypertension;MAP: Mean arterial pressure; OPP: Ocular perfusion pressure; BP: Blood pressure; BMI: Body mass index.
First author,year, country Tonometer Sample type Mean IOP during follow-up (P/S) HR 95%CI P Adjustment risk factors Ishida K, 1998,Japan GAT NTG 14.4 mm Hg 1.22 1.01-1.4 0.033 Mean IOP, age, sex, HP, DM, VA, MD, CPSD,DH, BP, IOP parameter, recovery rate, pulse rate,follow-up, optic disc,ametropia, treatment Asrani S, 2000,USA home tonometry OAG 16.4 mm Hg 2.89 1.2-6.97 <0.025 Age, of fice IOP, gender, race, baseline VF damage Bengtsson B,2005, Sweden GAT OHT 22.7 mm Hg 1.13 0.8-1.6 0.49 Mean IOP Badal F, 2005,USA GAT OAG 15.4/14.5 mm Hg 1.1 NA 0.023 Age, sex, intervention sequence, number of intervention, baseline MD Nakagami T,2006, Japan NA NTG 13.2 mm Hg 0.724 0.59-0.888 0.002 Age, refraction, mean IOP, DH, baseline VF damage Bengtsson B,2007, Sweden 19.5/16.5 mm Hg 1 0.81-1.24 0.999 Mean IOP, age, baseline MD (≤-4)/iop (>21), both eyes eligible, exfoliation Lee PP, 2007-1,USA GAT POAG.NTG.XFG 16.5 mm Hg 4.2 1.3-12.9 0.01 Mean IOP, range of IOP, treatment, sex, age,baseline stage, VF stage Lee PP, 2007-1,USA NA POAG.NTG.OHT.GS 16.4 mm Hg 5.5 3.4-9.1 <0.001 Mean IOP, range of IOP, treatment, sex, age,baseline stage, VF stage Medeiros FA,2008, USA NA POAG.NTG.OHT.GS GAT OHT 25.4 mm Hg 1.08 0.79-1.48 0.62 Mean IOP, age, CCT, vertical C/D ratio and PSD Sung KR, 2009,Korea GAT NTG 13.5/13.6 mm Hg 0.672 0.331-1.362 0.2702 Univariate COX analysis Teng CC, 2010,USA 15.5/16.2 mm Hg 1.17 1.02-1.34 0.02 Mean IOP, baseline IOP/MD, CCT, ametropia,Rim area, PPA, PPA area, PPA/disc ratio Hoffmann EM,2014, Germany Applanation tonometer POAG.NTG.XFG.other NA NTG NA 2.03 1.1-3.74 0.02 NA Lee J, 2014-A,Korea GAT NTG 11.8 mm Hg 2.286 0.952-5.492 0.065 Mean IOP, age, sex, ametropia, DM, baseline MD, SBP, DOPP, DH, CCT Lee J, 2014-B,Korea GAT NTG 14.5 mm Hg 0.809 0.198-3.307 0.768 Mean IOP, age, sex, ametropia, DM, DOPP,baseline MD, SBP, DH, CCT Lee J, 2015,Korea GAT NTG 14.7 mm Hg 0.311 0.056-1.717 0.18 Mean IOP, age, sex, baseline IOP, CCT, baseline VFI, DH, adjusted SD of IOP GAT NTG NA 0.87 0.683-1.109 0.26 Age, SE, BMI, baseline MD/PSD, SD of MAP,mean daytime OPP Kim SH, 2016,Korea
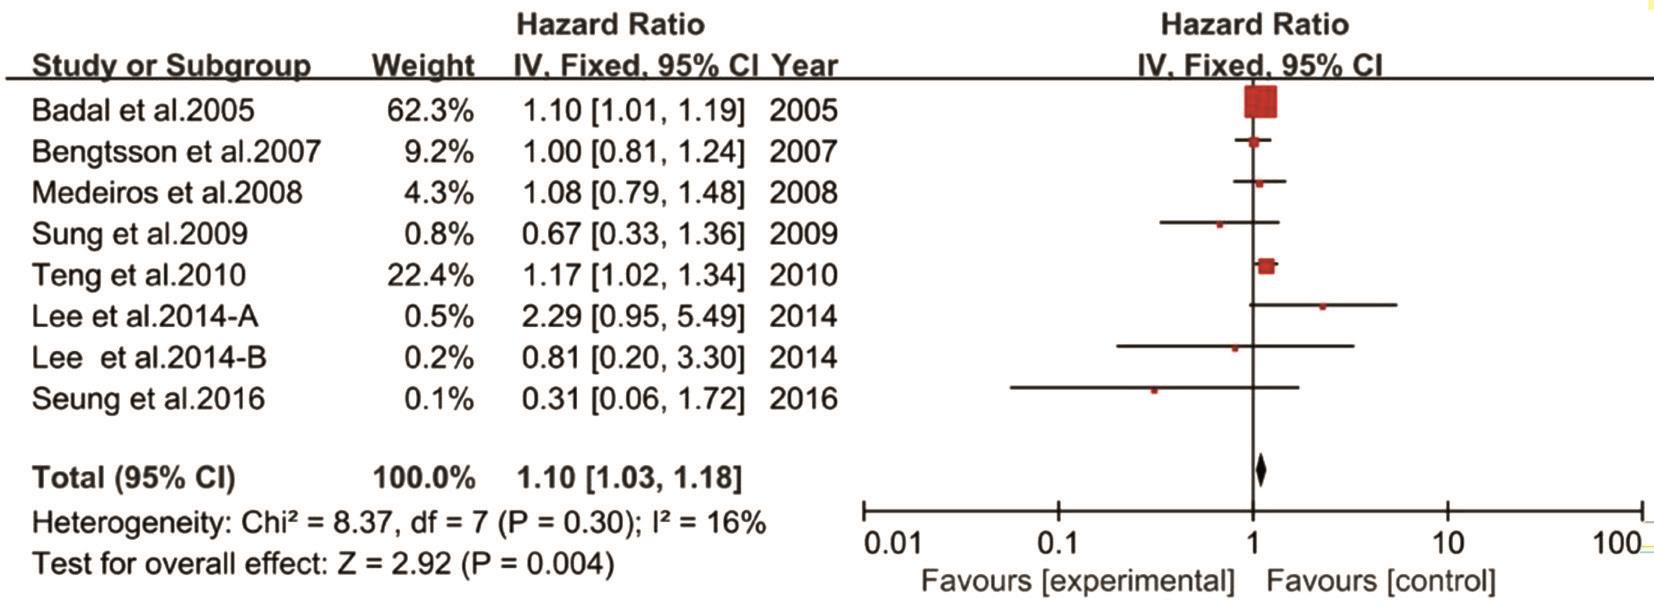
Sensitivity analysis showed that the heterogeneity among the group with regard to long-term IOP fluctuation was mainly contributed by the following three studies (Figure 2). These studies were roughly homogeneous with others, except one study was designed as a cohort study[21], another study collected IOP readings by patients using home tonometry measurements[18], and the other study considered the change of Heidelberg Retina Tomography (HRT) as a glaucoma progression criterion[26]. When omitting these studies, the combined HR was 1.10 (95%CI 1.03-1.18, P=0.004) for longterm IOP fluctuation and glaucoma progression. Furthermore,there was no evidence of heterogeneity (P=0.3, I2=16%).
DISCUSSION
In this study, we conclude that IOP fluctuation is a risk factor for glaucoma progression. The combined HR was 1.10 (95%CI 1.03-1.18) for long-term IOP fluctuation and glaucoma progression. This also indicates that the risk of glaucoma progression increased by 10% for every 1 mm Hg of long-term IOP fluctuation.
What are the mechanisms of IOP fluctuation act on glaucoma progression? One paper indicated that lamina cribrosa (LC)was the initial site of glaucomatous axons damage[30]. LC is composed of capillaries, astrocytes, fibrocytes and extracellular matrix (ECM), which principally contains various collagens,elastins, and proteoglycans. The LC is endowed biomechanical properties with ECM and has been as an IOP-related stress load-bearing tissue[31]. IOP fluctuation relevant to mechanical stress within the sieve pores could be magnified 122 times by the three dimensional geometry detailed as the overlapped lamellar connective tissues in the scleral canal of spherical ocular shell[32]. A long-term oscillation of mechanical stress can enhance fatiguing effects on collagens and elastins. Once the shear, tensile and compressive stress is beyond loadinglimits of fibroelastic tissues, it can cause hypercompliance and permanent deformation to tissues[31]. Meanwhile, the applied stress may activate gliocytes to trigger relevant downstream signaling pathways and result in structural modification of the LC. Proliferative ECM not only makes LC stiffer, but also decreases the efficiency of nutrients delivery from capillaries in LC[33]. Although it’s difficult to explore the exact way of how IOP fluctuation damage on glaucoma from the IOP effect in vivo, according to the established proof above, we can conclude that IOP fluctuation may related to stress effect on LC and its capillaries to further cause injury of retinal ganglion cells (RGCs).In this Meta-analysis, all included literatures were longitudinal studies with the longest mean follow-up period up to 8.5y.When progressed cases occurred during the follow-up time,the intensified treatment regimen was required for lowering the IOP of patients. Once changing the therapeutic schedule,it must lead to alteration of IOP fluctuation outcome. One study in our analysis, which data were derived from the AGIS, calculated IOP fluctuation including the IOP dataset after changing the therapeutic schedule[11]. This may result in a consequent increase of IOP fluctuation and can lead to a non-naturally positive association between IOP fluctuation and glaucoma progression in the AGIS. When the report of AGIS was removed from our analysis, the combined result 1.28 (95%CI 1.04-1.59, P=0.02) was still statistically significant with a slight increase of heterogeneity compared to our previous pooled result (P<0.1). However, the reason of deleting one different calculation of IOP fluctuation from included studies increased the heterogeneity remains unclear.The overall HR was statistically significant with heterogeneity among all observational studies in this Meta-analysis. The present heterogeneity can be interpreted as following aspects.Firstly, the Meta-analysis of observational studies usually is confronted with challenges due to different study designs.Excluding sole cohort study from included studies make heterogeneity (I2 statistic) decline from 81% to 58%. Secondly,various adjusted confounders included in the Cox proportional hazard model are different among the eligible reports. This can effect on the partial regression coefficient of covariant in the Cox model. Nevertheless, most eligible studies adjusted the important variables as mean IOP, age, gender and baseline mean defect (MD). In fact, some limitations may exist in this paper. The possible publication bias was indicated by funnel plot. Although half of the included studies considered IOP fluctuation as a risk factor, we haven’t retrieved those unpublished results. There may subsist possible selection biases among the included studies which had heterogeneous criterion of inclusion and exclusion for each study.
In conclusion, long-term IOP fluctuation is a risk factor for glaucoma progression. When dealing with cases of IOP in clinical practice, both the level of IOP and the smooth IOP fluctuation should be taken into account for slowing down the deterioration of glaucoma. Indeed, the consequence of IOP fluctuation need to be further studied within glaucoma and normal populations. For instance, the threshold of IOP fluctuation that require for medical intervention. Our current findings showed that long-term IOP fluctuation is related to glaucoma deterioration. Thus, it should also be followed in clinic to protect the vision functions of glaucoma patients.
ACKNOWLEDGEMENTS
Foundations: Supported by National Natural Science Foundation of China (No.81200687); Innovative Spark Grant of Sichuan University (No.2018SCUH0062).
Conflicts of Interest: Guo ZZ, None; K Chang K, None;Wei X, None.
REFERENCES
1 Weinreb RN, Khaw PT. Primary open-angle glaucoma. Lancet 2004;363(9422):1711-1720.
2 Quigley HA. Glaucoma. Lancet 2011;377(9774):1367-1377.
3 Nouri-Mahdavi K, Hoffman D, Coleman AL, Liu G, Li G, Gaasterland D, Caprioli J. Predictive factors for glaucomatous visual field progression in the Advanced Glaucoma Intervention Study. Ophthalmology 2004;111(9):1627-1635.
4 Bengtsson B, Leske MC, Hyman L, Heijl A. Fluctuation of intraocular pressure and glaucoma progression in the early manifest glaucoma trial.Ophthalmology 2007;114(2):205-209.
5 Spruance SL, Reid JE, Grace M, Samore M. Hazard ratio in clinical trials. Antimicrob Agents Chemother 2004;48(8):2787-2792.
6 Higgins JPT GSe. Cochrane Handbook for Systematic Reviews of Interventions Version 5.1.0 ed: The Cochrane Collaboration, 2011.Available at: http://handbook-5-1.cochrane.org/.
7 Tierney JF, Stewart LA, Ghersi D, Burdett S, Sydes MR. Practical methods for incorporating summary time-to-event data into meta-analysis.Trials 2007;8:16.
8 Parmar MK, Torri V, Stewart L. Extracting summary statistics to perform meta-analyses of the published literature for survival endpoints.Stat Med 1998;17(24):2815-2834.
9 Sultan MB, Mansberger SL, Lee PP. Understanding the importance of IOP variables in glaucoma: a systematic review. Surv Ophthalmol 2009;54(6):643-662.
10 Tramèr MR, Reynolds DJ, Moore RA, McQuay HJ. Impact of covert duplicate publication on meta-analysis: a case study. BMJ 1997;315(7109):635-640.
11 Badal F, Nouri-Mahdavi K, Caprioli J. Predictive Factors for Glaucoma Progression: evidence for Target Pressure. Iovs 2005; v. 46. Available at: https://iovs.arvojournals.org/article.aspx?articleid=2401916&resultClick=1.
12 Ederer F, Gaasterland DE, Sullivan EK, Investigators A. The Advanced Glaucoma Intervention Study (AGIS): 1. Study design and methods and baseline characteristics of study patients. Control Clin Trials 1994;15(4):299-325.
13 Stang A. Critical evaluation of the Newcastle-Ottawa scale for the assessment of the quality of nonrandomized studies in meta-analyses. Eur J Epidemiol 2010;25(9):603-605.
14 Sanderson S, Tatt ID, Higgins JP. Tools for assessing quality and susceptibility to bias in observational studies in epidemiology: a systematic review and annotated bibliography. Int J Epidemiol 2007;36(3):666-676.
15 Higgins JP, Thompson SG. Quantifying heterogeneity in a metaanalysis. Stat Med 2002;21(11):1539-1558.
16 DerSimonian R, Laird N. Meta-analysis in clinical trials. Control Clin Trials 1986;7(3):177-188.
17 Ishida K, Yamamoto T, Kitazawa Y. Clinical factors associated with progression of normal-tension glaucoma. J Glaucoma 1998;7(6):372-377.
18 Asrani S, Zeimer R, Wilensky J, Gieser D, Vitale S, Lindenmuth K.Large diurnal fluctuations in intraocular pressure are an independent risk factor in patients with glaucoma. J Glaucoma 2000;9(2):134-142.
19 Bengtsson B, Heijl A. Diurnal IOP fluctuation: not an independent risk factor for glaucomatous visual field loss in high-risk ocular hypertension.Graefes Arch Clin Exp Ophthalmol 2005;243(6):513-518.
20 Nakagami T, Yamazaki Y, Hayamizu F. Prognostic factors for progression of visual field damage in patients with normal-tension glaucoma. Jpn J Ophthalmol 2006;50(1):38-43.
21 Lee PP, Walt JW, Rosenblatt LC, Siegartel LR, Stern LS. Association between intraocular pressure variation and glaucoma progression: data from a United States chart review. Am J Ophthalmol 2007;144(6):901-907.e1.
22 Medeiros FA, Weinreb RN, Zangwill LM, Alencar LM, Sample PA,Vasile C, Bowd C. Long-term intraocular pressurefluctuations and risk of conversion from ocular hypertension to glaucoma. Ophthalmology 2008;115(6):934-940.
23 Sung KR, Lee S, Park SB, Choi J, Kim ST, Yun SC, Kang SY, Cho JW, Kook MS. Twenty-four hour ocular perfusion pressure fluctuation and risk of normal-tension glaucoma progression. Invest Ophthalmol Vis Sci 2009;50(11):5266-5274.
24 Teng CC, de Moraes CGV, Prata TS, Tello C, Ritch R, Liebmann JM.B-zone parapapillary atrophy and the velocity of glaucoma progression.Ophthalmology 2010;117(5):909-915.
25 Sung KR, Cho JW, Lee S, Yun SC, Choi J, Na JH, Lee Y, Kook MS.Characteristics of visual field progression in medically treated normaltension glaucoma patients with unstable ocular perfusion pressure. Invest Ophthalmol Vis Sci 2011;52(2):737-743.
26 Hoffmann EM, Koenig J, Contier A, Merz K, Pfeiffer N. The role of short-term and long-term intraocular pressure fluctuation on the development and progression of glaucoma: Investigative Ophthalmology and Visual Science. Conference: 2014 Annual Meeting of the Association for Research in Vision and Ophthalmology, ARVO 2014. United States.55 (13): 2014. Date of Publication: April 2014. Available at: https://iovs.arvojournals.org/article.aspx?articleid=2272525&resultClick=1.
27 Lee J, Kong MG, Kim J, Kee C. Comparison of visual field progression between relatively low and high intraocular pressure groups in normal tension glaucoma patients. J Glaucoma 2014;23(8):553-560.
28 Lee J, Choi J, Jeong D, Kim S, Kook MS. Relationship between daytime variability of blood pressure or ocular perfusion pressure and glaucomatous visual field progression. Am J Ophthalmol 2015;160(3):522-537.e1.
29 Kim SH, Lee EJ, Han JC, Sohn SW, Rhee T, Kee C. The effect of diurnal fluctuation in intraocular pressure on the evaluation of risk factors of progression in normal tension glaucoma. PLoS One 2016;11(10):e0164876.
30 Quigley HA, Addicks EM, Green WR, Maumenee AE. Optic nerve damage in human glaucoma. II. The site of injury and susceptibility to damage. Arch Ophthalmol 1981;99(4):635-649.
31 Burgoyne CF, Crawford Downs J, Bellezza AJ, Francis Suh JK,Hart RT. The optic nerve head as a biomechanical structure: a new paradigm for understanding the role of IOP-related stress and strain in the pathophysiology of glaucomatous optic nerve head damage. Prog Retin Eye Res 2005;24(1):39-73.
32 Bellezza AJ, Hart RT, Burgoyne CF. The optic nerve head as a biomechanical structure: initial finite element modeling. Invest Ophthalmol Vis Sci 2000;41(10):2991-3000.
33 Tamm ER, Ethier CR. Lasker/IRRF Initiative on Astrocytes and Glaucomatous Neurodegeneration Participants. Biological aspects of axonal damage in glaucoma: a brief review. Exp Eye Res 2017;157:5-12.
Citation: Guo ZZ, K Chang K, Wei X. Intraocular pressure fluctuation and the risk of glaucomatous damage deterioration: a Meta-analysis. Int J Ophthalmol 2019;12(1):123-128
DOl:10.18240/ijo.2019.01.19
● KEYWORDS: intraocular pressure fluctuation; glaucoma;visual field progression
Received: 2018-08-19 Accepted: 2018-09-19
Correspondence to: Xin Wei. Department of Ophthalmology,West China Hospital, Sichuan University, Chengdu 610041,Sichuan Province, China. weixin_1982@163.com
Co- first authors: Zhen-Zhen Guo and Karen Chang