
Citation: Guo XX, You R, Li SS, Yang XF, Zhao L, Zhang F, Wang YL,
Chen X. Comparison of ocular parameters of two biometric measurement devices in
highly myopic eyes. Int J Ophthalmol 2019;12(10):1548-1554. DOI:10.18240/ijo.2019.10.05
・Clinical
Research・
Comparison
of ocular parameters of two biometric measurement devices in highly myopic eyes
Xiao-Xiao Guo, Ran You, Shan-Shan Li, Xiu-Fen Yang, Lu
Zhao, Fan Zhang, Yan-Ling Wang, Xi Chen
Department
of Ophthalmology, Beijing Friendship Hospital, Capital Medical University,
Beijing 100050, China
Correspondence
to: Yan-Ling
Wang and Xi Chen. Department of Ophthalmology, Beijing Friendship Hospital,
Capital Medical University, 95 Yong-an Rd, Beijing 100050, China. wangyanling999@vip.sina.com;
tencycx@hotmail.com
Received:
Abstract
AIM: To compare the differences and agreement of ocular biometric parameters
in highly myopic eyes obtained by optical biometric measurement instruments,
the OA-2000 and IOLMaster 500.
METHODS: Totally, 90 patients (90 eyes) were included. They
were divided into high myopia group and control group. Ocular parameters,
including axial length (AL), mean keratometry (Km), anterior chamber depth
(ACD), and white to white (WTW), were obtained from the OA-2000 and IOLMaster
500.
RESULTS: For the control group, we applied Bland-Altman
graphs to assess the 95% limits of agreement (LoA) for most parameters
including AL, ACD, Km, and WTW (-0.24 to
CONCLUSION: Most parameters obtained by the OA-2000 and
IOLMaster 500 are comparable, including the AL, ACD, and K values. Among them,
the agreement of the high myopia patients is poor compared to the patients
without high myopia.
KEYWORDS: high myopia; optical biometric
measurement; agreement; difference
DOI:10.18240/ijo.2019.10.05
Citation:
Guo XX, You R, Li SS, Yang XF, Zhao L, Zhang F, Wang YL, Chen X. Comparison of
ocular parameters of two biometric measurement devices in highly myopic eyes. Int
J Ophthalmol
2019;12(10):1548-1554
INTRODUCTION
With
improvements in the medical level of ophthalmology and the resulting quality of
life, people’s demand for vision is not limited to the improvement of visual
acuity but also includes the improvement of visual quality[1]. Intraocular lens (IOL)
implantation is an essential procedure for cataracts surgery, which depends on
the accuracy of ocular biometry to get the ideal postoperative refractive
outcomes[1-3]. Optical biometry
has been well accepted as the gold standard since the introduction of the
IOLMaster (Zeiss, Germany) optical biometer in 1999[4-5], which is based on partial coherence interferometry
(PCI) measurements with a laser wavelength of 780 nm[6-7]. As the severity of a cataract increases, the accuracy
of IOLMaster 500 measurements gradually decreases. For serious cataracts, such
as posterior capsule cataract (P>3.5), hypermature cataract, and
leukoplakia, vitreous hemorrhage IOLMaster 500 measurement cannot be performed.
To improve the accuracy of the biometric parameters of the eyeball, different
eye biometric instruments have emerged. The OA-2000 (Tomey, Japan) is a newly
introduced optical biometer based on swept-source optical coherence tomography
(SS-OCT) and uses a longer wavelength of approximately 820 nm[8]. For corneal curvature using a
Placido disc-based topography technique, the keratometry (K) value, axial
length (AL), anterior chamber depth (ACD), and white to white (WTW) parameters
can be obtained by one measurement. This will accordingly reduce the error
caused by multiple focus eye movement.
Currently,
several studies have compared the biometrics of the OA-2000 with those of the
IOLMaster 500, focusing mainly on healthy eyes or cataract patients[9-12]. However, there have been few
reports that have explored the difference or agreement in obtained results
between the OA-2000 and IOLMaster
SUBJECTS AND METHODS
Ethical
Approval The study protocol was approved by
the Office of Research Ethics Committee at Beijing Friendship Hospital
Affiliated to Capital Medical University (2018-P
Patients This prospective study enrolled 90
subjects (90 eyes, 45 with high myopia) at Beijing Friendship Hospital of
Capital Medical University, aged 25 to 60 (47.96±10.17)y. High myopia was here
defined as spherical equivalent (SE) ≤-6.0 diopters (D), and/or AL≥
Inclusion
Criteria 1) No history of glaucoma, keratopathy,
uveitis, or ocular trauma; 2) No history of other refractive surgery; 3) No use
of rigid contact lenses within the 4wk immediately prior to the experiment and
no use of soft contact lenses within the 2wk immediately prior to the
experiment; 4) Intraocular pressure (IOP) within the range of 10
Exclusion
Criteria 1) Corneal disease (e.g., corneal
leukoplakia, corneal astigmatism more than 3.0 D or keratoconus); 2) Ocular
inflammation; 3) Severe dry eye; 4) History of eye trauma; 5) Patient
uncooperative or with poor fixation (e.g., vitreous opacity, maculopathy
or retinal detachment with poor vision).
Instruments
and Measurement Protocol Some characteristics of two
instruments are given in Table 1.
Table 1
Characteristics of the OA-2000 and IOLMaster 500
|
Instruments |
Wavelength |
Topographic pattern |
Central corneal zone |
Advantage |
|
OA-2000 |
820 nm |
Placido disc-based topography
techniques; 9 rings each 256 points |
|
Stronger penetration and better
stability than IOLMaster 500 |
|
IOLMaster 500 |
780 nm |
6 points of light from the tear
film surface at a hexagonal pattern |
|
|
All
participants underwent a comprehensive ophthalmic examination, including
refractometry, best corrected visual acuity (BCVA) and IOP. Parameters were
obtained with the same machine of OA-2000 and IOLMaster 500 (Carl Zeiss,
Germany), which were operated by an optometrist who was skilled in the use of
both devices.
IOLMaster
500 measurement method All the subjects were asked
place their chin on the instrument’s jaw support apparatus. The examinee looked
at the visual mark in the instrument, and the examiner manually measured after
focusing. The examiner manually measured the AL 5 times and K, ACD, and WTW 3
times, and then these values were averaged.
OA-2000
measurement method All subjects were requested to
sit with their foreheads against the headrest, and the chin was placed on the
mandible tray of the instrument to adjust the apparatus to the height of the
patient’s eye. The examinee looked at the red light on the measurement window.
The eyes widened and the cornea was fully exposed. The examinee followed the
computer screen to focus, the AL, K value, ACD, and WTW were automatically
measured, and then averaged after 3 times. Measurements were successfully
obtained from all patients.
Statistical
analysis Data were analyzed by SPSS software
(version 22.0; IBM Corporation, USA) and MedCalc statistical software (version
15.8, MedCalc Software Inc., Belgium). A P value of less than 0.05 was
considered as statistical significance. The Kolmogorov-Smirnov test was applied
to verify whether the data were normally distributed. If this was confirmed,
then paired t-tests were used to evaluate the differences in parameters
between two devices. If the measurement data did not meet the normal
distribution, then the rank sum test was used to analyze the differences. Bland-Altman
plots were used to assess the agreement between OA-2000 and IOLMaster 500[14]. The 95% limits
of agreement (LoA) was expressed as the mean difference±1.96 the standard
deviation (SD) of the difference, referring to an interval within which 95% of
the differences between measurements were expected to lie[15]. In Bland-Altman plots, the
solid line indicates the mean difference. The interval between the upper and
lower lines represents the 95% LoA. Pearson’s correlation was used to determine
relationships between IOLMaster 500 and OA-2000.
RESULTS
Ninety eyes
from 90 patients (57 women, 33 men), with a mean age of 47.96±10.17y (range: 25
to 60y), were enrolled. The patient characteristics are summarized in Table 2.
Table 3 shows the mean and SD values of the parameters for the high myopia
group and the control group obtained by the OA-2000 and IOLMaster 500. We found
that the AL, ACD, and K showed excellent correlations for two groups; however,
there was a weak correlation between the two devices with respect to the WTW
diameter (r=0.684 and 0.415, respectively). Differences were not
statistically significant between two devices in Table 4. Table 5 shows that
different formulas were used to calculate the IOL power of the two groups, with
no statistical difference (P>0.05).
Table 2
Characteristics of the high myopia group and the control group
|
Characteristics |
High myopia |
Control |
P |
|
No. of eyes |
45 |
45 |
- |
|
Sex (M:F) |
19:26 |
14:31 |
- |
|
Age, y |
48.42±10.77 |
47.49±9.63 |
0.480 |
|
IOP, mm Hg |
16.00±3.86 |
16.18±2.03 |
0.691 |
|
BCVA, logMAR |
0.22±0.41 |
0.01±0.33 |
0.011 |
|
SE, D |
-9.79±3.86 |
-1.42±2.18 |
<0.001 |
IOP:
Intraocular pressure; BCVA: Best corrected visual acuity; SE: Spherical
equivalent.
Table 3
Comparison of ocular parameters in the high myopia group and the control group
as measured using the OA-2000 and IOLMaster 500
mean±SD
|
Parameters |
High myopia |
Control |
||||||
|
OA-2000 |
IOLMaster 500 |
P |
r |
OA-2000 |
IOLMaster 500 |
P |
r |
|
|
AL (mm) |
27.84±1.32 |
27.85±1.30 |
0.971 |
0.991 |
23.49±1.29 |
23.47±1.30 |
0.934 |
0.995 |
|
ACD (mm) |
3.51±0.38 |
3.52±0.34 |
0.902 |
0.877 |
3.00±0.33 |
2.89±0.36 |
0.122 |
0.875 |
|
Km (D) |
44.41±1.62 |
44.46±1.63 |
0.881 |
0.983 |
44.61±1.60 |
44.64±1.66 |
0.921 |
0.995 |
|
WTW (mm) |
11.48±0.51 |
11.55±0.36 |
0.501 |
0.684 |
11.37±0.46 |
11.39±0.35 |
0.853 |
0.415 |
AL: Axial
length; ACD: Anterior chamber depth; Km: Mean keratometry; WTW: White to white;
SD: Standard deviation.
Table 4
Difference in biometric measurements of all patients between the OA-2000 and
IOLMaster 500
|
Parameters |
AL |
ACD |
Km |
WTW |
||||||||
|
All patients |
High myopia |
Control |
All patients |
High myopia |
Control |
All patients |
High myopia |
Control |
All patients |
High myopia |
Control |
|
|
Mean difference±SD |
0.01±0.14 |
-0.01±0.17 |
0.02±0.13 |
0.05±0.19 |
-0.01±0.19 |
0.11±0.17 |
-0.04±0.21 |
-0.05±0.26 |
-0.04±0.18 |
-0.04±0.43 |
-0.06±0.37 |
-0.02±0.45 |
|
t |
0.82 |
-0.19 |
0.09 |
-3.28 |
-0.30 |
4.44 |
-1.59 |
-0.88 |
-1.35 |
-0.88 |
-1.41 |
-0.24 |
|
P |
0.675 |
0.926 |
0.900 |
0.459 |
0.617 |
0.118 |
0.053 |
0.884 |
0.917 |
0.358 |
0.997 |
0.852 |
|
95% LoA |
-0.30, 0.32 |
-0.34, 0.32 |
-0.24, 0.29 |
-0.31, 0.42 |
-0.36, 0.34 |
-0.22, 0.45 |
-0.46, 0.37 |
-0.57, 0.47 |
-0.39, 0.31 |
-0.85, 0.77 |
-0.80, 0.68 |
-0.90, 0.86 |
AL: Axial
length; ACD: Anterior chamber depth; Km: Mean keratometry; WTW: White to white;
SD: Standard deviation; LoA: Limits of agreement.
Table 5 Differences in biometric
measurements between the OA-2000 and IOLMaster 500 for power calculation of
intraocular lens in the high myopia group and the control group
|
Parameters |
Mean difference±SD |
t |
P |
95% LoA |
|
≥ |
0.00±0.67 |
0.00 |
1.00 |
-1.25, 1.26 |
|
< |
-0.06±0.49 |
-0.45 |
0.651 |
-1.02, 0.91 |
SD: Standard
deviation; LoA: Limits of agreement.
The 95% LoA
obtained by the two instruments for AL, Km, WTW, and ACD ranged from -0.30 to
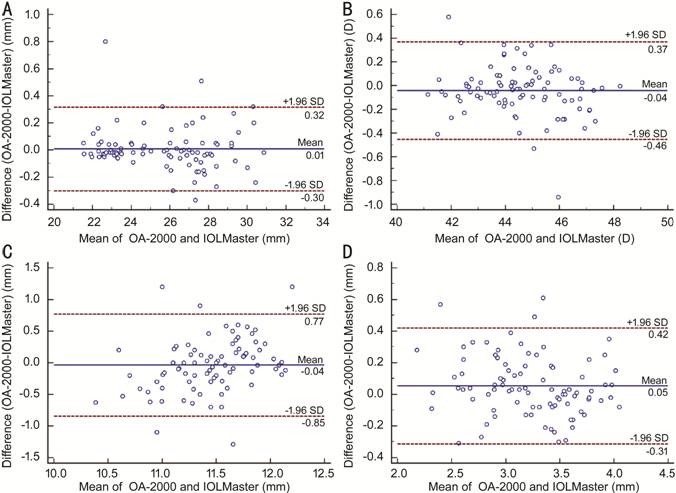
Figure 1 Bland-Altman plots present the
mean plotted against the differences in values for AL (A), Km (B), WTW (C), and
ACD (D) for a comparison between the OA-2000 biometer and IOLMaster
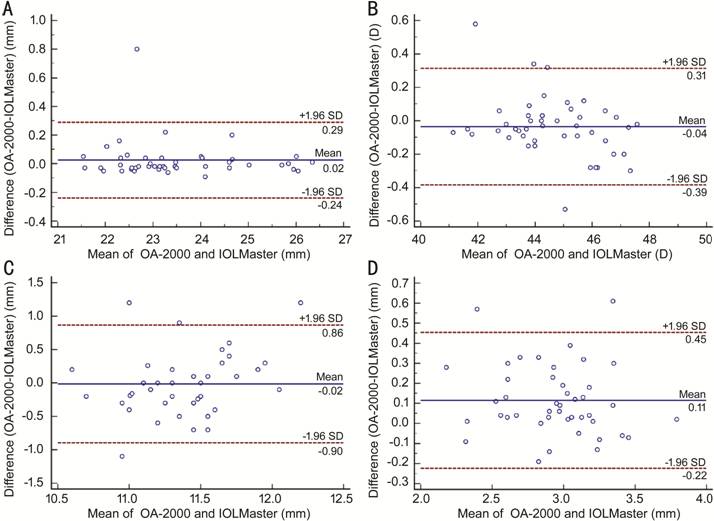
Figure 2 Bland-Altman plots present the
mean plotted against the differences in values for AL (A), Km (B), WTW (C), and
ACD (D) for a comparison between the OA-2000 and IOLMaster
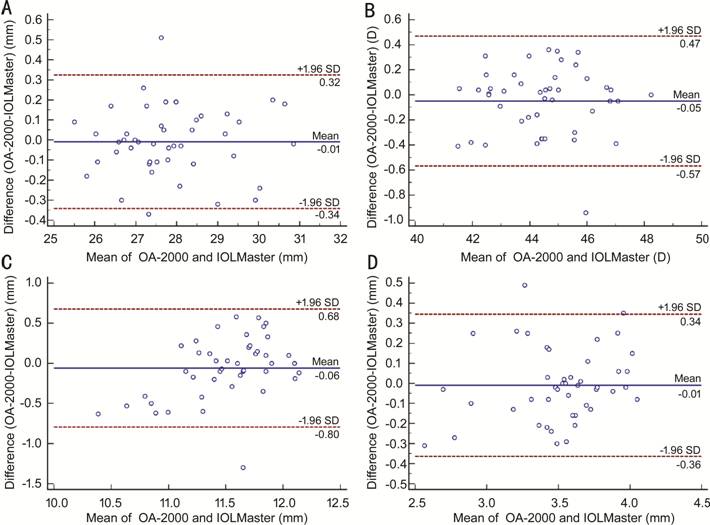
Figure 3 Bland-Altman plots present the
mean plotted against the differences in values for AL (A), Km (B), WTW (C), and
ACD (D) for a comparison between the OA-2000 and IOLMaster
The
third-generation formula Holladay1 was used for the high-myopia group, and the
95% LoA range was (-1.25, 1.26) D. The SRK/T formula was used for the control
group, with a 95% LOA range from -1.02 to 0.91 D (Figure 4).
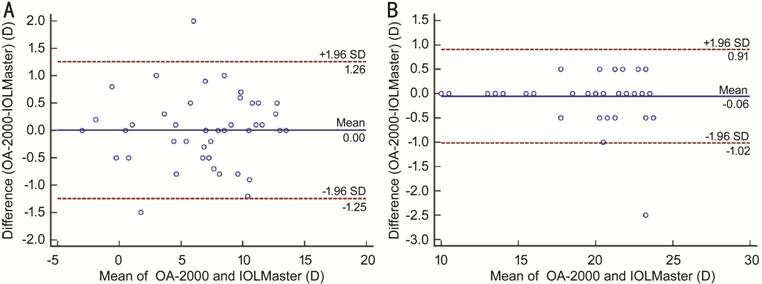
Figure 4 Bland-Altman plots present the
mean plotted against the differences for power calculation of intraocular lens
in the high myopia group (A) and the control group (B) by the OA-2000 and
IOLMaster 500.
DISCUSSION
Precise
biometric data are essential for ideal outcomes after cataract surgery[3]. Several previous
studies are available that compare the OA-2000 with the IOLMaster, Lenstar, and
other biometric instruments[10-12,16-19]. For example, Hua et al[12] showed that the mean difference
in AL for 108 normal subjects measured with the OA-2000 and IOLMaster was
Here, the
parameters obtained by the OA-2000 and IOLMaster 500 were compared. The mean
differences in all cases for AL, Km, WTW, and ACD were 0.01±
The
difference in the obtained AL values between the two devices of our study was
rather small (on average 0.01±
The ACD
measurement of the OA-2000 was
The OA-2000
biometer applies Placido disc-based topography techniques to measure the
corneal curvature, while the IOLMaster 500 uses 6 points of light from the tear
film surface at a hexagonal pattern[28-29].
Here, the data was collected from the 2.5-mm zone and found that all
keratometry values obtained by the OA-2000 were significantly lower than those obtained
by the IOLMaster 500 (0.05 D, 0.04 D, respectively) in patients with either
high myopia or not. This is consistent with the findings of Kongsap[9], who found that the
K value measured by the OA-2000 was lower (0.11 D). At the same time, we also
found that there is less consistency in the high myopia patients as compared to
the control group. It is known that a difference of 1.0 D in K values leads to
a difference of approximately 1.4 D in the IOL power prediction[30-31]. Therefore, a difference of
approximately 0.05 D in the K value would result in a difference of 0.07 D in
the IOL power prediction, which can be considered that this is clinically
negligible.
The
agreement of WTW values was not always optimal in previous studies, and the
repeatability and reproducibility were relatively low for the AL-Scan,
IOLMaster, Aladdin, and Lenstar[18-19,32]. Wang et al[33] reported on the
reproducibility and reproduction of the OA-2000 and found that they were
relatively poor for WTW and lens thickness. Kongsap et al[9] found that the
agreement was relatively good between the analyzed OA-2000 and IOLMaster 500,
except that the WTW value had a wide 95% LoA (-1.85,
According to
the different AL values, the IOL power was calculated by adopting different
formulas. The IOL of the high myopia group was calculated using the
third-generation formula Holladay1; the SRK/T formula was used for the control
myopia group. The results of the high myopia group showed that the 95% LoA was
wider than the control group (-1.25 to 1.26 D, -1.02 to 0.91 D, respectively).
In summary,
most parameters were comparable between the two devices, including AL, ACD, and
K values. Among them, the agreement of the high myopia group was poor as
compared to the control group.
ACKNOWLEDGEMENTS
The datasets
from the current study are available from the corresponding author on
reasonable request.
Authors’
contributions: Guo XX, You
R, Li SS, Yang XF, Zhao L and Zhang F contributed to the data collection and
statistical expertise. Guo XX, You R, Wang YL and Chen X analyzed the data. Guo
XX, Wang YL, and Chen X designed the project. Guo XX and Chen X prepared the
manuscript. All authors read and approved the final manuscript.
Foundations:
Supported by
the National Natural Science Foundation of China (No.81870686); Beijing
Municipal Natural Science Foundation (No.7184201); Capital’s Funds for Health
Improvement and Research (No.2018-1-2021). The sponsor or funding organization
had no role in the design or conduct of this research.
Conflicts of
Interest: Guo XX, None; You R, None; Li SS, None; Yang XF, None; Zhao
L, None; Zhang F, None; Wang
YL, None; Chen X, None.
REFERENCES