
Citation: Chu MF, Hui N, Wang CY, Yu L, Ma B, Li Y, Pei C. Early
outcomes of vision and objective visual quality analysis after cataract surgery
with trifocal intraocular lens implantation. Int J Ophthalmol
2019;12(10):1575-1581. DOI:10.18240/ijo.2019.10.09
・Clinical Research・
Early
outcomes of vision and objective visual quality analysis after cataract surgery
with trifocal intraocular lens implantation
Mei-Fang Chu1, Na Hui1, Cong-Yi
Wang1, Lei Yu1, Bo Ma1, Yan Li1,
Cheng Pei2
1Ophthalmology Department, Xi’an
Fourth Hospital, Shaanxi Ophthalmological Hospital, Xi’an 710004, Shaanxi
Province, China
2Ophthalmology Department, First
Affiliated Hospital of Xi’an Jiaotong University, Xi’an 710061, Shaanxi
Province, China
Correspondence to: Cheng Pei. Ophthalmology Department
of First Affiliated Hospital of Xi’an Jiaotong University, No.277, West Yanta
Street, Xi’an 710061, Shaanxi Province, China.peich71@163.com.
Received:
Abstract
AIM: To investigate the early outcomes of vision, objective visual quality
and their correlation after cataract surgery with trifocal intraocular lens
implantation.
METHODS: The visual examination and objective visual quality
analysis using Optical Quality Analysis System (OQAS) at 1mo and 3mo, and
defocus curve examination at 3mo were performed in 20 patients (27 eyes) after
phacoemulsification combined with trifocal intraocular lens implantation
surgery.
RESULTS: The uncorrected distant (UD), intermediate and near
visual acuity (VA) were significantly improved after surgery (P<0.001).
UDVA at 1mo after the surgery was slightly better than that after 3mo (P=0.026).
The defocus curve after 3mo indicated that the peak of distant vision was close
to 0 logMAR, and UDVA was lower than 0.3 logMAR in the range of -1.5 D to -3.0
D. The modulation transfer function (MTF) cutoff frequency, strehl ratio (SR),
Optical Quality Analysis System values (OVs), includes OV100, OV20 and OV9
after the surgery were significantly better than before surgery (P<0.001),
but the objective scattering index (OSI) was significantly decreased (P<0.001).
UDVA at 3mo after the surgery had correlations with MTF cutoff, OSI, OV100 and
OV20 (r=-0.400, 0.431, -0.437, -0.411, P=0.039, 0.025, 0.023,
0.033). The uncorrected intermediate VA after 3mo of the surgery had
correlations with OSI and OV100 (r=0.478, -0.411, P=0.012,
0.033).
CONCLUSION: Trifocal intraocular lens implantation can provide
good distant, intermediate and near VA, and the vision shows a well correlation
with objective visual quality during early surgery.
KEYWORDS: visual quality; trifocal intraocular
lens; vision; correlation
DOI:10.18240/ijo.2019.10.09
Citation: Chu
MF, Hui N, Wang CY, Yu L, Ma B, Li Y, Pei C. Early outcomes of vision and
objective visual quality analysis after cataract surgery with trifocal
intraocular lens implantation. Int J Ophthalmol 2019;12(10):1575-1581
INTRODUCTION
Cataract is a globally widespread
blinding eye disease. Phacoemulsification combined with intraocular lens
implantation is regarded as a milestone in cataract surgery development. The
acclimatization with traditional monofocal intraocular lens is limited, and the
patients require the help of glasses to correct good near vision. The internet
and the availability of smartphones have greatly influenced the reading habit
of old people. The requirements for near or intermediate-distance reading and
the demands of reading without presbyopic glasses are higher among old people.
How to accomplish clear distant and near vision in cataract patients without
glasses after the surgery is a challenge for the doctors. Previously,
implantation of multifocal intraocular lens or accommodative intraocular lens
were practiced. Implantation of multifocal intraocular lens which can
distribute parallel light into two or more focuses, has caused substantial
associated problems, such as decreased contrast sensitivity and night glare.
Meanwhile, as the light is mainly distributed to the distant and near foci, the
intermediate visual acuity was not satisfactorily achieved. Based on the
operating principle, the accommodative intraocular lens was designed to create
the accommodation effect through the shift of optics, but the amplitude of
accommodation was very limited. Moreover, the capsular fibrosis may limit the
movement of optics over time after the surgery, which could further reduce the
accommodation effect. Hopefully, with these existing circumstances, a new-type
intraocular lens could provide good distant, intermediate, and near visual
acuity and overcome these problems such as decreased contrast sensitivity,
night glare, and small amplitude of accommodation. Thus, trifocal intraocular
lens has attracted more attention because it could successfully resolve the
above problems to a certain degree. Besides, it was reported with high
spectacle independent rate and patient satisfaction[1-2].
Vision examination and contrast
sensitivity evaluation are subjective, which could not comprehensively and
objectively indicate the visual quality after intraocular lens surgery.
Wavefront aberrometer is a commonly used clinical device to objectively
evaluate the optical quality of human eye. The aberrometer indirectly deduces
spread function by directly measuring wavefront aberration of a finite number
of point light source, and analyzes the optical quality parameters. However, it
neglects the influence of intraocular scattering on imaging with fewer indices.
Optical quality analysis system (OQAS) is based on the dual channel technique,
and directly obtains point spread function measuring all the refractive media
in the path of light. Moreover, OQAS significantly indicate the retinal imaging
quality under the co-effects of aberration and intraocular scattering with
comprehensive detection indices. Therefore, it can accurately reflect the
optical quality of human eyes[3], which has been
applied in evaluating the visual quality after implantation of monofocal
non-spherical intraocular lens, Toric intraocular lens, and multifocal
intraocular lens. Currently, there has been no report on the objective visual
quality analysis after trifocal intraocular lens implantation.
In this study, we observed the early
outcomes of distant, intermediate and near visual acuity after trifocal
intraocular lens implantation, and used OQAS to evaluate the indices of
objective visual quality. Furthermore, we first analyzed the correlations among
them, which could provide convincing theoretical basis for its successful
clinical application.
SUBJECTS AND METHODS
Ethical Approval
The study followed the Declaration
of Helsinki and was approved by the Ethics Committee. Each patient had signed
the informed consent.
Patients Totally 20 patients (27 eyes)
receiving phacoemulsification combined with intraocular lens implantation
between Jul. 2016 and Dec. 2017 were enrolled. Inclusion criteria: 1) cataract
patients, including age-related cataract and complicated cataract without
fundus disease; 2) corneal astigmatism ≤1.25 D (estimated postoperative corneal
cylinder of ≤0.75 D based on the estimation of the surgically induced
astigmatism by the clear corneal incisions); 3) ocular axis <
Surgical Technique All the surgeries were performed by
the same experienced surgeon using the phacoemulsification machine (Bausch
& Lomb Stellaris). The parameters were set as follows: ultrasound energy
upper limit 30%, vaccum
Intraocular Lens There are 3 trifocal intraocular
lens widely applied in clinic[4]: 1) FineVision
(Physiol, Liège, Belgium) with +3.5 D and +1.75 D, 2) Acrysof IQ PanOptix
(Alcon Laboratories, USA) with +3.25 D and +2.17 D; 3) AT LISA Tri 839MP (Carl
Zeiss Meditec AG, Germany) with +3.33 D and +1.66 D. The first two are not yet
available in China. AT Lisa tri 839MP is designed as one-piece
diffractive-refractive multi-focus, composed of hydrophilic acrylate with a
water content of 25%, and covered with a hydrophobic surface. The length of
intraocular lens is
Examination Protocol All the patients received
preoperative cataract examination before the surgery, including uncorrected
distance visual acuity (UDVA) by standard logarithmic visual acuity chart;
uncorrected intermediate visual acuity (UIVA) at
Statistical Method SPSS 23.0 software (USA) was used to
analyze the data. Measurement data were expressed as mean±SD. All the data were
tested by normality test and homogeneity test of variance. The comparison of
the data in each time point was analyzed by repeated ANOVA. Spearman
correlation coefficient was used to analyze the correlations of distant,
intermediate and near visual acuity with objective visual quality at 3mo after
the surgery. P<0.05 was termed as statistically significant.
ResultS
General Information A total of 20 patients (27 eyes)
were enrolled: 13 males and 7 females. The age range was 30-66 years old, and
the average age was 51.9±9.53y. Ocular axis was 21.85
Vision Comparison Before and After
Surgery UDVA, UIVA and UNVA of the 27 eyes
at 1mo and 3mo after the surgery were significantly improved compared with
those before the surgery (P<0.05). UDVA at 1mo after the surgery was
slightly better than that at 3mo (P<0.05), as shown in Table 1.
Table 1 Comparison of vision at
different time point before and after trifocal intraocular lens
implantation n=27, logMAR
|
Parameters |
UDVA |
UIVA |
UNVA |
|
Preoperative |
0.83±0.41 |
0.72±0.36 |
0.63±0.21 |
|
1mo |
0.01±0.11 |
0.12±0.15 |
0.15±0.14 |
|
3mo |
0.04±0.10b |
0.11±0.13 |
0.11±0.11 |
|
F |
|
|
|
|
P1 |
<0.001 |
<0.001 |
<0.001 |
|
P2 |
<0.001 |
<0.001 |
<0.001 |
aComparison within group was
statistically significant (P<0.05); bUDVA has statistical
significance between 3mo and 1mo after the surgery (P<0.05). F:
Value of significant difference within visual acuity in different time; P1:
Comparison between 1mo after the surgery and before the surgery; P2:
Comparison between 3mo after the surgery and before the surgery; UDVA:
Uncorrected distance visual acuity; UIVA: Uncorrected intermediate visual
acuity; UNVA: Uncorrected near visual acuity.
Visual Percentage After Surgery The percentages of UDVA, UIVA and
UNVA greater than or equal to logMAR 0.3 at 1mo after the surgery were 100%,
89% and 93%, respectively. The percentages of UDVA, UIVA and UNVA greater than
or equal to logMAR 0.3 at 3mo after the surgery were 100%, 93% and 100%,
respectively, as shown in Figure 1.

Figure 1 Cumulative percentage of
UDVA, UIVA, UNVA at 1mo (A) and 3mo (B) after the surgery.
Postoperative Defocus Curve Defocus curve had two vision peaks
at 0 and -2.5 D at 3mo after the surgery, and the corresponding logMAR vision
was -0.07±0.097 and 0.15±0.13, representing the best corrected distance visual
acuity and near visual acuity, respectively. Between -1 to -2.5 D, the defocus
curve is lower than logMAR0.3 and is smooth, as shown in Figure 2.

Figure 2 Defocus curve at 3mo after
trifocal intraocular lens implantation.
Postoperative Objective Visual
Quality The MTF, SR, OV100, OV20 and OV9 at
1mo and 3mo after surgery were significantly increased compared with before
surgery. OSR was significantly reduced compared with before surgery (P<0.001).
There was no statistical significance in objective visual quality analysis
between 1mo and 3mo after the surgery (P>0.05) as shown in Table 2.
Table 2 Comparison of objective
visual quality at different time point before and after trifocal intraocular
lens implantation n=27
|
Parameters |
MTF cutoff |
OSR |
SR |
OV100 |
OV20 |
OV9 |
|
Preoperative |
5.10±3.55 |
8.9±3.33 |
0.051±0.019 |
0.18±0.11 |
0.12±0.088 |
0.081±0.062 |
|
1mo |
34.77±13.20 |
1.62±0.90 |
0.20±0.095 |
1.14±0.43 |
0.84±0.41 |
0.58±0.32 |
|
3mo |
37.05±11.26 |
1.50±0.72 |
0.23±0.21 |
1.19±0.34 |
0.88±0.35 |
0.57±0.31 |
|
F |
|
|
|
|
|
|
|
P1 |
<0.001 |
<0.001 |
<0.001 |
<0.001 |
<0.001 |
<0.001 |
|
P2 |
<0.001 |
<0.001 |
<0.001 |
<0.001 |
<0.001 |
<0.001 |
aComparison within group was statistically
significant (P<0.05); F: Value of significant difference
within OQAS in different time; P1: Comparison between 1mo
after and before surgery; P2: Comparison between 3mo after
and before surgery. MTF cutoff: Modulation transfer function cutoff frequency;
OSI: Object scatter index; SR: Strehl ratio; OV100, OV20, OV9: OQAS values.
Correlation Analysis The UDVA after 3mo of surgery had
correlations with MTF cutoff, OSI, OV100 and OV20 (r= -0.400, 0.431,
-0.437, -0.411, P=0.039, 0.025, 0.023, 0.033). UIVA had correlations
with OSI and OV100 (r=0.478, -0.411, P=0.012, 0.033). UNVA had no
significant correlation with their corresponding index of objective visual
quality (P>0.05), as shown in Figures 3 and 4.
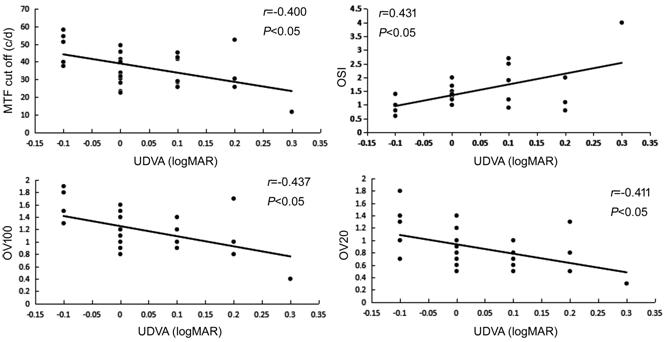
Figure 3 Scatter diagram of UDVA
with MTF cutoff, OSI, OV100 and OV20 at 3mo after the surgery.
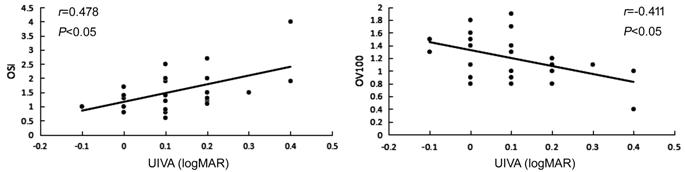
Figure 4 Scatter diagram of UIVA
with OSI and OV100 at 3mo after the surgery.
Discussion
In this study, we have reported that
the trifocal intraocular lens provided good visual acuity at far, intermediate,
and near distance. The UDVA, UIVA and UNVA at 3mo postoperatively were 0.04
logMAR±0.10, 0.11 logMAR±0.13 and 0.11 logMAR±0.11, respectively. Kohnen et
al[6] and Kretz et al[7]
observed binocular uncorrelated visual outcomes of 27 patients (54 eyes) and 38
patients (76 eyes) respectively at far, intermediate, and near distance after
intraocular lens implantation, and all of them reached 0.1 logMAR or better.
Bilbao-Calabuig et al[8] followed up 2141
patients receiving trifocal intraocular lens implantation (4282 eyes) for more
than 3mo. UDVA, UIVA and UNVA was -0.01 logMAR±0.06, -0.05 logMAR±0.14 and 0.05
logMAR±0.08, respectively. Many studies have reported data focusing on the
binocular vision after trifocal intraocular lens implantation. Due to the
limitation of this condition in this study, we could only observe the monocular
vision after the implantation. By comparison of 50 binocular and monocular
vision of patients (100 eyes) implanted with trifocal intraocular lens, Kretz et
al[9] found that the binocular uncorrelated
visions at different distances was better than that of monocular vision in
patients implanted with a diffractive trifocal intraocular lens. We also have
found that uncorrelated distance visual acuity at 1mo after the surgery was slightly
better than that at 3mo. Mojzis et al[10]
found that binocular uncorrelated distance visual acuity at 1mo after trifocal
intraocular lens implantation was better than that at 3mo, which was in line
with our study. Kohnen et al[6] could not
find any difference in UDVA between 1mo and 3mo after the surgery. Mendicute et
al[11] followed up 104 patients (208 eyes)
and reported that the percentages of monocular UDVA reaching 0.5 at 1mo and 3mo
after the surgery were 93.7% and 94.7%, those of monocular UDVA were 86.3% and
87.4%, and those of monocular UNVA were 81.9% and 85.4% respectively. In our
study, we found that the corresponding indices were 100%, 100%, 89%, 93%, 93%
and 100% respectively.
Defocus curve is an important index
indicating full range of vision. The defocus was achieved by using different
lens in front of eyes to simulate visual requirements for different distance.
Generally, the higher the defocus curve is, the better the vision will be. The
peak vision will be achieved in the focal distance of ocular lens. In our
study, the peak vision was between 0 and -2.5 D, which was in line with Kohnen et
al’s[6] study. Between 0 to -2.5 D, the curve
was smooth, and vision was lower than 0.3 logMAR, suggesting that trifocal
intraocular lens could provide good vision under different focal lengths.
MTF is a widely used index for
evaluating intraocular lens visual quality[12-13]. MTF is defined as the contrast ratio between output
image and input image of optical system under different spatial frequencies.
Papadatou et al[14] and Carson et al[4] evaluated the visual quality of trifocal intraocular
lens by measuring MTF in vitro. Apparently, the visual quality after
trifocal intraocular lens implantation is more attractive. OQAS directly
collects optogram of point light source by dual channel technique to analyze
and obtain the point spread function (PSF)[15],
which in turn further helps to obtain other main measurement parameters. OQAS
is used to analyze all the optical information in one surface. Not only the
influence of aberration, but also the influences of scattering and diffraction
should be considered to obtain corrected PSF images.
MTF cutoff refers to the
corresponding spatial frequency when MTF=0.01, which represent the spatial
frequency when the image on the retina is 1% contrast of original image.
Theoretically, MTF cutoff is related with human vision, macular function and
neural processing function. The higher MTF cutoff value indicates a higher
human eye resolution and a better visual quality[16].
In 2005, OQAS was used to evaluate the objective visual quality by
micro-incision implantation of mono-focal spherical intraocular lens[17]. Later, OQAS was used to evaluate the visual quality
of mono-focal non-spherical intraocular lens[18-19], Toric intraocular lens[20-21], and multi-focal intraocular lens[22].
We found that the MTF cutoff of trifocal intraocular lens at 1mo after the
surgery was 34.77±13.20 cpd, which was higher than that of micro-incision
mono-focal intraocular lens (30.05±13.86 cpd)[19].
MTF cutoff of trifocal intraocular lens after 3mo was 37.05±11.26 cpd, which
was higher than the MTF cutoff (26.49±12.17 cpd) detected by Lee et al[18] at 3mo after non-spherical mono-focal intraocular
lens. Debois et al[20] and Xiao et al[21] found that the MTF cutoffs at 3mo in patients
implanted with Toric intraocular lens were 27.28±8.45 and 22.86±5.58 cpd,
respectively. While, MTF cutoffs at 1, 3, and 6mo after the multi-intraocular
lens implantation obtained by Alió et al[22]
were 24.91±7.19, 22.69±8.36, and 18.38±6.43 cpd, respectively. All the above
studies indicated that the MTF cutoff of trifocal intraocular lens was better
than monofocal, Toric, and multifocal intraocular lens. There was no
statistical difference in the MTF cutoff between 1mo and 3mo, suggesting that
the visual quality of trifocal intraocular lens within 3mo after the surgery
was relatively stable and was not decreased over time. Jiménez et al[19] found that there was no statistical significance in
the MTF cutoff at 1, 3, and 6mo of mono-focal intraocular lens, indicating the
optical quality in the early stage was stable, which was in accordance with our
study. Alió et al[16,22]
evaluated the visual quality of micro-incision zero spherical aberration
mono-focal non-spherical intraocular lens and multi-focal intraocular lens
implantation. They found that MTF cutoff at 12mo of mono-focal intraocular lens
was lower than that at 3mo after the surgery. Moreover, the value at 6mo after
multi-focal intraocular lens implantation was lower than that at 1mo after the
surgery. It indicated the possibility of decreased visual quality in
intraocular lens over time. Whether trifocal intraocular lens could maintain
stable MTF for a long time after the surgery still needs further investigation.
OSI is an objectively quantitative
index related to intraocular scattering. The higher the OSI value is, the
greater the intraocular scattering will be. OSI<2 suggests no cataract, 2-5
indicates early-stage cataract, and >5 suggests mature cataract. In this
study, preoperative average OSI was 8.9±3.33, and those at 1mo and 3mo after
the surgery were 1.62±0.90 and 1.50±0.72, respectively, which was consistent
with the diagnostic criteria of OSI evaluating cataract. There was no
statistical significance between them, suggesting that the early-stage OSI
value was consistent after trifocal intraocular lens implantation. The OSIs
detected by Jiménez et al[19] at 1mo and
3mo after micro-incision mono-focal intraocular lens implantation were
1.36±0.22 and 1.48±0.16, respectively. No statistical difference was found in
the OSI at 1 and 3mo after the implantation, which was close to our results.
The OSI in normal Chinese population aged 50-59y was 0.54±0.26, and 1.06±0.56
for those aged 60-69y[3]. In this study, although
the OSI was significantly decreased after trifocal intraocular lens
implantation, it was still slightly higher than those in normal people. These
findings suggested that OSI was not only related to the intraocular scattering
caused by cataract, but also with other influencing factors (such as higher
order aberration of cornea, stability of tear film). Thus, further research may
be required to explore the OSI in cataract.
OV (OQAS value) is the vision when
the contrast is 100%, 20% and 9%, simulating the vision at day, dusk and night,
respectively. It has been found that the uncorrelated distance visual acuity at
3mo after trifocal intraocular lens implantation is related with MTF cutoff,
OSI, OV100 and OV20. The uncorrelated intermediate visual acuity was related
with OSI and OV100. logMAR had negative correlations with MTF cutoff, OV100 and
OV20, and positive correlation with OSI. As the values of MTF cutoff, OV100 and
OV20 increase, the logMAR values decrease with a better vision. The
uncorrelated distance visual acuity may be greatly influenced by eye
resolution, intraocular scattering and contrast. Whereas, the uncorrelated
intermediate visual acuity may be greatly influenced by intraocular scattering
and contrast. Lee et al[18] had reported
that corrected distant vision was negatively correlated with MTF cutoff at 3mo
after non-spherical mono-focal intraocular lens implantation (r=-0.453),
and was positively correlated with OSI (r=0.516), which was consistent
with our results. Besides, Lee also found that MTF cutoff was negatively
correlated with total aberration, total higher-order aberration and spherical
aberration. Moreover, the OSI was positively correlated with total aberration,
total higher-order aberration and spherical aberration.
In summary, trifocal intraocular
lens implantation could provide good visual acuity at far, intermediate and
near distance and objective visual quality in the early stage. Vision at far
and intermediate distance had a certain correlation with the index of OQAS. The
limitation of this study is the small sample size, and short follow-up time.
Therefore, the conclusions are still limited. In the future, a large sample
size and longer follow-up period are needed to investigate the long-term
clinical effect after trifocal intraocular lens implantation.
ACKNOWLEDGEMENTS
Authors’ contribution: Pei C contributed guarantor of integrity of entire study;
Chu MF contributed significantly to analysis and manuscript preparation; Hui N
performed the data analyses and wrote the manuscript; Wang CY performed
surgeries in the study; Yu L and Ma B contributed to patients enrollment and
follow up; Li Y contributed to literature research.
Foundations: Supported by Key Research and
Development Project of Shaanxi Province (No.2017SF-246); Science and Technology
Planning Project of Xi’an City (No.2017116SF/YX010).
Conflicts of Interest: Chu MF, None; Hui N, None; Wang CY,
None; Yu L, None; Ma B, None; Li Y, None; Pei C,
None.
REFERENCES