・Clinical
Research・
Association
of urinary albumin excretion with central foveal thickness and intravitreal
conbercept treatment frequency in patients with diabetic macular edema
Zi-Yao
Liu1, Xiao-Jie Ma2, Ding-Ying Liao1, Xin-Di
Liu3, Ling Bai1, Jing Yao1, Min Xu4,
Yu-Ping Zheng1
1Department
of Ophthalmology, 2nd Affiliated Hospital, School of Medicine, Xi’an
Jiaotong University, Xi’an 710004, Shaanxi Province, China
2Department
of Ophthalmology,
3Department
of Clinical Medicine,
4Department
of Otorhinolaryngology-Head and Neck Surgery, 2nd Affiliated
Hospital, School of Medicine, Xi’an Jiaotong University, Xi’an 710004, Shaanxi
Province, China
Correspondent to: Min Xu. Department of
Otorhinolaryngology- Head and Neck Surgery, 2nd Affiliated Hospital,
School of Medicine, Xi’an Jiaotong University, Xi’an 710004, Shaanxi Province,
China. ent551205@163.com; Yu-Ping Zheng. Department of Ophthalmology, 2nd
Affiliated Hospital, School of Medicine, Xi’an Jiaotong University, Xi’an
710004, Shaanxi Province, China. zheng-tei@163.com
Received:
Abstract
AIM: To investigate the effect of albuminuria on
diabetic macular edema (DME) and the possible association between baseline
urinary albumin excretion (UAE) and intravitreal conbercept (IVC) treatment
frequency in DME patients.
METHODS:
In this hospital-based retrospective
study, a total of
RESULTS: Of 350 patients, a higher incidence of DME was
observed in severe non-proliferative retinopathy (NPDR) patients than that
observed in other groups. By dividing the 52 patients with severe NPDR into the
micro- and macro-albuminuria subgroups, significant differences in CFT,
systolic blood pressure, total cholesterol and serum creatinine levels, and UAE
were revealed. Furthermore, a positive liner correlation between the UAE and
CFT was found. Finally, the partial correlation coefficient adjusted for either
the CFT or UAE indicated that both parameters directly correlated with the
number of IVC injections administered during the 12mo of follow-up.
CONCLUSION:
Generally, macular edema
occurred in patients with severe NPDR, for whom the UAE is an independent risk
predictor of DME. The baseline UAE and CFT predicted the treatment frequency of
IVC injections administered in the first year for eyes with DME.
KEYWORDS: diabetic
macular edema; urinary albumin excretion; intravitreal conbercept injection;
treatment frequency
DOI:10.18240/ijo.2019.10.12
Citation:
Liu ZY, Ma XJ, Liao DY, Liu XD, Bai L,
INTRODUCTION
While diabetic retinopathy (DR) and diabetic kidney
disease (DKD) manifest similar pathological features[1-2], it is generally accepted that kidney dysfunction is
associated with the presence and severity of DR[3-4]. Furthermore, diabetic macular edema (DME) represents
the most prevalent retinopathy threatening the eye sight and it may occur at
any stage of DR[5-6]. Although
the relationship between DKD and DME is expected to be similar to that between
DKD and DR, controversial results from the same ethnic groups exist[7-10]. While the differences in sample size
and characteristics between studies may be the reason underlying the
contrasting results, a possible explanation is also provided by the
dissociation of albuminuria with reduced estimated glomerular filtration rate (eGFR) in some diabetic
patients[11-12]. It is widely recognized
that DKD is caused by progressive microvascular alterations and can be
diagnosed early through albuminuria
[urinary albumin excretion (UAE)>30
mg/24h or albumin to creatinine ratio (ACR)>30 mg/g] or defective renal function manifested as eGFR<60 mL/min/
Although anti-vascular endothelial growth factor
(anti-VEGF) agents have recently been the mainstay treatment for DME, defective
baseline kidney function may slow the resolution of DME after anti-VEGF
injections[17]. Several studies identified the
humanized, soluble, VEGF receptor (VEGFR) protein conbercept to be effective
and safe in treating DME[18-19].
Furthermore, considering that the intravitreal conbercept (IVC) treatment for
DME is produced locally, it has gradually become common in
SUBJECTS AND METHODS
Ethical Approval
This hospital-based
retrospective study was approved by the ethics committee of the hospital and
followed the tenets of the Declaration of Helsinki. All the patients signed a
medical informed consent document prior to the performance of the surgery.
Patients Selection A total of 350 eligible in-patients with a known diagnosis
of DM2 and who met our inclusion criteria between September 2016 and 2017 were
enrolled in the current study at the 2nd Affiliated Hospital of
Xi’an Jiaotong University,
For a further analysis of DME and albuminuria, only
those patients with severe NPDR (n=52) were assessed. Additional exclusion
criteria included: 1) coexisting ocular disorders (i.e., vitreous
hemorrhage, ischemia, epiretinal membrane, and uveitis); 2) suboptimal fundus
image quality possibly caused by severe opaque media and poor focus; 3)
coexisting disorders other than diabetes causing renal inadequacy; 4) subjects
who received certain relevant interventions [e.g., panretinal
photocoagulation (PRP), intravitreal anti-VEGF injection and intravitreal
injections of triamcinolone acetonide (IVTA)] within 6mo. As a result, 52 patients
met all the criteria. Therefore, one eye of each patient was analyzed, i.e.,
the eye with thicker fovea for patients with bilateral macular edema.
Other Non-ophthalmic Parameters Other non-ophthalmic parameters included:
systolic/diastolic blood pressure (mm Hg), glycated hemoglobin A
Intervention
The initial treatment
consisted in the intravitreal injection of conbercept (KH902; Chengdu Kanghong Biotech
Co., Ltd.,
Statistical Analysis All the data of the current study were presented as
mean±SD and analyzed by SPSS 20.0 (SPSS, Inc.,
RESULTS
The Distribution of Diabetic Macular Edema in
Patients with Various Diabetic Retinopathy
Of the 350 patients
diagnosed with DM2, 244 presented clinical DR, encompassing 32 mild NPDR (4
positive vs 28 negative for DME), 29 moderate NPDR (7 positive vs
22 negative for DME), 123 severe NPDR (107 positive vs 16 negative for
DME) and 60 PDR (46 positive vs 14 negative for DME) (Table 1). Overall,
a higher incidence of DME was noted in severe NPDR patients compared to the
other DR categories (Table 1). Furthermore, the Chi-square test demonstrated
statistically significant differences in DME positivity between severe NPDR
patients and those with absent DR, mild NPDR, and moderate NPDR (P<0.001).
However, a difference between severe NPDR and PDR patients was not identified (P>0.05).
Table 1 DME distribution in patients with various
grades of DR
n (%)
|
Status of DR |
DME |
Total |
|
|
Positive (+) |
Negative (-) |
||
|
|
5 (1.4) |
101 (28.9) |
106 (30.3) |
|
Mild NPDR |
4 (1.1) |
28 (8.0) |
32 (9.1) |
|
Moderate NPDR |
7 (2.0) |
22 (6.3) |
29 (8.3) |
|
Severe NPDR |
107 (30.6) |
16 (4.6) |
123 (35.2) |
|
PDR |
46 (13.1) |
14 (4.0) |
60 (17.1) |
|
Total |
169 (48.3) |
181 (51.7) |
350 (100) |
DME: Diabetic macular edema; DR: Diabetic
retinopathy; NPDR: Non-proliferative diabetic retinopathy; PDR: Proliferative
diabetic retinopathy.
Demographic and Clinical Features of Patients with
Severe Non-proliferative Diabetic Retinopathy Complicated by Albuminuria Of the 52 patients with severe NPDR complicated by
quantitative albuminuria, 23 and 29 presented microalbuminuria and
macroalbuminuria, respectively. The demographic and clinical features, as well
as the non-ophthalmic parameters, are summarized in Table 2. Significant
differences in systolic blood pressure, cholesterol, CREA, UAE and CFT were
found between the two groups. In contrast, the same was not valid for other
variables, including diastolic blood pressure, glycated hemoglobin and TG. The
two groups were similar in age (P=0.710), gender (P=0.051), and
diabetes duration (P=0.699).
Table 2 Demographics and clinical features of
patients with severe NPDR complicated by either microalbuminuria or
macroalbuminuria
n (%)
|
Items |
Microalbuminuria (n=23) |
Macroalbuminuria (n=29) |
t/χ2 |
P |
|
Age (y) |
54.65±11.10 |
53.62±8.18 |
2.909 |
|
|
Gender |
|
|
|
|
|
Female |
9 (39) |
14 (48) |
0.435 |
0.051b |
|
Male |
14 (61) |
15 (52) |
|
|
|
Duration (y) |
10.76±7.58 |
10.02±5.07 |
0.039 |
|
|
SBP (mm Hg) |
122.67±19.04 |
136.03±19.10 |
-0.180 |
|
|
DBP (mm Hg) |
78.95±11.11 |
83.14±11.07 |
-1.317 |
|
|
HbA |
8.76±1.97 |
8.81±2.16 |
-0.063 |
|
|
TC (mmol/L) |
4.51±1.06 |
5.70±1.62 |
-3.190 |
|
|
TG (mmol/L) |
1.38±0.64 |
2.35±2.53 |
-2.004 |
|
|
CREA (mmol/L) |
69.78±22.96 |
139.45±158.63 |
-2.082 |
|
|
UAE (mg/24h) |
184.61±94.11 |
4018.83±2550.14 |
-7.192 |
|
|
CFT (mm) |
348.35±101.79 |
413.48±104.08 |
-2.264 |
|
Values are means±SD. NPDR: Non-proliferative diabetic
retinopathy; SBP: Systolic blood pressure; DBP: Diastolic blood pressure; HbA
Correlation Analysis of Central Foveal Thickness with
Various Systemic Factors Following an inspection of the Spearman’s rank
correlation coefficient, a significant positive correlation between CFT with
CREA and UAE was observed (r>0, P<0.05). However, the same
was not found for systolic blood pressure and total cholesterol (P>0.05;
Table 3).
Table 3 Correlation analysis of the central foveal
thickness with various systemic factors
|
Parameters |
r-value |
P-value |
|
SBP (mm Hg) |
0.120 |
0.406 |
|
TC (mmol/L) |
0.222 |
0.113 |
|
CREA (mmol/L) |
0.387 |
0.005 |
|
UAE (mg/24h) |
0.338 |
0.014 |
SBP: Systolic blood pressure; TC: Total cholesterol;
CREA: Serum creatinine; UAE: 24-hours urinary albumin excretion rate.
As opposed to CREA (t=0.466, P=0.643),
further linear regression analyses were employed to disclose a linear
correlation between CFT and UAE (t=3.177, P=0.003; Figure 1). UAE
was thus discovered as an independent risk factor for DME in patients with
severe NPDR.
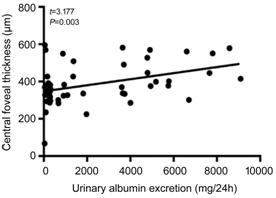
Figure 1 The scatter diagram of central foveal
thickness and UAE A positive linear correlation between central foveal
thickness and UAE was observed in patients with severe NPDR.
Association Between Baseline Urinary Albumin
Excretion and Treatment Frequency of Intravitreal Conbercept Injections As an initial treatment, a total of 46 eyes received
IVC+IVTA, which was then followed by PRN IVC injections. In addition, 43
patients completed the 12-month follow-up. Specifically, the average number of
IVC injections was 3.1±1.1 (range 1-5).
Several studies have reported the baseline CFT as a
predictor of treatment frequency of anti-VEGF therapy for DME[21-23]. To exclude the confounding
effect of CFT, a partial correlation analysis adjusted for CFT was conducted
and a positive correlation between the baseline UAE and the number of IVC
injections during the 12-month follow-up was found (r=0.623, P=0.000;
Figure 2).
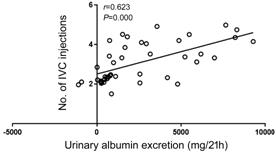
Figure 2 Relationship between the UAE and the number
of IVC injections during the 12-month follow-up.
Association Between the Baseline Central Foveal
Thickness and the Treatment Frequency of Intravitreal Conbercept
Injections The individual effect of CFT on treatment frequency
of IVC injections was also analyzed by partial correlation analysis after
adjusting for UAE. A positive correlation between CFT and the number of IVC
injections during the 12-month follow-up was found (r=0.413, P=0.007;
Figure 3).
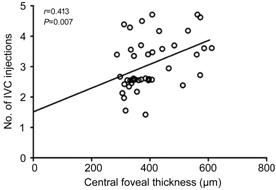
Figure 3 Relationship between CFT and the number of
IVC injections during the 12-month follow-up.
DISCUSSION
A
review of the literature from the past decade on albuminuria and DME displayed
controversial results (Table 4)[3,7-10,24-28], likely
due to patient selection, ethnic characteristics of samples and measurement
methodology.
Table 4 Summary of the literature on albuminuria
& DME
|
Study |
Study location and sample source |
Sample size and category |
Comments |
Correlation between DME and micro/macroalbuminuria |
|
Romero P[7] (2007) |
Spain, hospital-based |
102, type 1 |
Microalbuminuria was not significant for DME in
type 1 diabetic patients |
None |
|
Knudsen LL[24] (2007) |
|
656, type 1 328, type 2 |
Increased UAE was significantly associated with
CSME in type 2 diabetic patients |
Positive with macroalbuminuria |
|
Asensio -Sánchez VM[8]
(2008) |
|
208, no division between diabetes types |
High levels of proteinuria and microalbuminuria are
risk factors of DME for both type 1 and type 2 diabetic patients |
Positive with both micro and macroalbuminuria |
|
Ajoy Mohan VK[25] (2011) |
|
306, type 2 |
Microalbuminuria is a strong predictor for CSME in
type 2 diabetic patients |
Positive with microalbuminuria |
|
Kamoi K[26] (2013) |
|
131, type 2 |
UAE is not significantly correlated with CSME |
None |
|
Burgess PI[27] (2014) |
|
126, type 1 231, type 2 |
ACR was not associated with sight-threatening
retinopathy (including DME) |
None |
|
Park YH[3] (2015) |
|
15409, no division of diabetes types |
Proteinuria, as opposed to decreased eGFR, is more
significantly associated with either DR or vision-threatening DR |
Positive with macroalbuminuria |
|
Hammes HP[28] (2015) |
German/Austrian, population-based |
64784, type 2 |
Presence of macroalbuminuria increased the risk of
DME by 177% |
Positive with macroalbuminuria |
|
Jeng CJ[9] (2016) |
|
53453, no division of diabetes types |
DKD was an independent risk factor for DR, but it
did not markedly affect DME development |
None |
|
|
|
2135, type 2 |
A high-baseline ACR was associated with DME |
Positive with macroalbuminuria |
DME: Diabetic macular edema; UAE: Urinary albumin
excretion; CSME: Clinically significant macular edema; ACR: albumin to creatinine
ratio; eGFR: estimated
glomerular filtration rate; DR: Diabetic retinopathy.
In concordance with previous studies, our data
indicated a significant correlation between DME and severe NPDR[29-30]. To minimize the effects of
confounding factors, patients at the same stage of DR severity, i.e.,
severe NPDR, were selected for further analysis of the relationship between
albuminuria and DME. In fact, the other patients would have presented either a
negative urinary protein concentration (in absent, mild or moderate NPDR) or a
complication of the epiretinal membrane at the posterior retina (in PDR)
causing a tractive effect on the macula and thus preventing an accurate
evaluation. A positive linkage between CFT and the level of albuminuria was
here found. As a marker of widespread vascular endothelial damage, microalbuminuria
indicates increased permeability of small blood vessels. The close relationship
between DME and heavy albuminuria observed in the present study suggests that a
thicker macula might be an ocular manifestation of a generalized vascular impairment
rather than an isolated retinal event in DM2 patients with kidney disease. At
the same time, an absence of significant correlation between CREA and DME was
seen, even though patients with macroalbuminuria exhibited a higher level of
CREA than those in the microalbuminuria group. The association between CFT and
albuminuria, but not with CREA, advocates the overlapping, yet distinctive,
pathophysiologic mechanisms underlying DME and DKD. In fact, the severity of
DME, represented by an increased CFT, corresponds to a generalized vascular
hyperpermeability in diabetic patients, which does not fully reflect renal
status.
Contrary to the general belief, significant
differences in HbA
Therapeutically, both intravitreal anti-VEGF agents
and IVTA are common modalities for DME. Although the anti-VEGF therapy is most
effective to improve the visual acuity of DME patients, this treatment is
expensive and requires frequent injections. In contrast, the IVTA is
economically accessible, however, its usage is restricted due to the secondary
increase in intraocular pressure (IOP) and cataract[31].
In our study, the patients received an initial IVC combined with IVTA (1 mg),
which was then followed by an IVC injection if needed (PRN strategy). The
rationale behind using the combined regimen in the current study encompasses
the following: 1) the combination of an anti-VEGF agent and TA was found to
reduce the number of additional injections when compared to mono-therapy, even
though synergistic effects were not observed[32];
2) patients who received the 1-mg TA dosage were reported to have less
complications[33]; and 3) DME patients with
hypoalbuminuria were noted to be less responsive to the anti-VEGF therapy[17]. In this study, an IOP elevation was observed in one
patient only who did not require any surgical intervention. The average number
of necessary IVC injections was 3.1±1.1 during the first year, which was a
significantly lower number compared to the previously published results
(6.7±0.9)[18] and (5.6±0.8)[19]
using IVC monotherapy. Furthermore, our analyses indicated the baseline UAE
level to predict the treatment frequency of IVC injections during the first
12-month follow-up. Therefore, the impact of systemic conditions should be
taken into consideration when assessing patients’ responses to the anti-VEGF
treatment.
The limitations of the current study include the
retrospective nature of its research design, the relatively small number of
cases enrolled, and the random analyses of the baseline clinical parameters
which may fluctuate over time. Nonetheless, our results indicate the UAE to be
an independent risk predictor of DME for patients with severe NPDR. In
addition, the levels of baseline UAE and CFT were found to predict the
treatment frequency of IVC injections in the first year of follow-up.
ACKNOWLEDGEMENTS
Foundation: Supported by Nature Science Foundation of
Conflicts of Interest: Liu ZY, None; Ma XJ, None; Liao DY, None; Liu
XD, None; Bai L, None;
REFERENCES