
・Meta-Analysis・
Computer
aided diabetic retinopathy detection based on ophthalmic photography: a
systematic review and Meta-analysis
Hui-Qun Wu1, Yan-Xing Shan1, Huan
Wu1, Di-Ru Zhu1, Hui-Min Tao1, Hua-Gen Wei1,
Xiao-Yan Shen2, Ai-Min Sang3, Jian-Cheng Dong1
1Department of Medical Informatics,
Medical School of Nantong University, Nantong 226001, Jiangsu Province, China
2School of Information Science and
Technology, Nantong University, Nantong 226001, Jiangsu Province, China
3Department of Ophthalmology,
Affiliated Hospital of Nantong University, Nantong 226001, Jiangsu Province,
China
Co-first authors: Hui-Qun Wu and Yan-Xing Shan
Correspondence to: Ai-Min Sang. Department of
Ophthalmology, Affiliated Hospital of Nantong University, Nantong 226001,
Jiangsu Province, China. sangam@ntu.edu.cn; Jian-Cheng Dong. Department of
Medical Informatics, Medical School of Nantong University, Nantong 226001,
Jiangsu Province, China. dongjc@ntu.edu.cn
Received:
Abstract
AIM: To ensure the diagnostic value of computer aided techniques in diabetic
retinopathy (DR) detection based on ophthalmic photography (OP).
METHODS: PubMed, EMBASE, Ei village, IEEE Xplore and Cochrane
Library database were searched systematically for literatures about computer
aided detection (CAD) in DR detection. The methodological quality of included
studies was appraised by the Quality Assessment Tool for Diagnostic Accuracy
Studies (QUADAS-2). Meta-DiSc was utilized and a random effects model was
plotted to summarize data from those included studies. Summary receiver
operating characteristic curves were selected to estimate the overall test
performance. Subgroup analysis was used to identify the efficiency of CAD in
detecting DR, exudates (EXs), microaneurysms (MAs) as well as hemorrhages
(HMs), and neovascularizations (NVs). Publication bias was analyzed using
STATA.
RESULTS: Fourteen articles were finally included in this Meta-analysis
after literature review. Pooled sensitivity and specificity were 90% (95%CI,
85%-94%) and 90% (95%CI, 80%-96%) respectively for CAD in DR detection. With
regard to CAD in EXs detecting, pooled sensitivity, specificity were 89%
(95%CI, 88%-90%) and 99% (95%CI, 99%-99%) respectively. In aspect of MAs and
HMs detection, pooled sensitivity and specificity of CAD were 42% (95%CI,
41%-44%) and 93% (95%CI, 93%-93%) respectively. Besides, pooled sensitivity and
specificity were 94% (95%CI, 89%-97%) and 87% (95%CI, 83%-90%) respectively for
CAD in NVs detection. No potential publication bias was observed.
CONCLUSION: CAD demonstrates overall high diagnostic accuracy
for detecting DR and pathological lesions based on OP. Further prospective
clinical trials are needed to prove such effect.
KEYWORDS: Meta-analysis; diabetic retinopathy;
computer aided detection
DOI:10.18240/ijo.2019.12.14
Citation: Wu
HQ, Shan YX, Wu H, Zhu DR, Tao HM, Wei HG, Shen XY, Sang AM, Dong JC. Computer
aided diabetic retinopathy detection based on ophthalmic photography: a
systematic review and Meta-analysis. Int J Ophthalmol
2019;12(12):1908-1916
INTRODUCTION
The number of patients with diabetes is increasing
worldwide, and this number is estimated to be more than 93 million in 2010[1]. In 2014, there were 96.28 million patients, accounting
for about 25% of the global 387 million patients in China. In those diabetic
patients, diabetic retinopathy (DR) is one of the most common complications and
could possibly results in blindness at its end stage. According to the report
from World Health Organization (WHO), the percentage of DR out of total
blindness accounts for nearly 16% in U.S and Europe and 7% in China and
Mongolia[2], and the latest estimates of global
and setting-specific DR prevalence have been updated[3].
About 25% newly diagnosed type 2 diabetic mellitus (DM) patients had DR. DR
could be detected by various methods. It’s suggested that the retina should be
observed at the time of DM being diagnosed and early detection and timely
treatment of DR can reduce the risk of blindness. Therefore, it is a urgent
task to detect and screen the presence and severity of DR.
Ophthalmic photography (OP) screening is an effective way
to detect DR and could be obtained by digital ophthalmic camera, and changes of
retinal anatomic structures on the OP could be recorded. In this way, the
health status of retinal structure could be evaluated and its morphology could
be quantified for research purpose. Taken DR for instance, the retinal
arterioles have certain geometric changes and pathological lesions such as
microaneurysms (MAs), exudates (EXs), hemorrhage (HM), neovascularization (NV)
will appear as the severity of diabetes develops[4-8]. Due to the huge amount of diabetic patients, the
traditional OP screening performed by experienced ophthalmologists cost a lot
of manpower and finances, making regular OP screening difficult. Therefore,
automatic DR screening techniques based on OP images were of significance to be
developed to improve above situation.
With the advances of computer algorithms on medical image
processing, multiple automated DR detection algorithms have been developed, and
methods have been proposed to segment lesions on OPs[9-11]. The most basic way to segment the normal anatomic
structures and lesions from OPs is gray-level thresholding. However, the
thresholding results are somehow inconsistent due to uneven illumination of the
OP. Instead, edge detection and mixture models was proposed to detect
hard EXs, and its classification accuracy was about 95%. Other algorithms
including region growing, adaptive region growing, and Bayesian-based
approaches were proposed to segment the lesions on OPs with an accuracy rate of
90% for DR detection. The color and shape features extracted from OPs were used
to classify MA and HM[12], which was further used
to detect normal and abnormal retinal images. Different computer aided
detection (CAD) approaches were developed for DR automatic detection based on
OPs. Gardner et al[13] detected retinal
vessels, EXs and HMs from 179 OPs with back-propagation artificial neural
network (BP-ANN) and verified its performance with 278 OPs, the results showed
BP-ANN could achieve 88.4% sensitivity and 83.5% specificity. While Goh et
al[14] extracted color and textual features
from OPs, and they obtained 91% accuracy through their classifiers in 1000 test
images. In Priya and Aruna’s[15] study, ANN
classifier was trained with 250 OPs after geometric features extracted, and
achieved over 80% accuracy. In all these methods, the features were firstly
extracted from OPs and then classified by different classifiers. Although these
algorithms are continually refined and achieving promising results, some
state-of-art ones even comparable with human-level performance, the diagnostic
values of them are still controversy due to inconsistency of clinical datasets,
variance of sample size and difference of DR detection rules. Therefore, our
study aims to appraise the diagnostic accuracy of CAD methods in DR detection
compared with the accepted gold standard evaluated by experienced or certified
readers.
MATERIALS AND METHODS
Search Strategy and Selection
Criteria We searched PubMed, EMBASE, Ei
village, IEEE Xplore and Cochrane Library databases for relevant citations on
April 2016 and updated the search on December 2018. We used a combination of
medical subject headings and search terms indexing DR and CAD. Search terms
used were as follows: i) diabetic retinopathy, DR, proliferative diabetic
retinopathy, PDR, non-proliferative diabetic retinopathy, NPDR, microaneurysm*,
neovascularization, cotton-wool spots, hard exudate*, soft exudate*, haemorrhage,
hemorrhage, bleed*, degeneration; ii) computer, algorithm, automat*, machine
learning, feature extraction, software; iii) diagnosis, classify*, detect*,
specificity, sensitivity, accuracy studies; and iv) fundus, retina*, photo$,
image$, ophthalmic. Additional articles not obtained through the electronic
searches were identified by examining the reference lists of all relevant
articles. The detailed search strategy was available from the authors. We
included studies if they used CAD methods to detect the pathological changes
such as MAs, EXs, HMs, and NVs, which are believed to be the featured changes
in DR patients.
Inclusion criteria 1) Case-control or cohort studies
published using different kinds of computer aided methods to detect DR. 2)
Determination of DR was made by experienced ophthalmologists based on
ophthalmoscopy or OP. 3) Adequate information about the computer methods and
the techniques details were available.
Exclusion criteria 1) Comparison between different CAD
methods but without gold standard detection results by experts. 2) Insufficient
information about baseline characteristics of participants. 3) Insufficient
data about image processing and computer detection methods. 4) Insufficient
data during data extraction.
Two reviewers (Wu HQ and Shan YX)
reviewed the electronic searches independently and obtained full relevant
literatures that were likely to meet the predefined selection criteria. If
there is any disagreement, a third reviewer was involved for discussion to
reach consensus (Dong JC).
Quality Evaluation and Data
Extraction In this study, the Quality
Assessment Tool for Diagnostic Accuracy Studies (QUADAS-2) was utilized to
evaluate the quality, validity and risk of bias of the included studies[16]. The items including patient selection, index test,
reference standards etc. were assessed for potential bias and
applicability. The study characteristics were extracted and the quality of
included studies was reviewed by two reviewers (Wu HQ and Shan YX)
independently. If there is any disagreement, there will be a discussion with a
third reviewer (Dong JC) until the consensus.
Data Analysis For each of the included studies,
the raw data regarding the true and false positives, true and false negatives
were extracted by two reviewers independently (Shan YX and Wu HQ). Authors
would be contacted if the raw data could not be extracted or calculated. The
Meta-DiSc (v1.4) software was performed for further statistical analysis[17]. The parameters of diagnostic accuracy such was
sensitivity, specificity, positive likelihood ratio (PLR), negative likelihood
ratio (NLR), diagnostic odds ratio (DOR) and their corresponding 95% confidence
intervals (CI) were computed. For those included studies, heterogeneity induced
by threshold effect was calculated by the spearman correlation coefficient and P
values between the logit of sensitivity and logit of 1-specificity, while
heterogeneity induced by non-threshold effect was assessed using Chi-square or I2.
I2<25% means that heterogeneity among studies is low. I2
lies between 25% and 50% means that heterogeneity among studies is moderate. I2>50%
means that heterogeneity among studies may produce some impacts[18]. If the significant heterogeneity was detected, the
random effects model was used. In addition, the estimate of summary receiver
operating characteristics (SROC) curve was plotted and Q* values were calculated
from the SROC curve by the point where sensitivity equaled specificity. The
area under SROC curve (AUC) was achieved to depict the probability of the
correctly ranked diagnostic test values for a random pair of diseased and
non-diseased subjects. Potential heterogeneity factors were analyzed by
Meta-regressions. If necessary, subgroup analyses were made to distinguish the
heterogeneity due to test-related or other potential factors. The statistical
significance of statistical tests was defined as P value less than 0.05.
Publication Bias Publication bias was determined
using the Deeks et al[19] test. The bias
of publication was assessed using Stata SE 14 software (StataCorp, College
Station, TX, USA).
RESULTS
The literature search yielded 1104
references. Figure 1 showed the flowchart of study selection. A total of 19
primary studies were eligible for inclusion, from which five studies were
excluded due to missing data during extraction.
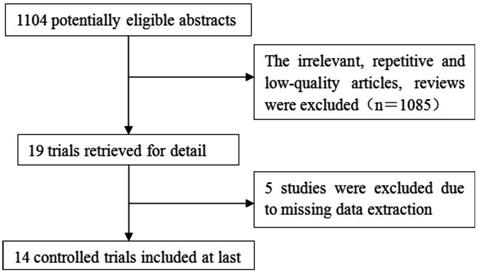
Figure 1 Flow chart of study
selection.
Summary Characteristics of Included
Studies All studies[20-33] recruited subjects regardless who were male or
female. Maher et al[29] and Júnior and
Welfer[30] recruited subjects with type 1
diabetes. Images with evidence of previous retinal laser treatment were
excluded from the study by Goatman et al[22].
In Júnior and Welfer’s study[30], the regions
with lesions were highlighted manually by four specialists in ophthalmology,
who made the analysis individually on each OP. All the images in Jaya et al[24] were graded by trained ophthalmologists. OP images in
Torok et al[33] were assessed by two
independent ophthalmologists. In Lee et al’s[26]
study, OP images were taken by TRC-NW6 non-mydriatic camera (Topcon, Tokyo,
Japan), similarly, OP images in Nayak et al’s[27]
study were taken by a TRC-NW200 Topcon non-mydriatic retinal camera. In
Niemeijer et al’s[28] study, OP images
were obtained by different non-mydriatic cameras such as the Topcon NW 100,
Topcon NW 200 and Canon CR5-45NM at multiple sites. In Sinthanayothin et al’s[31] study, 112 digital OP images were captured using a
Topcon TRC-NW5S non-mydriatic camera for those patients attending a DR
screening service. Niemeijer et al[28] and
Kittipol et al[25] obtained OP images at
45° field of view (FOV). Lee et al[26] and
Agurto et al[21] obtained OP images at 50°
and 60° FOV, respectively. In the study by Goatman et al[22], 52 OP images were obtained at 45° FOV, and 57 with
the common 50° FOV. SujithKumar and Vipula[32],
Júnior and Welfer[30], Maher et al[29], Torok et al[33],
Jaya et al[24], Kittipol et al[25], Hassan et al[23]
all included subjects photographed at one site. Agurto et al[21] and Sinthanayothin et al[31]
included subjects photographed at two and three different locations,
respectively. Other studies were with no description of the photographed
locations. The detailed characteristics of the included studies were summarized
in Table 1.
Table 1 Characteristics of the
included studies
|
Study ID |
Sample size |
Imaging modality |
Imaging center |
Color |
Angle of view |
CAD methods |
Results |
Sensitivity (%) |
Specificity (%) |
|
Acharya (2009) |
331 |
FI |
NA |
RGB |
NA |
SVM |
NPDR, PDR |
82 |
86 |
|
Agurto (2012) |
57 |
FI |
MAC, OD |
NA |
60° |
Partial least squares |
NV |
96 |
83 |
|
Goatman (2011) |
109 |
FI |
NA |
Gray |
45°/50° |
SVM |
NV |
92.1 |
73.2 |
|
Hassan (2012) |
313 |
ND |
OD |
Gray |
NA |
Morphology-based |
NV |
63.9 |
89.4 |
|
Jaya (2015) |
200 |
FI |
OD |
RGB |
NA |
SVM |
HE |
94.1 |
90 |
|
Kittipol (2012) |
2084 |
FI |
OD |
RGB |
45° |
FCM |
HE |
96.7 |
71.4 |
|
Lee (2013) |
130 |
FI |
NA |
Gray |
50° |
Multi-model inference |
NV |
96.3 |
99.1 |
|
Nayak (2008) |
140 |
FI |
NA |
NA |
NA |
ANN |
NPDR PDR |
90.32
|
100 |
|
Niemeijer (2007) |
300 |
FI |
NA |
NA |
45° |
Probability-based |
DR |
95 70 77 |
86 93 88 |
|
Maher (2015) |
130 |
FI |
MAC |
RGB |
NA |
SVM |
MAs |
95.6 |
94.86 |
|
Júnior (2013) |
89 |
FI |
MAC |
RGB |
NA |
ND |
MAs, HM |
87.69 |
92.44 |
|
Sinthanayothin (2002) |
44 |
FI |
OD, MAC |
RGB |
45° |
ANN |
HE, MAs, HM |
Exudates:88.5 HMA:77.5 |
99.7 88.7 |
|
SujithKumar (2012) |
NA |
FI |
MAC |
Gray |
NA |
Rule-based |
No DR; mild DR; moderate DR; severe DR |
89.65; 100; 100; 100 |
100; 88.88; 100; 100 |
|
Torok (2015) |
52 |
FI |
MAC |
NA |
NA |
Naive Bayes |
MAs |
93 |
78 |
NA: Not accessible; MAs:
Microaneurysms; HM: Hemorrhages; OD: Optic disc; MAC: Macula; HE: Hard
exudates; NV: Neovascularization; SVM: Support vector machine; ANN: Artificial
neural network; FCM: Fuzzy C-Means; FI: Fundus image; FA: Fluorescein
angiogram; PDR: Proliferative DR; NPDR: Non-proliferative DR.
Quality of Included Studies The methodological qualities of the
included studies were illustrated in Figure 2. The overall quality of the
included studies was variable. According to QUADAS-2, a good quality study was
considered if it had prospective consecutive recruitment, with an adequate
description of the study population, the diagnostic test and the reference
standard. Besides, the study provided the diagnostic test had a definite
reference standard. In this study, the selection of patients had introduced
high bias in the study for the subject recruitment. The inclusion and exclusion
criteria were clearly defined, with no inappropriate exclusions. The CAD
methods for DR were adequately described in all included studies. However, the
blindness in the included studies was not reported.
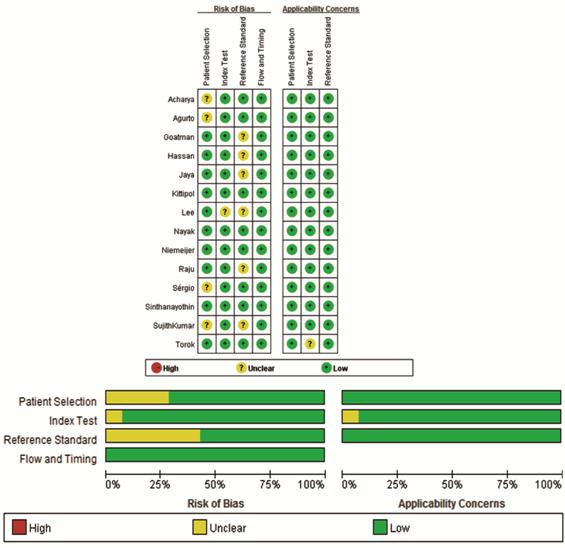
Figure 2 The diagram of the risk of bias, application
concerns of each study and their ratio according to QUADAS-2.
Accuracy of Computer Aided Detection
in Diabetic Retinopathy Detection We used random effects model to
estimate overall performance of CAD in DR detection (Figure 3).
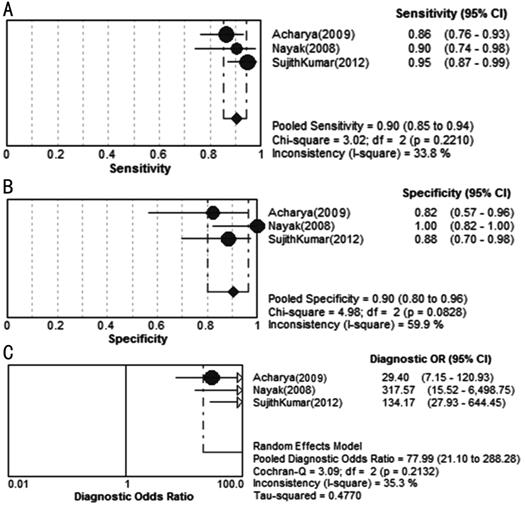
Figure 3 Forest plots for
sensitivity (A), specificity (B) and diagnostic odds ratio (C) of CAD in DR
detection.
This figure showed the sensitivity
and specificity of each study on the detection of DR. The pooled sensitivity
and specificity reach 90% and 90%, respectively. Most of the I
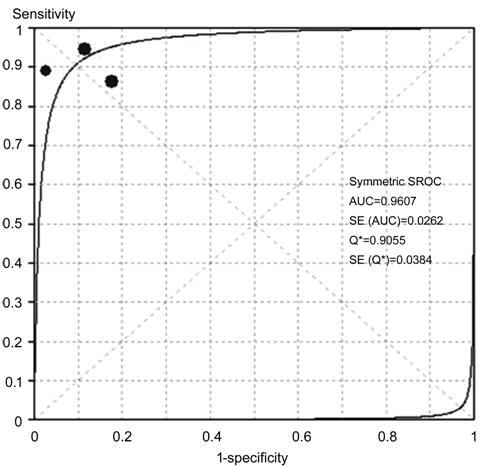
Figure 4 SROC curves of CAD in DR
detection AUC: Area under the curve; SE:
Standard error.
Accuracy of Computer Aided Detection
in Exudates Detection Figure 5 showed the sensitivity and
specificity of each CAD study on detecting EXs. The pooled sensitivity and
specificity reached 89% and 99%, respectively. Most of the I
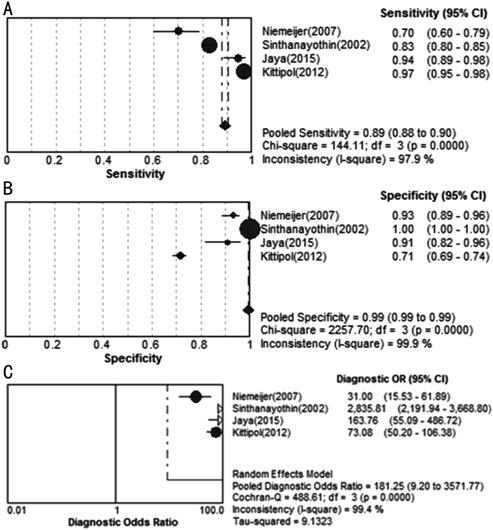
Figure 5 Forest plots for
sensitivity (A), specificity (B) and diagnostic odds ratio (C) of CAD in EXs
detection.
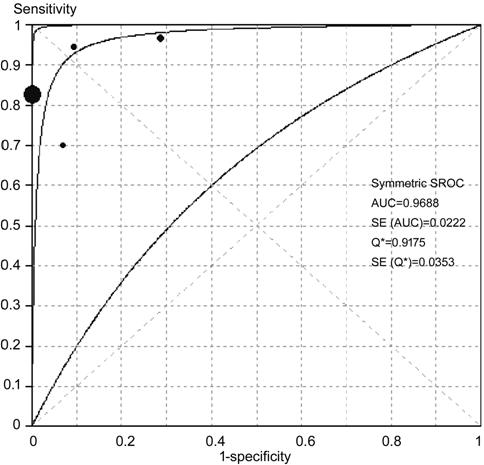
Figure 6 SROC curves of CAD in EXs
detection AUC: Area under the curve; SE:
Standard error.
Accuracy of CAD in Microaneurysms
and Hemorrhage Detection Figure 7 showed the sensitivity and
specificity of each CAD study on MAs and HM detection. The pooled sensitivity
and specificity reach 42% and 93%, respectively. The corresponding SROC curves
showed AUC was 95.54% in the study on MAs and HM, and the pooled diagnostic
accuracy (Q*) was 0.8979 (SE=0.0032) in MAs and HM detection (Figure 8).
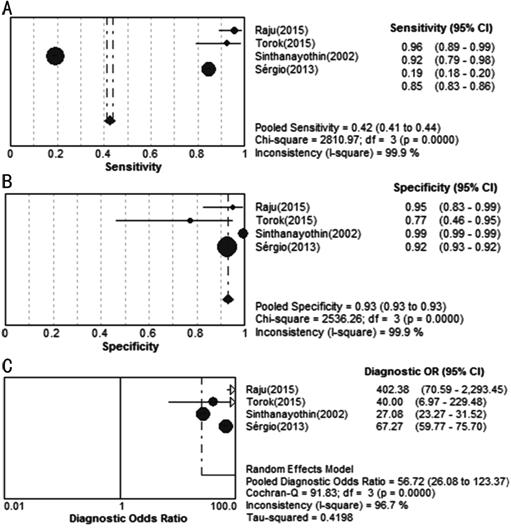
Figure 7 Forest plots for
sensitivity (A), specificity (B) and diagnostic odds ratio (C) of CAD studies
in detecting MAs and HM.
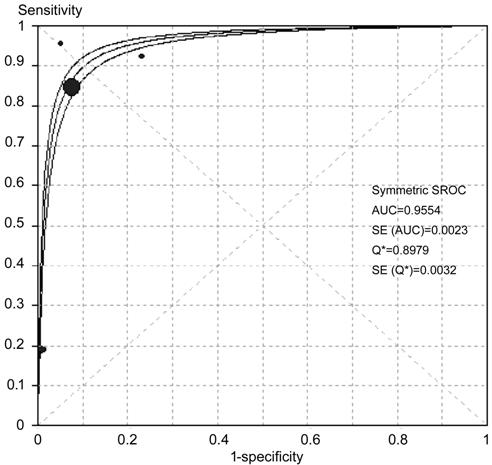
Figure 8 SROC curves of CAD in MAs
and HM detecting AUC: Area under the curve; SE:
Standard error.
Accuracy of CAD in
Neovascularizations Detection Figure 9 showed the sensitivity and
specificity of each study on NVs detection. The pooled sensitivity and
specificity reached 94% and 87% respectively. The corresponding SROC curves
showed AUC was 94.87% in the study on NV detection, and the pooled diagnostic
accuracy (Q*) was greater than 0.9 (Q*=0.8888, SE=0.0492),
showing an overall high accuracy of CAD in NV detecting (Figure 10).
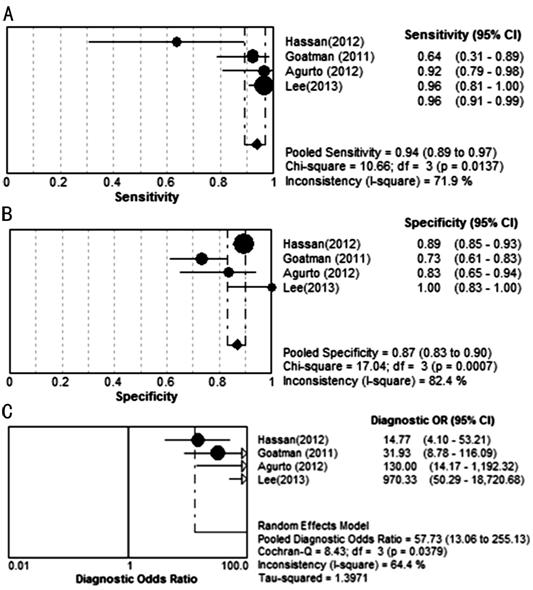
Figure 9 Forest plots for
sensitivity (A), specificity (B) and diagnostic odds ratio (C) of CAD studies
in detecting NV.
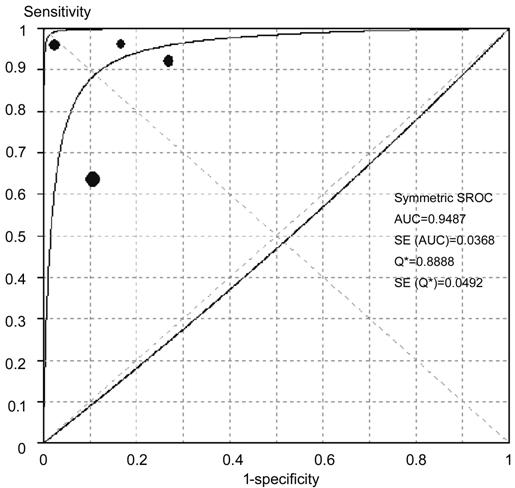
Figure 10 SROC curves of varying
retinal lesions been detected AUC: Area under the curve; SE:
Standard error.
The summary of different detection
results by CAD were shown in Table 2.
Table 2 Summary of different CAD
detection results
|
Parameters |
Different detections |
|||
|
DR |
EXs |
MAs & HM |
NV |
|
|
Se (95%CI) |
0.90 (0.85- 0.94) |
0.89 (0.88-0.90) |
0.42 (0.41- 0.44) |
0.94 (0.89-0.97) |
|
Sp (95%CI) |
0.90 (0.80-0.96) |
0.99 (0.99-0.99) |
0.93 (0.93- 0.93) |
0.87 (0.83- 0.90) |
|
PLR (95%CI) |
7.12 (3.40-14.93) |
20.33 (0.89-463.62) |
12.08 (5.30-27.56) |
5.24 (2.87- 9.56) |
|
NLR (95%CI) |
0.11 (0.06-0.21) |
0.12 (0.05- 0.26) |
0.16 (0.03- 1.04) |
0.10 (0.03- 0.35) |
|
DOR (95%CI) |
77.99 (21.10 -288.28) |
181.25 (9.20-3571.77) |
56.72 (26.08-123.37) |
57.73 (13.06-255.13) |
MAs: Microaneurysms; EXs: Exudates;
HM: Hemorrhage; NV: Neovascularization; DR: Diabetic retinopathy; Se:
Sensitivity; Sp: Specificity; PLR: Positive likelihood ratio; NLR: Negative
likelihood ratio; DOR: Diagnostic odds ratio.
Publication Bias The raw data of varying detected
results was used to detect publication bias. Using Stata software, the Deeks’[19] test was performed to detect publication bias. As
shown in Figure 11, there was no statistically significant for the studies of
CAD in DR detection (P>0.05), suggesting no potential publication
bias.
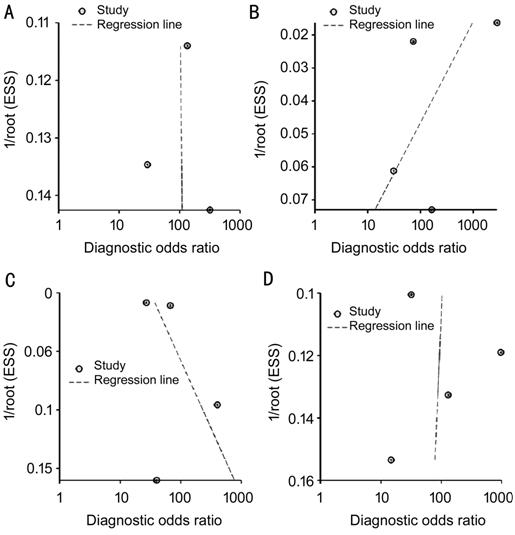
Figure 11 Test for the assessment of
potential publication bias of CAD in DR and lesion detection A: DR, P=0.98; B: EXs, P=0.48;
C: MAs and HM, P=0.63; D: NV, P=0.94.
DISCUSSION
The advantage of CAD system for DR
detection is the ability to detect suspected DR patients from a large
population in a short time. However, the reliability of such CAD system to take
place of ophthalmologists for DR screening is still doubted. Automatic computer
methods for retinal images processing have been developed for over 10y, and
different CAD methods have been applied to detect retinal abnormalities.
Preliminary studies used digitized OPs or fluorescein angiograms, but their
usefulness was limited due to low image resolution[34].
The pre-processed methods such as thresholding, filtering and morphological
operators were always utilized to enhance OP image quality before machine
classifiers were used for CAD. In one study a BP-ANN was trained to recognize
HMs and EXs on the OPs, and the effects of image processing techniques and
different network parameters were evaluated. The hybrid forward propagation ANN
some preliminary studies to make DR classification, and achieved 88%
sensitivity[35], which is consistent with the
pooled sensitivity 90% (95%CI: 85%-94%) in CAD detecting DR absence in this
analysis.
Besides DR classification, another
important function of the screening system is to detect and record abnormal
lesions. DR can lead to several abnormalities, e.g. MA, HM, EX, NV,
cotton wool spots, vessel geometric changes, and macular edema. Even though a
screening system would have to take into account all of these abnormalities,
this study majorly analyzed the detection of MA, HM, EX and NV, which all
provide clues for DR severity. The components used for feature extraction could
be classified as image-level, lesion-specific, and anatomical ones. We included
CAD methods on different component classifications in the pool analysis. The
pooled sensitivity was 89% (95%CI: 88%-90%) in EXs detecting, 42% (95%CI:
41%-44%) in MAs and HM detecting, 94% (95%CI: 89%-97%) in NV detecting, the
specificity was higher than 85% in CAD detecting all kinds of DR lesions. These
results suggested that CAD was valuable for DR detecting. The high value of AUC
in SROC curves and Q* indicated that the overall high accuracy of CAD in
DR detection. For DR lesions detecting, the diagnostic accuracy of CAD was
higher in EXs and NV than that in MAs and HM. With respect to imaging center,
the OD centered imaging have approximately the same sensitivities as macula
centered imaging, suggesting no difference of the CAD performance.
Despite CAD techniques demonstrated
overall high diagnostic accuracy for DR detection and the pathological lesions
based on OP, there were still some limitations in this analysis. One limitation
of this review was the existence of heterogeneity. The results of the Meta
analysis with the covariates including aspects of subjects’ characteristics,
detection measures, and imaging techniques might not provide robust conclusion.
Even after subgroup analysis according to different DR pathological changes,
the heterogeneity was only partly meliorated. The methods of OP taken from
included subjects were varied, which might be a source of heterogeneity too.
Ensemble classifiers instead of certain CAD protocol were always utilized in DR
classification, making separated classifier analysis difficult. Therefore, the
different CAD methods were not pooled analyzed due to discrepancy of these
classifiers. Moreover, the efficiencies of these CAD approaches were not
validated in the same dataset. Another limitation was that some original data
of three included studies unavailable and the data used in this Meta-analysis
only from published manuscripts raising the possibility of selection bias. The
differences between geographic areas and the changes of the optical means in
older groups might compromise the sensitivity of the algorithms used. The
modality of OP majorly investigated in this analysis is FI, while other
modality like OCT has not been involved. Furthermore, latest CAD techniques of
deep learning algorithms[10,36-39] on DR detection or classification have not been
included in this study, limiting the generalizability of our findings.
In summary, CAD techniques
demonstrate overall high diagnostic accuracy for DR detecting and the
pathological lesions based on OP, which can be used widely for DR screening.
Prospective clinical trials are needed to prove such effect. Further research
should focus on CAD by specific classification technique to and reasonable
study design, which can avoid the heterogeneity across studies.
ACKNOWLEDGEMENTS
Foundations: Supported by National Key R&D
Program of China (No.2018YFC1314900; No.2018YFC1314902); Nantong “226 Project”,
Excellent Key Teachers in the “Qing Lan Project” of Jiangsu Colleges and
Universities, Jiangsu Students’ Platform for Innovation and Entrepreneurship
Training Program (No.201910304108Y).
Conflicts of Interest: Wu HQ, None; Shan YX, None; Wu
H, None; Zhu DR, None; Tao HM, None; Wei HG, None; Shen
XY, None; Sang AM, None; Dong JC, None.
REFERENCES