
・Meta-Analysis・
Internal
limiting membrane peeling with different dyes in the surgery of idiopathic
macular hole: a systematic review of literature and network Meta-analysis
Shan-Shan Li1, Ran You1, Min Li2,
Xiao-Xiao Guo1, Lu Zhao1, Yan-Ling Wang1, Xi
Chen1
1Department of Ophthalmology, Beijing
Friendship Hospital, Capital Medical University, Beijing 100050, China
2Clinical Epidemiology and EBM Unit,
National Clinical Research Center for Digestive Disease, Beijing 100050, China
Correspondence to: Yan-Ling Wang and Xi Chen.
Department of Ophthalmology, Beijing Friendship Hospital, Capital Medical
University, Beijing 100050, China. wangyanling999@vip.sina.com;
tencycx@hotmail.com
Received: 2019-08-09
Accepted: 2019-10-22
Abstract
AIM: To evaluate the effect of internal limiting membrane (ILM) peeling with
indocyanine green (ICG), brilliant blue G (BBG), triamcinolone acetonide (TA),
trypan blue (TB), or without dye for the treatment of idiopathic macular hole
(IMH).
METHODS: A search was conducted using PubMed, EMBASE, and
CENTRAL (Cochrane Central Register of Controlled Trials) for related studies
published before October 2018.
RESULTS: A total of 29 studies and 2514 eyes were included in
this network Meta-analysis. For IMH closure, the rank from the best to the
worse treatment was: BBG, TB, TA, ICG, and no dye. There was a significant
difference in postoperative IMH closure rate between BBG and no dye. The rank
of the best to the worse treatment to improve visual acuity was: BBG, TB, no
dye, TA, and ICG. The improvement rate of visual acuity after using BBG was
significantly higher than ICG. The improvement rate of visual acuity was more
favorable with TB than ICG, TA, and no dye.
CONCLUSION: BBG can contribute to better anatomical and
functional outcomes compared to other dyes for ILM peeling in patients with
IMH. The results show that the best treatment of ILM peeling with dyes is BBG.
KEYWORDS: idiopathic
macular hole; brilliant blue G; trypan blue; internal limiting membrane
peeling; network Meta-analysis
DOI:10.18240/ijo.2019.12.15
Citation: Li
SS, You R, Li M, Guo XX, Zhao L,
Wang YL, Chen X. Internal limiting membrane peeling with
different dyes in the surgery of idiopathic macular hole: a systematic review
of literature and network Meta-analysis. Int J Ophthalmol
2019;12(12):1917-1928
INTRODUCTION
Idiopathic macular hole (IMH) is an important condition
that leads to blindness[1]. Patients with IMH have
a prevalence of 8 cases per 100 000 people[2], and
patients with visual impairment have an incidence of 0.2/1000 to 0.3/1000[3-4]. IMH has a serious impact on
patients’ quality of life, however, it can be repaired by the surgery of pars
plana vitrectomy (PPV)[5].
In 1971, Machemer et al[6] firstly described a vitrectomy. With the development of
medical technology, vitrectomy combined with inner limiting membrane (ILM)
peeling shows better outcomes compared to no ILM peeling[7-9]. However, the ILM is thin and transparent
which makes it a challenge for the surgeon, and it is difficult to distinguish
the boundary and range of the peeling[10]. It
is for this reason that indocyanine green (ICG) dye, which was initially used
for fluorescein angiography, was firstly used for ILM staining in 2000 and
improved the visualization of ILM during the surgery and promoted the
development of ILM peeling[11]. Since then, ILM
peeling with ICG has been widely reported to promote the surgery of MHs[12-13]. However, ICG could
also cause damage to the retinal ganglion cells and retinal pigment epithelium
(RPE) because of its toxicity, the mechanism might be related to the oxidative
toxicity of ICG[14]. Brilliant blue G (BBG) is an
alternative dye for staining ILM and has been frequently used throughout the
world. However, in vitro, it has been shown that BBG is related to
cellular toxicity[14-15], and
other dyes applied to ILM peeling surgeries have also shown toxic effects on
the retina[16-17], such as
trypan blue (TB) and triamcinolone acetonide (TA)[2,18].
In summary, almost all kinds of
biological dyes have potential side effects on the retina. At present, there
are few comparative reports of postoperative results from ICG, BBG, TB, TA, and
no dye assisted ILM peeling for patients with IMH. Therefore, this network
Meta-analysis study is mainly for patients with IMH, to analysis and summarize
the anatomical outcome (rate of postoperative primary MH closure) and
functional outcome [rate of vision improvement and best corrected visual acuity
(BCVA)] for ILM peeling with ICG, BBG, TB, TA, and no dye.
MATERIALS AND METHODS
This systematic review and a Meta-analysis were conducted
according to the recommendations from the Cochrane Handbook for Systematic
Review of Interventions[19].
Search Strategy
The PubMed, MEDLINE, EMBASE, and
CENTRAL (Cochrane Central Register of Controlled Trials) were searched for
related published studies, with no language restrictions before October 2018.
The terms used for the systematic search were (“brilliant blue”, OR
“indocyanine green”, OR “triamcinolone acetonide”, OR “trypan blue”, OR ICG, OR
TB, OR TA, OR BBG) AND (“internal limiting membrane peeling”, OR “primary
macular hole”, OR “idiopathic macular hole”). We also manually collected the
reference lists for the original studies and review articles were examined by
internet-based search for additional eligible articles.
Eligibility Criteria
The articles taken from the
internet-based search were established to screen the qualified trials. The
eligible studies must have been met: 1) comparative studies; 2) contained at
least two groups, with the ILM-peeling procedure and with application of ICG,
or BBG, or TB, or TA, or peeling without staining; 3) included only IMH
patients, and ILM peeling was conducted in case and control groups; 4) at least
one of the outcomes of interest was included.
Data Extraction and Quality
Assessment The data were extracted
independently by two reviewers and were rechecked after the first extraction.
Any disagreement of eligibility during the extraction was discussed by the two
reviewers and resolved. The extracted information from each study included the
first author, year, study type, number of subjects, age, stages of MHs,
preoperative BCVAs (logarithm of the minimal angle of resolution, logMAR),
follow-up time, and dyes. The outcomes of interest were extracted and included
the following: the primary closure rate (MH closure after the initial surgery)
and the number of people with improved visual acuity. We contacted the authors
for any missing data.
The quality of the retrospective studies was assessed
using the Newcastle-Ottawa Scale (NOS)[20]. The
NOS was used to evaluate the selection, comparability, and outcome or exposure
for cohort or case-control studies. The maximum for selection was 4 stars, for
comparability was 2 stars, and for outcome or exposure was 3 stars. The maximum
NOS score was 9 stars, and the studies with 6 stars were considered to have a
relatively high quality.
The quality of the randomized clinical trial (RCT)
studies, using the methods of the Cochrane Handbook for Systematic Reviews of
Interventions[21], were assesed according to the
following parameters: bias in sequence generation; bias in allocation
concealment; bias in masking of participants and personnel; bias due to
incomplete outcome data; bias due to selection of outcome reporting; and other
bias.
Statistical Analysis
Methods for direct treatment
comparisons Odds ratios (ORs) and 95% confidence
intervals (CI) were calculated as effect measures. We pooled summary estimate
using the random-effects method, which recognized and anchored studies as a
sample of all potential studies[22]. The
I2 statistic was calculated as a measure of the proportion of
overall variation that was attributable to between-study heterogeneity.
Methods for indirect and mixed
comparisons To evaluate the relative efficacy of
postoperative IMH closure rate and the rate of vision improvement and BCVA for
ILM peeling with ICG, BBG, TB, TA, and no dye for the patients with IMH, we
used a random-effects network Meta-analysis, within a frequentist frame-work
taken into account simultaneously[23].
Besides, the surface under the cumulative ranking curve
(SUCRA) was used to assess the ranking probabilities for all treatments on
anatomical and functional outcomes in order to obtain a treatment hierarchy[24]. A loop specific approach was used to assess the
presence of inconsistencies locally in network Meta-analysis models, that is,
whether the information of both sources of evidence was similar enough to be
combined[25]. ORs and 95%CI were also calculated
as effect measures.
Funnel plot and publication bias The difference between the observed effect size and
comparison specific summary effect for each study was calculated. Then, this
variable was regressed on standard error (SE) and thus, a simple linear
regression line was added in the funnel plot, which could help us explore
visually if there was a publication bias in the results among the original
studies. All of the analyses were conducted using STATA 15.1 software (pairwise
Meta-analysis, network Meta-analysis, I2 calculations,
SUCRA graphs, and funnel plot). P<0.05 was considered statistically
significant.
RESULTS
Selection of Studies
A total of 1425 articles were
initially identified. Then, we excluded 1341 unrelated articles by screening
the titles and abstracts and 55 duplicate articles were also excluded. A total
of 34 articles with full text that met the inclusion criteria were assessed.
Subsequently, 3 articles were from the same trial and 2 articles did not
contain interest data. Finally, a total of 29 studies with full text, published
between 2004 and 2014 were selected for the network Meta-analysis (Figure 1).
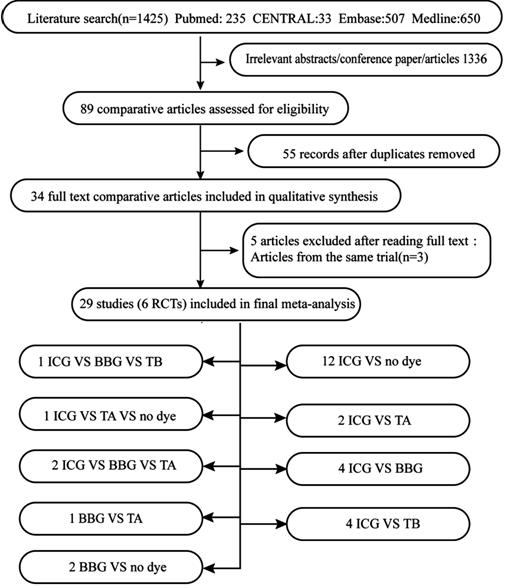
Figure 1 Study selection.
Baseline Characteristics of the Included Studies Table 1 shows the baseline characteristics of the
included studies. Among 29 of the included studies, 6 articles were RCTs, 4
articles were three-arm trials, and 23 articles were retrospective trials. A
total of 2514 eyes were included, with 1132 in the ICG group, 340 in the BBG group, 89 in the TB group, 236 in the TA group, and 717 in the no dye group. The follow-up duration was
between 6 and 19mo. MH was stage 2-4. The concentration of ICG was 0.05-2.5mg/mL.
TB was 0.025-0.25 mg/mL, and BBG was 0.25-0.5 mg/mL (Table 1). The different
dyes were assessed by studies that compared ICG vs BBG vs TB (n=1),
ICG vs TA vs no dye (n=1), ICG vs BBG vs TA
(n=2), BBG vs TA (n=1), BBG vs no dye (n=2),
ICG vs no dye (n=12), ICG vs TA (n=2), ICG vs
BBG (n=4), and ICG vs TB (n=4; Figure 1).
Quality Assessment of the Included Studies For the Newcastle-Ottawa Scale, 18 retrospective studies
had scores ≥6 and 4 retrospective studies had 5 (Table 2). For RCT studies,
bias could be considered low in six RCTs (Figure 2).
Table 2 Quality assessment of the
retrospective studies
|
Study
|
Country
|
Study quality (NOS Scale)
|
|
Selection
|
Comparability
|
Expose
|
Total score
|
|
Shukla, 2011[26]
|
India
|
4
|
2
|
1
|
7
|
|
Lee, 2005[29]
|
New Zealand
|
3
|
2
|
1
|
6
|
|
Baba, 2012[31]
|
Japan
|
4
|
1
|
1
|
6
|
|
Williamson, 2014[32]
|
UK
|
4
|
2
|
1
|
7
|
|
Fukuda, 2011[33]
|
Japan
|
4
|
1
|
1
|
6
|
|
Ando, 2004[35]
|
Japan
|
3
|
2
|
2
|
7
|
|
Nakamura, 2009[36]
|
Japan
|
3
|
2
|
2
|
7
|
|
Shiono, 2013[37]
|
Japan
|
4
|
1
|
1
|
6
|
|
Ferencz, 2006[38]
|
Hungary
|
3
|
2
|
1
|
6
|
|
Kumagai, 2006[39]
|
Japan
|
3
|
1
|
1
|
5
|
|
Schaal, 2009[40]
|
US
|
3
|
1
|
2
|
6
|
|
Lochhead, 2004[41]
|
UK
|
4
|
1
|
1
|
6
|
|
Nagai, 2007[42]
|
Japan
|
3
|
2
|
1
|
6
|
|
Mochizuki, 2014[43]
|
Japan
|
3
|
2
|
1
|
6
|
|
Karacorlu, 2005[44]
|
Turkey
|
3
|
1
|
1
|
5
|
|
Nomoto, 2008[45]
|
Japan
|
3
|
1
|
2
|
6
|
|
Tsipursky, 2013[46]
|
US
|
4
|
1
|
2
|
7
|
|
Fu, 2014[49]
|
China
|
3
|
2
|
1
|
6
|
|
Kumar, 2011[50]
|
India
|
4
|
1
|
1
|
6
|
|
Selton, 2012[51]
|
France
|
3
|
2
|
1
|
6
|
|
Brasil, 2006[54]
|
Brazil
|
3
|
2
|
1
|
6
|
|
Rüfer, 2007[52]
|
Germany
|
3
|
1
|
1
|
5
|
|
Meyer, 2008[53]
|
Germany
|
3
|
1
|
1
|
5
|
NOS Scale: Newcastle-Ottowa Scale.
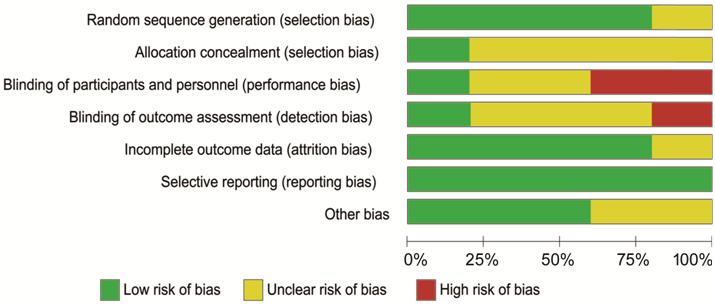
Figure 2 Bias assessment of the six randomized clinical
trial studies were performed by “Cochrane Collaboration’s tool for assessing
the risk of bias”.
Network Plots
Figure 3 presents the
corresponding structure of network, where 5 treatments formed 10 different
pairs of comparisons. The network plots whose nodes were weighted corresponding
to the sample size that showed direct comparison of different dyes, such as
BBG, ICG, TB, TA, and no dye. The number of included trials for specific direct
comparison decides the thickness of straight lines. The line between the two
treatments indicates evidence of direct comparison. Figure 3A shows the network relationship of the IMH
closure rate. The line indicates that there were 8 direct comparisons and the
remaining 2 lines had no direct comparison. Figure 3B shows the improvement
rate of visual acuity after ILM peeling. The connection indicates that there
were 6 direct comparisons and the remaining 4 had no direct comparison
evidence. Figure 3C shows the
result of BCVA in postoperative patients. The connection indicates that there
were 5 direct comparisons, and the remaining 4 had no direct comparison
evidence.
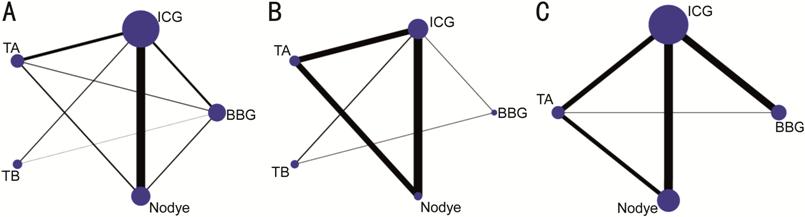
Figure 3 Network structure for different treatments was
included in the network Meta-analysis
A: Primary IMH closure rate; B:
Rate of improved visual acuity; C: Postoperative visual acuity (logMAR). ICG:
Indocyanine green; BBG: Brilliant blue G; TB: Trypan blue; TA: Triamcinolone
acetonide; logMAR: Logarithm of the minimal angle of resolution.
Forest Plots of the Pairwise and Network
Meta-Analysis Forest plot of the pairwise Meta-analyses shows the
result of the MH closure of dyes had no significant difference. The result of
improved visual acuity shows that ILM peeling BBG was better than ICG (OR 0.12,
95%CI 0.02-0.66, heterogeneity I2=0). The results of BCVA
after ILM peeling with TA and BBG were better than ICG (OR 0.08, 95%CI
0.02-0.14, heterogeneity I2=0, P=0.536; OR 0.10, 95%CI
0.02-0.17, heterogeneity I2=53.5%, P=0.072; Figure 4).
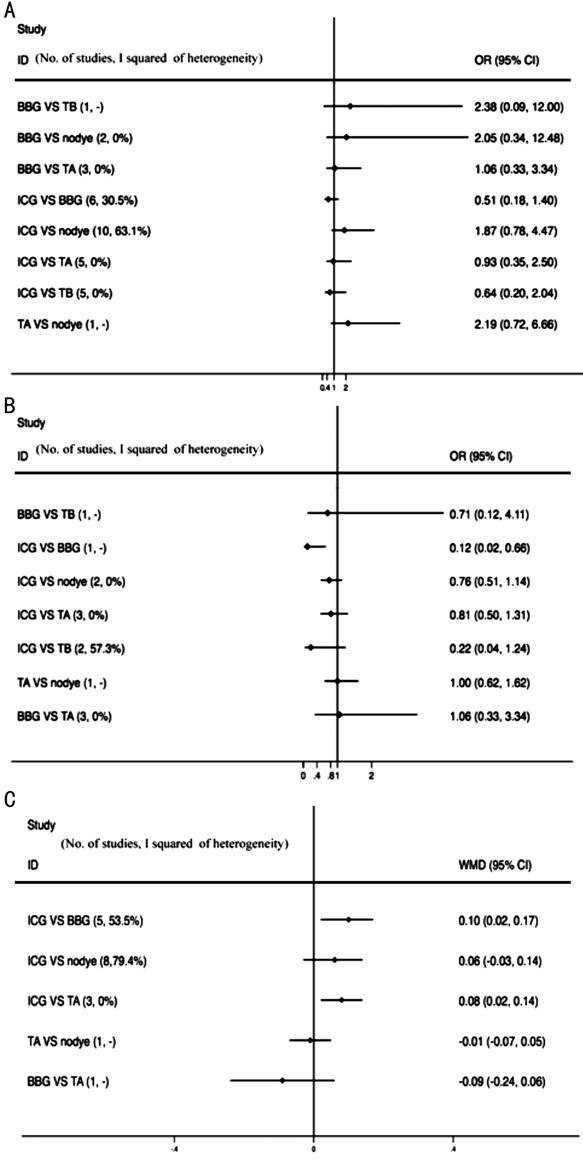
Figure 4 Forest plot of results of the pairwise
Meta-analysis A: Primary MH closure rate; B: Rate of improved visual
acuity; C: Postoperative visual acuity (logMAR). WMD: Weighted mean difference.
Figure 5 presents the results of network Meta-analysis.
It shows the result of MH closure rate after ILM peeling. For no dye vs
BBG, the rate of BBG assisted IMH closure was higher than no dye, significantly
(OR: 0.36, 95%CI: 0.14-0.92). Other comparisons was no statistical significance.
Figure 5 B shows the result of the rate of improved visual acuity after ILM
peeling. For ICG vs BBG, TB vs ICG, TB vs TA, and no dye vs
TB, the difference was statistically significant (OR 0.19, 95%CI 0.04-0.9; OR
4.57, 95%CI 1.46-14.32; OR 3.53, 95%CI 1.03-12.13; OR 0.29, 95%CI 0.09-0.96,
respectively). It shows that the improvement rate of visual acuity after using
BBG was higher than ILM peeling with ICG. The improvement rate of visual acuity
of TB was higher than ILM peeling with ICG, TA, and no dye (Figure 5B, Table
3). The difference of BCVA after surgery was not statistically significant
(Figure 5C, Table 3).
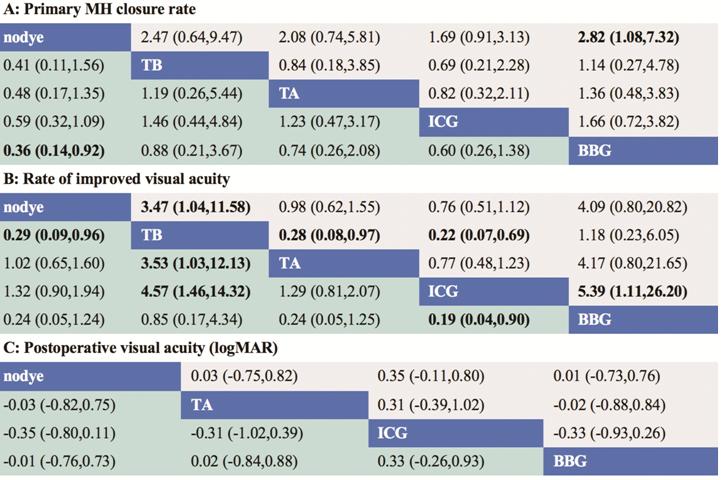
Figure 5 Odds relative with 95%CI of the network
Meta-analysis for different dyes in the surgery of IMH Different dyes in the middle block (in blue) divide the
graph into upper and lower triangles, for the lower triangle, the efficacy
estimate is the ratio of the column interventions to the row interventions. A,
B: In case that 95%CI does not include 1, if OR>1, it favors the column
interventions, in contrast, if OR<1, it favors the row interventions. C: It
is different from A and B, in case that the 95%CI does not include 0, if
OR<0, it favors the column interventions, in contrast, if OR>0, it favors
the row interventions. The upper triangle is symmetrical to the lower triangle.
The efficacy estimate is the ratio of the row interventions to the column interventions.
The results are mutually reciprocal. Boxes highlighted show significant
difference. OR: Odds relative; CI: Credible intervals; IMH: Idiopathic macular
hole; ICG: Indocyanine green; BBG: Brilliant blue G; TB: Trypan blue; TA:
Triamcinolone acetonide; logMAR: Logarithm of the minimal angle of resolution.
Table 3 Summary of main findings of pairwise and
network-analysis
|
Parameters
|
Direct pairwise Meta-analysis
|
Network Meta-analysis
OR/WMD (95%CI)
|
|
No. of samples
|
OR/WMD (95%CI)
|
P
|
Heterogeneity I2
|
|
Primary MH closure rate
|
|
|
|
|
|
|
IGG vs BBG
|
572
|
0.51 (0.18-1.40)
|
0.229
|
30.5%
|
0.6 (0.26-1.38)
|
|
TA vs BBG
|
162
|
1.06 (0.33-3.34)
|
0.623
|
0
|
0.74 (0.26-2.08)
|
|
TB vs BBG
|
35
|
2.38 (0.09-62.7)
|
-
|
100%
|
0.88 (0.21-3.67)
|
|
No dye vs BBG
|
12
|
2.05 (0.34-12.48)
|
0.526
|
0
|
0.36 (0.14-0.92)
|
|
TA vs ICG
|
427
|
0.93 (0.35-2.50)
|
0.833
|
0
|
1.23 (0.47-3.17)
|
|
TB vs ICG
|
187
|
0.64 (0.20-2.04)
|
0.912
|
0
|
1.46 (0.44-4.84)
|
|
No dye vs ICG
|
1171
|
1.87 (0.78-4.47)
|
0.008
|
63.1%
|
0.59 (0.32-1.09)
|
|
TB vs TA
|
-
|
-
|
-
|
-
|
1.19 (0.26-5.44)
|
|
No dye vs TA
|
306
|
2.19 (0.72-6.66)
|
-
|
0
|
0.48 (0.17-1.35)
|
|
No dye vs TB
|
-
|
-
|
-
|
-
|
0.41 (0.11-1.56)
|
|
Rate of improved visual acuity
|
|
|
|
|
|
|
IGG vs BBG
|
30
|
0.12 (0.02-0.66)
|
-
|
0
|
0.19 (0.04-0.90)
|
|
TA vs BBG
|
-
|
-
|
-
|
-
|
0.24 (0.05-1.25)
|
|
TB vs BBG
|
35
|
0.71 (0.12-4.11)
|
-
|
100%
|
0.85 (0.17-4.34)
|
|
No dye vs BBG
|
-
|
-
|
-
|
-
|
0.24 (0.05-1.24)
|
|
TA vs ICG
|
313
|
0.81 (0.50-1.31)
|
0.46
|
0
|
1.29 (0.81-2.07)
|
|
TB vs ICG
|
73
|
0.22 (0.04-1.24)
|
0.126
|
57.3%
|
4.57 (1.46-14.32)
|
|
No dye vs ICG
|
518
|
0.76 (0.51-1.14)
|
0.428
|
0
|
1.32 (0.09-1.94)
|
|
TB vs TA
|
-
|
-
|
-
|
-
|
3.53 (1.03-12.13)
|
|
No dye vs TA
|
306
|
1.00 (0.62-1.62)
|
-
|
0
|
1.02 (0.65-1.60)
|
|
No dye vs TB
|
-
|
-
|
-
|
-
|
0.29 (0.09-0.96)
|
|
Postoperative visual acuity
(logMAR)
|
|
|
|
|
|
|
IGG vs BBG
|
531
|
0.10 (0.02-0.17)
|
0.072
|
53.5%
|
0.33 (-0.28-0.95)
|
|
TA vs BBG
|
36
|
-0.09 (-0.24-0.06)
|
-
|
100%
|
0.01 (-0.88-0.89)
|
|
No dye vs BBG
|
-
|
-
|
-
|
-
|
-0.08 (-0.86-0.70)
|
|
TA vs ICG
|
365
|
0.08 (0.02-0.14)
|
0.536
|
0
|
-0.33 (-1.05-0.40)
|
|
No dye vs ICG
|
648
|
0.06 (-0.03-0.14)
|
0.00
|
79.4%
|
-0.41 (-0.91-0.08)
|
|
No dye vs TA
|
306
|
-0.01 (-0.07-0.05)
|
-
|
100%
|
-0.09 (-0.91-0.73)
|
OR: Odds ratio; WMD: Weighted mean difference.
Ranking Probability of Therapeutic Effects Figure 6 shows the ranking probability of each treatment.
The larger the area under the curve was the better treatment effect. Figure 6A shows the rate of MH closure after ILM
peeling. The area under the BBG group was the largest, the effect of TB group
was the second, and the TA group was the third. The rate of MH closure after
ILM peeling with no dye was the worst. Figure 6B shows the rate of improvement
of visual acuity. The effect of ILM peeling with BBG group was the first and
the effect of TB group was the second. The effect was similar between TA and
the no dye group which were the third, and the effect of the ICG group was the
worst. Figure 6C shows the
result of postoperative BCVA, which was different from A and B. Therefore,
Figure 6C shows the
larger area under the curve, the larger logMAR value was the worse treatment
effect. The result of treatment effect after ILM peeling with no dye was
similar to the BBG and TA groups, which were better than the ICG group.

Figure 6 Ranking of therapeutic effects included in the
network Meta-analysis A: Primary MH closure rate; B: Rate of improved visual
acuity; C: Postoperative visual acuity (logMAR).
Inconsistent Test Results We did an inconsistency test for the closure of the IMH,
forming 5 triangular closed loops, namely BBG-ICG-TA, BBG-ICG-no dye, BBG-TA-no
dye, BBG-ICG-TB, and ICG-TA-no dye. The result of the inconsistency test showed
that the impact factor (IF) was in the range of 0.12-0.95 and 95%CI was in the
range of 0.00-3.92. Inconsistent test results of postoperative visual acuity
improvement showed two closed loops, BBG-ICG-TB and ICG-TA-no dye. The results
of the IF were in the range of 0.09-1.78 and 95%CI was in the range of
0.00-4.69. The results of BCVA showed two triangular closed loops, BBG-ICG-TA
and ICG-TA-no dye. The results of the IF were in the range of 0.17-0.27 and
95%CI was in the range of 0.00-2.30.
Funnel Plot and Publication Bias The different points in the funnel plot represented a
direct comparison between the five treatments, and the number of identical
color points represented the same pairwise direct comparison from the original
study. Comparison adjusted funnel plots were roughly symmetrical for the
outcome Figure 7, it showed that there was a small possibility of small sample
size effects or publication bias.
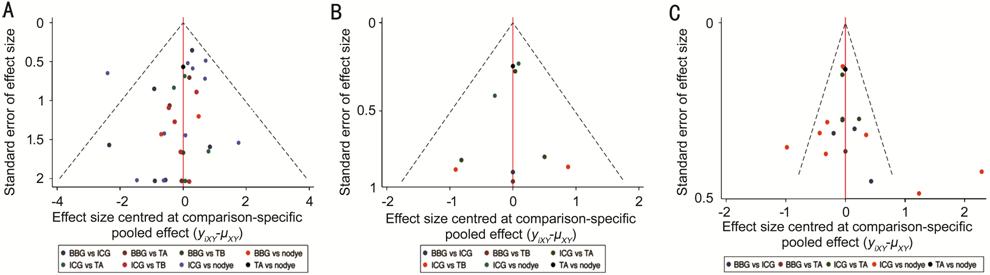
Figure 7 A comparison-adjusted funnel
plot representing the same pairwise direct comparison from the original
study A: Primary MH closure rate; B: Rate of improved visual
acuity; C: Postoperative visual acuity (logMAR).
DISCUSSION
This network Meta-analysis study was mainly for patients
with IMH, to analyze and summarize the postoperative primary MH closure rate
and the rate of vision improvement and BCVA for ILM peeling with ICG, BBG, TB,
TA, and no dye. It included 2514 eyes from 29 studies. Forest plots showed the
postoperative IMH closure effect of BBG was better than no dye and it was
statistically significant. The improvement rate of visual acuity after using
BBG was significantly higher than the ICG group, and the TB group was
significantly higher than the ICG, TA, and no dye groups. The differences between
groups were not statistically significant. Ranking probability of therapeutic
effects showed that for the rate of IMH closure, the rank from the best to the
worse treatment was BBG, TB, TA, ICG, and no dye. The rank of the rate of
improvement for visual acuity from the best to the worse treatment was BBG, TB,
no dye, TA, and ICG. The results for visual acuity after ILM peeling with no
dye were similar to the BBG and TA groups, but better than the ICG group.
Comparison adjusted funnel plots were roughly symmetrical and showed that there
was only a small possibility of small sample size effects or publication bias.
In 1996, Yooh et al[55] performed ultrastructural analysis of ILM tissue
exfoliated during MH surgery, which suggested that ILM tissue became the only
pulling force in stage 4 MH with posterior vitreous detachment or after
posterior vitreous detachment[31]. ILM acted as a
proliferating scaffold for various cellular components, such as RPE cells[56]. ILM peeling released tangential traction around the
macula, which could cause centripetal motion of the tissue to close the MH[57].
In 2002, TB was firstly used in vitreoretinal surgery[58]. TB is a high molecular weight reactive
dye with a weight of 960.8, which makes the lens anterior capsule, preretinal
membrane[59-60], and ILM more
visible and able to form a high affinity with the retinal epithelium, improving
the surgical effect[61]. Brazitikos et al[62] observed 35 eyes of intraoperative TB-assisted ILM
peeling, and showed that ILM peeling with TB did not cause any changes in the
thickness of the retinal nerve fiber layer at six months after surgery. TA
is a kind of water-insoluble glucocorticoid[63].
As an anti-inflammatory drug[64-65],
it has been used for the treatment of various ophthalmic diseases[61], and also for staining the posterior vitreous
membrane and ILM. The deposition of TA particles on the surface of the retina
acts as a “stain” because there are no white spots on the ILM, allowing the
surgeon to see where the ILM is peeling[45].
Similarly, studies have found that TA has toxic effects on the RPE and
retinal ganglion cells[66]. Furthermore, some
studies have reported that ICG is more likely to cause a decrease in retinal
function than other dyes such as TB and TA[67].
Several studies proved that BBG has less toxic effects on
the retina than other dyes such as TB, ICG, and TA, the results of these
studies were consistent with the current network meta-analysis[67]. Some experiments demonstrated that BBG had less
retinal toxicity than ICG and other dyes[63].
Ejstrup et al[68] injected BBG, ICG, and
TA into the eyes of pigs and found that the toxicity of ICG on the retina was
much higher than that of BBG and TA. Creuzot-Garcher et al[69] injected BBG, TB, ICG, and TA into the eyes of rats.
After one month it was observed that the electroretinogram of the rats had
returned to normal in the BBG, TB, and TA groups. However, the rats being
injected with ICG took a longer time to recover. Ueno et al[70] compared the toxicity of BBG, TB, and ICG, and found
that BBG had the lowest toxicity on the retina, with the toxicity of BBG being
lower than TB and the toxicity of TB being lower than ICG. The results of
several clinical studies differed from our findings. Shukla et al[26] compared surgical outcomes with three dyes, BBG, TB,
and ICG, six months postoperatively, visual improvement occurred in 80%, 85%,
and 33% eyes (P=0.005). However, the results of our study found that the
effect of BBG was better than the TB group, and the effect of TB was better
than the ICG group. Nomoto et al[45]
reported the results of MH surgery with TA-assisted ILM peeling and
ICG-assisted ILM peeling. The rate of MH closure was similar with 98% for the
TA group and 100% for the ICG group. The results of improved BCVA in the TA
group were better than the ICG group, and the results of BCVA with 20/40 or
better in the TA group were better than 59% in the ICG group, which was similar
to our findings. Previous results of meta-analysis were also consistent with
the results of this network meta-analysis. In 2016, Azuma et al[67] performed a systematic review showing that the BCVA
in the BBG group was better than the ICG group and the BBG-free group. In 2012,
another meta-analysis reported that VA improvement was less in the ICG group.
The toxicity of visual field defects was greater in the ICG group compared with
the non-ICG group[71]. However, these
traditional meta-analyses only compared two therapeutic measures, and do not
accurately compare multiple therapeutic measures.
Of the 29 studies included, the
relevant qualified RCTs were numbered, the sample size was not sufficient and
the RCTs did not clearly describe clearly how masking and allocation were
completed. The other 24 studies were retrospective studies. The differences in
the concentrations of BBG, ICG, and TB, and the time of face down position
after surgery may also affect the results. There were few related studies on
TB, and there was insufficient data in this meta-analysis. Some large samples
randomized controlled and double-blind trials would be the best choice for
inclusion in network meta-analysis, but there were few high-quality studies on
topics related to this research. Overall, some more high quality RCTs with a
longer duration and more comprehensive endpoints should be carried out in the
future.
In conclusion, the results showed
that the rate of MH closure after ILM peeling with dyes was better than without
dyes. The dye with the highest safety was BBG, and TB was second, followed by
TA which was better than ICG. This network meta-analysis systematically and
objectively evaluated the efficacy of ICG, BBG, TB, TA, and no dye-assisted ILM
peeling in the treatment of IMH. It allowed clear and comprehensive
understanding of these dyes, which was beneficial in the selection of the best
dye for ILM peeling of IMH.
ACKNOWLEDGEMENTS
Authors’ contributions: Li SS, You R, Guo XX and Zhao L:
data collection; Li SS, Li M, Wang YL and Chen X: data analysis; Wang YL and
Chen X: project planning; Li SS and Chen X: manuscript writing.
Foundations: Supported by the National Natural
Science Foundation of China (No.81870686); the Natural Science Foundation of
Beijing Municipal (No.7184201); the Capital’s Funds for Health Improvement and
Research (No.2018-1-2021).
Conflicts of Interest: Li SS, None; You R,
None; Li M, None; Guo XX, None; Zhao
L, None; Wang YL, None; Chen X,
None.
REFERENCES
|
1 Chen Q, Liu ZX. Idiopathic macular hole:
a comprehensive review of its pathogenesis and of advanced studies on
metamorphopsia. J Ophthalmol 2019;2019:7294952.
https://doi.org/10.1155/2019/7294952
PMid:31240135 PMCid:PMC6556255
|
|
|
|
2 McCannel CA, Ensminger JL, Diehl NN,
Hodge DN. Population-based incidence of macular holes. Ophthalmology
2009;116(7):1366-1369.
https://doi.org/10.1016/j.ophtha.2009.01.052
PMid:19576500 PMCid:PMC2867090
|
|
|
|
|
3 Rahmani B, Tielsch JM, Katz J, Gottsch J,
Quigley H, Javitt J, Sommer A. The cause-specific prevalence of visual
impairment in an urban population. The Baltimore Eye Survey. Ophthalmology
1996;103(11):1721-1726.
https://doi.org/10.1016/S0161-6420(96)30435-1
|
|
|
|
|
4 Mitchell P, Smith W, Chey T, Wang JJ,
Chang A. Prevalence and associations of epiretinal membranes. the blue
mountains eye study, Australia. Ophthalmology 1997;104(6):1033-1040.
https://doi.org/10.1016/S0161-6420(97)30190-0
|
|
|
|
|
5 Wang Y, Liang XD, Gao M, Liu J, Liu LM,
Liu W. Vision-related quality of life after pars plana vitrectomy with or
without combined cataract surgery for idiopathic macular hole patients. Int
Ophthalmol 2019.
https://doi.org/10.1007/s10792-019-01124-6
|
|
|
|
|
6 Machemer R, Buettner H, Norton EW, Parel
JM. Vitrectomy: a pars Plana approach. Trans Am Acad Ophthalmol Otolaryngol 1971;75(4):
813-820.
|
|
|
|
|
7 Steel DH, Lotery AJ. Idiopathic
vitreomacular traction and macular hole: a comprehensive review of
pathophysiology, diagnosis, and treatment. Eye (Lond) 2013;27(Suppl
1):S1-S21.
https://doi.org/10.1038/eye.2013.212
PMid:24108069 PMCid:PMC3797995
|
|
|
|
|
8 Zhao PP, Wang S, Liu N, Shu ZM, Zhao JS.
A review of surgical outcomes and advances for macular holes. J Ophthalmol
2018;2018: 7389412.
https://doi.org/10.1155/2018/7389412
PMid:29850211 PMCid:PMC5932482
|
|
|
|
|
9 Chatziralli IP, Theodossiadis PG, Steel
DHW. Internal limiting membrane peeling in macular hole surgery; why, when, and
how? Retina 2018;38(5):870-882.
https://doi.org/10.1097/IAE.0000000000001959
PMid:29210940
|
|
|
|
|
10 Lin YY, Liu JH, Chang Y. Foetal bovine
serum can reduce toxicity of indocyanine green, brilliant blue G and trypan
blue in ARPE-19 cellular model that suggests new surgical staining protocols
for internal limiting membrane peeling procedure. Clin Exp Ophthalmol
2018;46(7):796-808.
https://doi.org/10.1111/ceo.13165
PMid:29417735
|
|
|
|
|
11 Kadonosono K, Itoh N, Uchio E, Nakamura
S, Ohno S. Staining of internal limiting membrane in macular hole surgery.
Arch Ophthalmol 2000;118(8):1116-1118.
https://doi.org/10.1001/archopht.118.8.1116
PMid:10922208
|
|
|
|
|
12 Seo KH, Yu SY, Kwak HW. Topographic
changes in macular ganglion cell-inner plexiform layer thickness after vitrectomy
with indocyanine green-guided internal limiting membrane peeling for
idiopathic macular hole. Retina 2015;35(9):1828-1835.
https://doi.org/10.1097/IAE.0000000000000563
PMid:25923957
|
|
|
|
|
13 Ra H, Lee WK. Efficacy of the inverted
internal limiting membrane flap technique with perfluorocarbon
liquid-mediated selective staining for large macular hole repair. Curr Eye
Res 2019;44(1):53-59.
https://doi.org/10.1080/02713683.2018.1524014
PMid:30216100
|
|
|
|
|
14 Sheu SJ, Chen JL, Bee YS, Chen YA, Lin
SH, Shu CW. Differential autophagic effects of vital dyes in retinal pigment
epithelial ARPE-19 and photoreceptor 661W cells. PLoS One
2017;12(3):e0174736.
https://doi.org/10.1371/journal.pone.0174736
PMid:28358857 PMCid:PMC5373602
|
|
|
|
|
15 Ambiya V, Goud A, Khodani M, Chhablani
J. Inner retinal thinning after Brilliant Blue G-assisted internal limiting
membrane peeling for vitreoretinal interface disorders. Int Ophthalmol
2017;37(2):401-408.
https://doi.org/10.1007/s10792-016-0276-6
PMid:27299436
|
|
|
|
|
16 Machida S, Nishimura T, Ohzeki T, Murai
KI, Kurosaka D. Comparisons of focal macular electroretinograms after
indocyanine green-, brilliant blue G-, or triamcinolone acetonide-assisted
macular hole surgery. Graefes Arch Clin Exp Ophthalmol 2017;255(3):485-492.
https://doi.org/10.1007/s00417-016-3478-8
PMid:27604762
|
|
|
|
|
17 Bracha P, Ciulla TA, Baumal CR. Vital
dyes in vitreomacular surgery. Ophthalmic Surg Lasers Imaging Retina
2018;49(10):788-798.
https://doi.org/10.3928/23258160-20181002-07
PMid:30395665
|
|
|
|
|
18 Gupta D. Face-down posturing after
macular hole surgery: a review. Retina 2009;29(4):430-443.
https://doi.org/10.1097/IAE.0b013e3181a0bd01
PMid:19359978
|
|
|
|
|
19 Stroup DF, Berlin JA, Morton SC, Olkin
I, Williamson GD, Rennie D, Moher D, Becker BJ, Sipe TA, Thacker SB.
Meta-analysis of observational studies in epidemiology: a proposal for
reporting. Meta-analysis Of Observational Studies in Epidemiology (MOOSE)
group. JAMA 2000;283(15):2008-2012.
https://doi.org/10.1001/jama.283.15.2008
PMid:10789670
|
|
|
|
|
20 Stang A. Critical evaluation of the Newcastle-Ottawa
scale for the assessment of the quality of nonrandomized studies in
meta-analyses. Eur J Epidemiol 2010;25(9):603-605.
https://doi.org/10.1007/s10654-010-9491-z
PMid:20652370
|
|
|
|
|
21 Jørgensen L, Paludan-Müller AS, Laursen
DR, Savović J, Boutron I, Sterne JA, Higgins JP, Hróbjartsson A. Evaluation
of the Cochrane tool for assessing risk of bias in randomized clinical
trials: overview of published comments and analysis of user practice in
Cochrane and non-Cochrane reviews. Syst Rev 2016;5:80.
https://doi.org/10.1186/s13643-016-0259-8
PMid:27160280 PMCid:PMC4862216
|
|
|
|
|
22 DerSimonian R, Laird N. Meta-analysis in
clinical trials. Control Clin Trials 1986;7(3):177-188.
https://doi.org/10.1016/0197-2456(86)90046-2
|
|
|
|
|
23 Lu G, Ades AE. Combination of direct and
indirect evidence in mixed treatment comparisons. Stat Med
2004;23(20):3105-3124.
https://doi.org/10.1002/sim.1875
PMid:15449338
|
|
|
|
|
24 Salanti G, Ades AE, Ioannidis JP. Graphical
methods and numerical summaries for presenting results from
multiple-treatment meta-analysis: an overview and tutorial. J Clin Epidemiol
2011;64(2):163-171.
https://doi.org/10.1016/j.jclinepi.2010.03.016
PMid:20688472
|
|
|
|
|
25 Song FJ, Altman DG, Glenny AM, Deeks JJ.
Validity of indirect comparison for estimating efficacy of competing
interventions: empirical evidence from published meta-analyses. BMJ
2003;326(7387):472.
https://doi.org/10.1136/bmj.326.7387.472
PMid:12609941 PMCid:PMC150178
|
|
|
|
|
26 Shukla D, Kalliath J, Neelakantan N, Naresh
KB, Ramasamy K. A comparison of brilliant blue G, trypan blue, and
indocyanine green dyes to assist internal limiting membrane peeling during
macular hole surgery. Retina 2011;31(10):2021-2025.
https://doi.org/10.1097/IAE.0b013e318213618c
PMid:21685824
|
|
|
|
|
27 Christensen UC. Value of internal
limiting membrane peeling in surgery for idiopathic macular hole and the
correlation between function and retinal morphology. Acta Ophthalmol
2009;87(Thesis 2):1-23.
https://doi.org/10.1111/j.1755-3768.2009.01777.x
PMid:19912135
|
|
|
|
|
28 Bellerive C, Cinq-Mars B, Louis M, Tardif
Y, Giasson M, Francis K, Hébert M. Retinal function assessment of trypan blue
versus indocyanine green assisted internal limiting membrane peeling during
macular hole surgery. Can J Ophthalmol 2013;48(2):104-109.
https://doi.org/10.1016/j.jcjo.2012.10.009
PMid:23561603
|
|
|
|
|
29 Lee KL, Dean S, Guest S. A comparison of
outcomes after indocyanine green and trypan blue assisted internal limiting
membrane peeling during macular hole surgery. Br J Ophthalmol
2005;89(4):420-424.
https://doi.org/10.1136/bjo.2004.049684
PMid:15774917 PMCid:PMC1772609
|
|
|
|
|
30 Beutel J, Dahmen G, Ziegler A, Hoerauf H.
Internal limiting membrane peeling with indocyanine green or trypan blue in
macular hole surgery: a randomized trial. Arch Ophthalmol
2007;125(3):326-332.
https://doi.org/10.1001/archopht.125.3.326
PMid:17353402
|
|
|
|
|
31 Baba T, Hagiwara A, Sato E, Arai M,
Oshitari T, Yamamoto S. Comparison of vitrectomy with brilliant blue G or
indocyanine green on retinal microstructure and function of eyes with macular
hole. Ophthalmology 2012;119(12):2609-2615.
https://doi.org/10.1016/j.ophtha.2012.06.048
PMid:22921387
|
|
|
|
|
32 Williamson TH, Lee E. Idiopathic macular
hole: analysis of visual outcomes and the use of indocyanine green or
brilliant blue for internal limiting membrane peel. Graefes Arch Clin Exp
Ophthalmol 2014;252(3):395-400.
https://doi.org/10.1007/s00417-013-2477-2
PMid:24146267
|
|
|
|
|
33 Fukuda K, Shiraga F, Yamaji H, Nomoto H,
Shiragami C, Enaida H, Ishibashi T. Morphologic and functional advantages of
macular hole surgery with brilliant blue G-assisted internal limiting membrane
peeling. Retina 2011;31(8):1720-1725.
https://doi.org/10.1097/IAE.0b013e31822a33d0
PMid:21878802
|
|
|
|
|
34 Horio N, Horiguchi M. Effect on visual
outcome after macular hole surgery when staining the internal limiting
membrane with indocyanine green dye. Arch Ophthalmol 2004;122(7):992-996.
https://doi.org/10.1001/archopht.122.7.992
PMid:15249363
|
|
|
|
|
35 Ando F, Sasano K, Ohba N, Hirose H,
Yasui O. Anatomic and visual outcomes after indocyanine green-assisted
peeling of the retinal internal limiting membrane in idiopathic macular hole
surgery. Am J Ophthalmol 2004;137(4):609-614.
https://doi.org/10.1016/j.ajo.2003.08.038
PMid:15059697
|
|
|
|
|
36 Nakamura Y, Kondo M, Asami T, Terasaki
H. Comparison of macular hole surgery without internal limiting membrane
peeling to eyes with internal limiting membrane peeling with and without
indocyanine green staining: three-year follow-up. Ophthalmic Res
2009;41(3):136-141.
https://doi.org/10.1159/000209666
PMid:19321934
|
|
|
|
|
37 Shiono A, Kogo J, Klose G, Ueno S,
Takagi H. Effects of indocyanine green staining on the recovery of visual
acuity and macular morphology after macular hole surgery. Ophthalmologica
2013;230(3):138-143.
https://doi.org/10.1159/000351661
PMid:23988574
|
|
|
|
|
38 Ferencz M, Somfai GM, Farkas A, Kovács
I, Lesch B, Récsán Z, Nemes J, Salacz G. Functional assessment of the
possible toxicity of indocyanine green dye in macular hole surgery. Am J
Ophthalmol 2006;142(5):765-770.
https://doi.org/10.1016/j.ajo.2006.05.054
PMid:17056360
|
|
|
|
|
39 Kumagai K, Furukawa M, Ogino N, Uemura A,
Larson E. Long-term outcomes of internal limiting membrane peeling with and
without indocyanine green in macular hole surgery. Retina 2006;26(6):613-617.
https://doi.org/10.1097/01.iae.0000236471.79066.fe
PMid:16829801
|
|
|
|
|
40 Schaal S, Barr CC. Management of macular
holes: a comparison of 1-year outcomes of 3 surgical techniques. Retina
2009;29(8):1091-1096.
https://doi.org/10.1097/IAE.0b013e31819f4b8c
PMid:19357554
|
|
|
|
|
41 Lochhead J, Jones E, Chui D, Lake S,
Karia N, Patel CK, Rosen P. Outcome of ICG-assisted ILM peel in macular hole surgery.
Eye (Lond) 2004;18(8):804-808.
https://doi.org/10.1038/sj.eye.6701328
PMid:14752502
|
|
|
|
|
42 Nagai N, Ishida S, Shinoda K, Imamura Y,
Noda K, Inoue M. Surgical effects and complications of indocyanine
green-assisted internal limiting membrane peeling for idiopathic macular
hole. Acta Ophthalmol Scand 2007;85(8):883-889.
https://doi.org/10.1111/j.1600-0420.2007.00973.x
PMid:17662096
|
|
|
|
|
43 Mochizuki N, Yamamoto T, Enaida H,
Ishibashi T, Yamashita H. Long-term outcomes of 3 surgical adjuvants used for
internal limiting membrane peeling in idiopathic macular hole surgery. Jpn J
Ophthalmol 2014;58(6):455-461.
https://doi.org/10.1007/s10384-014-0345-1
PMid:25201225
|
|
|
|
|
44 Karacorlu M, Ozdemir H, Arf Karacorlu S.
Does intravitreal triamcinolone acetonide-assisted peeling of the internal
limiting membrane effect the outcome of macular hole surgery? Graefes Arch
Clin Exp Ophthalmol 2005;243(8):754-757.
https://doi.org/10.1007/s00417-005-1133-x
PMid:15744526
|
|
|
|
|
45 Nomoto H, Shiraga F, Yamaji H, Fukuda K,
Baba T, Takasu I, Ohtsuki H. Macular hole surgery with triamcinolone
acetonide-assisted internal limiting membrane peeling: one-year results.
Retina 2008;28(3):427-432.
https://doi.org/10.1097/IAE.0b013e31815ec2f1
PMid:18327134
|
|
|
|
|
46 Tsipursky MS, Heller MA, De Souza SA, Gordon
AJ, Bryan JS, Ziemianski MC, Sell CH. Comparative evaluation of no dye
assistance, indocyanine green and triamcinolone acetonide for internal
limiting membrane peeling during macular hole surgery. Retina 2013;33(6):
1123-1131.
https://doi.org/10.1097/IAE.0b013e31827b63ce
PMid:23514800
|
|
|
|
|
47 Machida S, Toba Y, Nishimura T, Ohzeki
T, Murai K, Kurosaka D. Comparisons of cone electroretinograms after
indocyanine green-, brilliant blue G-, or triamcinolone acetonide-assisted
macular hole surgery. Graefes Arch Clin Exp Ophthalmol 2014;252(9):1423-1433.
https://doi.org/10.1007/s00417-014-2594-6
PMid:24584708
|
|
|
|
|
48 Caramoy A, Kirchhof B, Hahn M, Schroeder
S, Fauser S, Muether PS. Internal limiting membrane staining. Ophthalmology
2012;119(6): 1282-1283.e4.
https://doi.org/10.1016/j.ophtha.2012.02.039
PMid:22656892
|
|
|
|
|
49 Fu XJ. Application and prognosis of
inner limiting membrane peeling on macular hole. Guoji Yanke Zazhi (Int Eye
Sci) 2014;14(2):287-289.
|
|
|
|
|
50 Kumar A, Gogia V, Shah VM, Nag TC.
Comparative evaluation of anatomical and functional outcomes using brilliant
blue G versus triamcinolone assisted ILM peeling in macular hole surgery in
Indian population. Graefes Arch Clin Exp Ophthalmol 2011;249(7):987-995.
https://doi.org/10.1007/s00417-010-1609-1
PMid:21234585
|
|
|
|
|
51 Selton J, Hubert I, Latarche C,
Casillas-Gil M, Ouled-Moussa R, Berrod JP. Comparative results of macular hole
surgery with and without internal limiting membrane staining with Brilliant
Blue G. J Fr Ophtalmol 2012;35(6):397-401.
https://doi.org/10.1016/j.jfo.2011.08.015
PMid:22483760
|
|
|
|
|
52 Rüfer F, Frimpong-Boateng A, Bunse A,
Roider J. Comparison of ILM peeling with and without the use of indocyanine
green. Functional results for idiopathic macular hole after pars plana
vitrectomy. Ophthalmologe 2007;104(1):54-59.
https://doi.org/10.1007/s00347-006-1379-7
PMid:16835792
|
|
|
|
|
53 Meyer CH, Schmidt JC, Mennel S, Göddeke
E, Rübe K, Rodrigues EB, Kroll P. Anatomical and functional results after macular
hole surgery. Klin Monbl Augenheilkd 2008;225(3):220-226.
https://doi.org/10.1055/s-2008-1027240
PMid:18351537
|
|
|
|
|
54 Brasil OM, Brasil OF. Comparative analysis
of macular hole surgery followed by internal limiting membrane removal with
and without indocyanine green staining. Arq Bras Oftalmol 2006;69(2):157-160.
|
|
|
|
|
55 Yooh HS, Brooks HL Jr, Capone A Jr,
L'Hernault NL, Grossniklaus HE. Ultrastructural features of tissue removed
during idiopathic macular hole surgery. Am J Ophthalmol 1996;122(1):67-75.
https://doi.org/10.1016/S0002-9394(14)71965-8
|
|
|
|
|
56 Manousaridis K, Peter S, Mennel S. 20 g
PPV with indocyanine green-assisted ILM peeling versus 23 g PPV with
brilliant blue G-assisted ILM peeling for epiretinal membrane. Int Ophthalmol
2016;36(3):407-412.
https://doi.org/10.1007/s10792-015-0148-5
PMid:26499510
|
|
|
|
|
57 Faria MY, Ferreira NP, Mano S, Cristóvao
DM, Sousa DC, Monteiro-Grillo ME. Internal retinal layer thickness and macular
migration after internal limiting membrane peeling in macular hole surgery.
Eur J Ophthalmol 2018;28(3):311-316.
https://doi.org/10.5301/ejo.5001066
PMid:29108397
|
|
|
|
|
58 Feron EJ, Veckeneer M, Parys-van
Ginderdeuren R, van Lommel A, Melles GR, Stalmans P. Trypan blue staining of
epiretinal membranes in proliferative vitreoretinopathy. Arch Ophthalmol
2002;120(2):141-144.
https://doi.org/10.1001/archopht.120.2.141
PMid:11831915
|
|
|
|
|
59 Stevenson W, Prospero Ponce CM, Agarwal
DR, Gelman R, Christoforidis JB. Epiretinal membrane: optical coherence tomography-based
diagnosis and classification. Clin Ophthalmol 2016;10:527-534.
https://doi.org/10.2147/OPTH.S97722
PMid:27099458 PMCid:PMC4820189
|
|
|
|
|
60 Miguel AI, Legris A. Prognostic factors
of epiretinal membranes: a systematic review. J Fr Ophtalmol
2017;40(1):61-79.
https://doi.org/10.1016/j.jfo.2016.12.001
PMid:28089219
|
|
|
|
|
61 Musat O, Stefan C, Boariu AM, Colta D,
Cernat C, Alexandru L, Georgescu RD, Patoni IS, Timaru CM, De Algerino S.
Chromovitrectomy. Rom J Ophthalmol 2016;60(2):59-62.
|
|
|
|
|
62 Brazitikos PD, Katsimpris JM, Tsironi E,
Androudi S. Retinal nerve fiber layer thickness evaluation after trypan
blue-assisted macular surgery. Retina 2010;30(4):640-647.
https://doi.org/10.1097/IAE.0b013e3181c085ab
PMid:19952983
|
|
|
|
|
63 Raffaele N, Marchese A, Ghigo D.
Compared antioxidant activity among corticosteroids on cultured retinal
pigment epithelial cells. Graefes Arch Clin Exp Ophthalmol
2016;254(12):2411-2416.
https://doi.org/10.1007/s00417-016-3519-3
PMid:27743160
|
|
|
|
|
64 Siebelt M, Korthagen N, Wei W, Groen H,
Bastiaansen-Jenniskens Y, Müller C, Waarsing JH, de Jong M, Weinans H.
Triamcinolone acetonide activates an anti-inflammatory and folate receptor-positive
macrophage that prevents osteophytosis in vivo. Arthritis Res Ther
2015;17:352.
https://doi.org/10.1186/s13075-015-0865-1
PMid:26637220 PMCid:PMC4670534
|
|
|
|
|
65 Xiong TT, Li XL, Zhou YF, Song QQ, Zhang
RS, Lei L, Li XY. Glycosylation-enhanced biocompatibility of the
supramolecular hydrogel of an anti-inflammatory drug for topical suppression
of inflammation. Acta Biomater 2018;73:275-284.
https://doi.org/10.1016/j.actbio.2018.04.019
PMid:29660509
|
|
|
|
|
66 Wang JW, Chen SD, Zhang XL, Huang WB,
Jonas JB. Intravitreal triamcinolone acetonide, retinal microglia and retinal
ganglion cell apoptosis in the optic nerve crush model. Acta Ophthalmol
2016;94(5):e305-e311.
https://doi.org/10.1111/aos.12698
PMid:25708663
|
|
|
|
|
67 Azuma K, Noda Y, Hirasawa K, Ueta T. Brilliant
blue g-assisted internal limiting membrane peeling for macular hole: a
systematic review of literature and meta-analysis. Retina 2016;36(5):851-858.
https://doi.org/10.1097/IAE.0000000000000968
PMid:27115851
|
|
|
|
|
68 Ejstrup R, la Cour M, Heegaard S,
Kiilgaard JF. Toxicity profiles of subretinal indocyanine green, Brilliant
Blue G, and triamcinolone acetonide: a comparative study. Graefes Arch Clin Exp
Ophthalmol 2012;250(5):669-677.
https://doi.org/10.1007/s00417-011-1886-3
PMid:22173216
|
|
|
|
|
69 Creuzot-Garcher C, Acar N, Passemard M,
Bidot S, Bron A, Bretillon L. Functional and structural effect of
intravitreal indocyanine green, triamcinolone acetonide, trypan blue, and
brilliant blue G on rat retina. Retina 2010;30(8):1294-1301.
https://doi.org/10.1097/IAE.0b013e3181d205aa
PMid:20526232
|
|
|
|
|
70 Ueno A, Hisatomi T, Enaida H, Kagimoto
T, Mochizuki Y, Goto Y, Kubota T, Hata Y, Ishibashi T. Biocompatibility of
brilliant blue G in a rat model of subretinal injection. Retina
2007;27(4):499-504.
https://doi.org/10.1097/IAE.0b013e318030a129
PMid:17420705
|
|
|
|
|
71 Wu Y, Zhu W, Xu D, Li YH, Ba J, Zhang
XL, Wang F, Yu J. Indocyanine green-assisted internal limiting membrane peeling
in macular hole surgery: a meta-analysis. PLoS One 2012;7(11):e48405.
https://doi.org/10.1371/journal.pone.0048405
PMid:23144875 PMCid:PMC3492355
|
|