lndicating and predicting role of the horizontal C/D ratio in preclinical diabetic retinopathy associated with chronic angle-closure glaucoma
Ze-Long Zhong1,2,3, Song Chen1,2,3
1Department of Vitreoretinopathy, Tianjin Eye Hospital,Tianjin 300020, China
2Nankai Univesity Affilliated Eye Hospital, Tianjin 300020,China
3Clinical College of Ophthalmology, Tianjin Medical University, Tianjin 300020, China
Abstract● AlM: To observe morphological optic disc characteristics in patients with preclinical diabetic retinopathy (DR)associated with chronic angle-closure glaucoma (CACG).● METHODS: Twenty-two cases (43 eyes) of preclinical DR associated with CACG were enrolled in group A; 24 preclinical DR cases (46 eyes) were enrolled in group B;26 CACG cases (51 eyes) were enrolled in group C; and 49 normal controls (49 eyes) were enrolled in group D. All underwent optical coherence tomography to measure the horizontal C/D ratio (HCDR), C/D area ratio (CDaR), vertical C/D ratio (VCDR), rim area (RA), cup volume (CV), disc area(DA) and average retinal nerve fiber layer (RNFL) thickness.● RESULTS: The ages of groups A, B, C, and D were 67.60±3.36,66.78±3.33, 65.98±3.83, and 67.54±3.17y, respectively. The HCDR values in groups A, B, and C were distinct relative to those in group D (P<0.0001, P<0.01, and P<0.05,respectively). The HCDR values in group A were higher compared with those in groups B (P<0.0001) and D(P<0.0001); while these values were virtually identical statistically between groups A and C (P>0.05). The CDaR values in group A were higher in comparison to those in groups B and D (P<0.0001 in both groups); while these values were virtually identical statistically between groups A and C (P>0.05). The RA values in group A were smaller relative to those in groups B and D (P<0.0001 in both groups); while groups A and C were not distinct statistically (P>0.05). The CV values in group A were greater in comparison to those in groups B and D (P<0.0001 in both groups); while groups A and C were not distinct statistically (P>0.05). DA was not distinct for comparisons of two groups among the four groups (P>0.05). HCDR value correlated with mean nasal RNFL thickness (r=-0.909,P<0.0001), mean superior RNFL thickness (r=-0.866,P<0.0001), mean inferior RNFL thickness (r=-0.650,P<0.001) and mean temporal RNFL thickness (r=-0.562,P<0.01) in group A.● CONCLUSlON: The HCDR was a sensitive morphological parameter in detecting structural visual disc changes in preclinical DR associated with CACG, which can reflect optic nerve damage caused jointly by CACG and diabetes.A higher HCDR may predict optic nerve atrophy.
INTRODUCTION
I n the field of neuro-ophthalmology, it is important to detect morphological and structural changes to the optic disc early and sensitively. Ophthalmologic diseases related to diabetes mellitus (DM) and glaucoma are substantial threats to the vision and can even cause blindness. Diabetic retinopathy (DR), which is associated with genetic factors[1-5] and environmental factors[5-7] is one serious complication of DM.DR will cause the optic nerve head (ONH) to change in the structural and biochemical characteristics[8-9] and induce retinal cell injury, both of which can result in substantial damage to visual function. Glaucoma is a type of neurodegenerative disease characterized by morphological variations at the positions of ONH or retinal nerve fiber layer (RNFL) as well as damage in visual field[10]. Since the morphology of the optic disc can reflect the structure and function statuses of the optic nerve, we focused on determining indicators that reflect changes sensitively and effectively.
In previous studies, morphological ONH indexes were measured by various means of detection, including Heidelberg retinal tomography[9], stereoscopic optic disc photography,optical coherence tomography (OCT), scanning laser polarimetry, a retinal thickness analyzer, a confocal scanning laser ophthalmoscope, and so on[10-11]. OCT technology has developed quickly in recent years and features good repeatability. As a noninvasive examination, OCT can accurately detect the ONH and early morphological changes in the retina[12-13]. All morphological ONH indexes, such as the horizontal C/D ratio (HCDR), rim area (RA), vertical C/D ratio(VCDR), cup volume (CV), C/D area ratio (CDaR), disc area(DA), and so on, can be detected by using OCT.
At present, there are many reports regarding the use of OCT in detecting optic disc morphology, both of the ONH in glaucoma and in DR. Wang et al[14] reported that the combined detection of optic disc changes and peripapillary RNFL thickness was very important in the early diagnosis of glaucoma. Moreover, Anton et al[15] revealed that rim parameters were lower in patients who suffer from glaucoma than in normal subjects, and the C/D ratios were higher than in normal subjects. Furthermore, Pekel et al[16] found that patients with preclinical DR had a greater C/D ratio and more serious neurodegeneration injuries to the inner retina than normal subjects. However, the changes of the optic disc structure in preclinical DR associated with chronic angle-closure glaucoma(CACG) remain unclear.
Here, the morphological characteristics of the optic disc in patients with preclinical DR associated with CACG were retrospectively analyzed. Morphological optic disc indexes were detected by OCT, which are significant for the evaluation of structural integrity, functional status, and the degree of injury to the optic nerve.
SUBJECTS AND METHODS
Ethical Approval All the patients in this research consented in a written form. All the processes were conducted as per the Declaration of Helsinki. The methodology complied with the Hospital Ethics Committee.
Subjects We consecutively collected cases from the Han population in northern China from the years of 2015-2018 in our hospital. Twenty-two cases (43 eyes) with preclinical DR associated with CACG were enrolled in group A; 24 cases (46 eyes) with preclinical DR were enrolled in group B; 26 cases of CACG (51 eyes) were enrolled in group C; and 49 normal cases (49 normal eyes) were enrolled in group D.
Inclusion Criteria Patients with preclinical DR were included in accordance with these criteria: a fasting blood glucose ≥6.1 mmol/L, a 2-hour postprandial blood glucose≥11.1 mmol/L, the course of DM within 10y, and no DR in either eye. All the patients with DM were type 2. CACG patients were included in accordance with these criteria: ocular anatomical characteristics of angle-closure glaucoma, repeated mild-to-moderate symptoms of elevated intraocular pressure or no symptoms, a narrow angle and angle closure with high intraocular pressure, a optic disc similar to that in primary open angle glaucoma, visual field damage from late-stage progression, and no sign of ischemic damage caused by acute ocular hypertension in the anterior segment[12]. Normal cases were included in accordance with these criteria: no systemic disease, no history of diseases or history of surgical treatment,a cylinder correction within ±0.5 D, and a spherical refraction within ±0.5 D.
Exclusion Criteria All subjects that met the following criteria were excluded: mature cataract, corneal opacity,severe vitreous opacity, high myopia, retinopathy including DR, primary optic neuropathy, disc neovascularization,inflammatory ophthalmopathy, systemic collagenous diseases,ocular trauma history, eye surgery history, and laser treatment history.
Methods OPTOVUE OCT was used to detect the morphological parameters of all the observed structures. RTVue-100 spectraldomain (SD)-OCT (Optovue Inc., Fremont, CA, USA;software version 4.0.5.39), which included 26 000 axial scans(A-scans) per second as well as a 5-mm depth resolution (fullwidth half-maximum) in tissue, was utilized to measure the average peripapillary RNFL thickness and ONH parameters[17].ONH parameters including the optic DA, neuroretinal RA,CV, CDaR, HCDR, and VCDR were measured. An RNFL thickness map was generated based on the measurements obtained along a circle 3.45 mm in diameter centered on the optic disc[18].
SPSS 17.0 (SPSS Inc, Chicago, USA) was applied to conduct all the analyses. A P-value less than 0.05 was considered significant statistically. Data are expressed as the mean±standard deviation if the data were distributed normally according to the results of Kolmogorov-Smirnov test.Comparisons of classification variables (sex) were made by using the χ2 test. One-way analysis of variance (ANOVA)was used in this study, and Bonferroni correction was used to compare multiple types of data among the four groups.Dunnett's test was applied to compare the normal group with all the other three groups. For comparisons of two groups among the four groups, Mann-Whitney U test for nonparametric data would be adopted if the data were not distributed normally. The Pearson correlation analysis was applied in this study to examine the relationships existing between the ONH parameters and the average RNFL thickness among the four groups.
Table 1 The demographics of the enrolled subjects
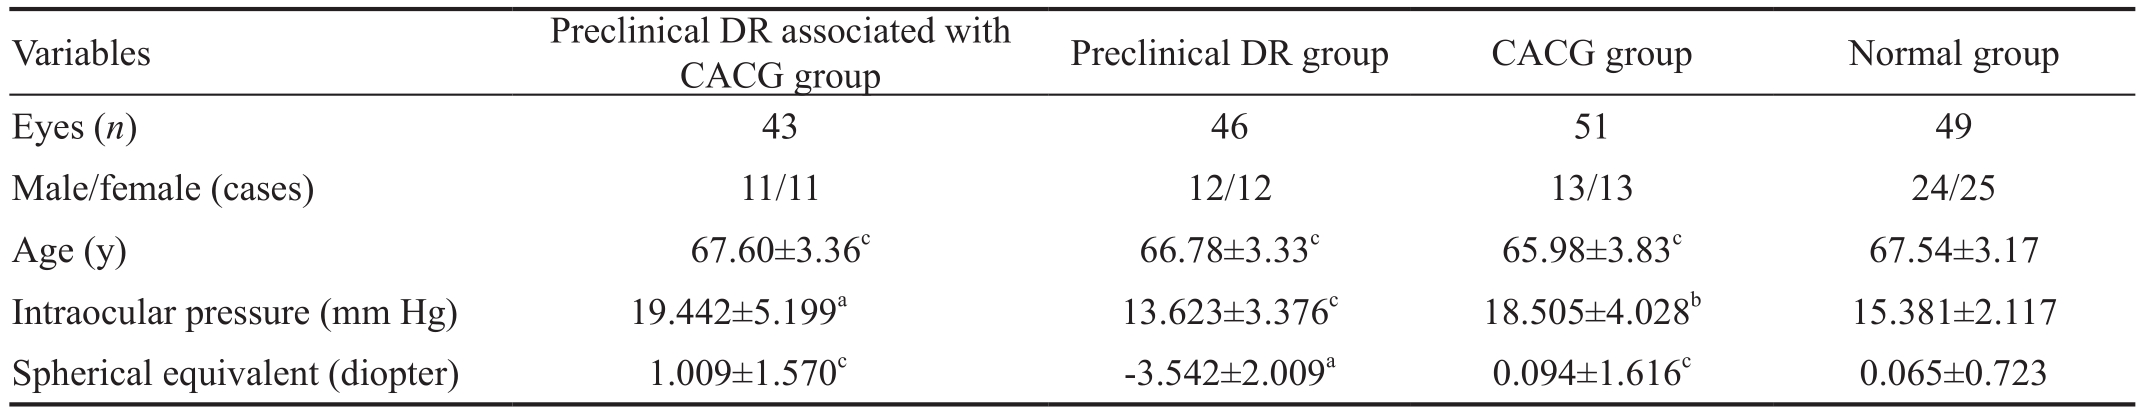
CACG: Chronic angle-closure glaucoma; DR: Diabetic retinopathy.aP<0.0001,bP<0.01,cP>0.05 vs normal group.
Variables Preclinical DR associated with CACG group Preclinical DR group CACG group Normal group Eyes (n) 43 46 51 49 Male/female (cases) 11/11 12/12 13/13 24/25 Age (y) 67.60±3.36c 66.78±3.33c 65.98±3.83c 67.54±3.17 Intraocular pressure (mm Hg) 19.442±5.199a 13.623±3.376c 18.505±4.028b 15.381±2.117 Spherical equivalent (diopter) 1.009±1.570c -3.542±2.009a 0.094±1.616c 0.065±0.723
Table 2 A comparison of optic disc morphological indexes (ONH parameters) among the four groups
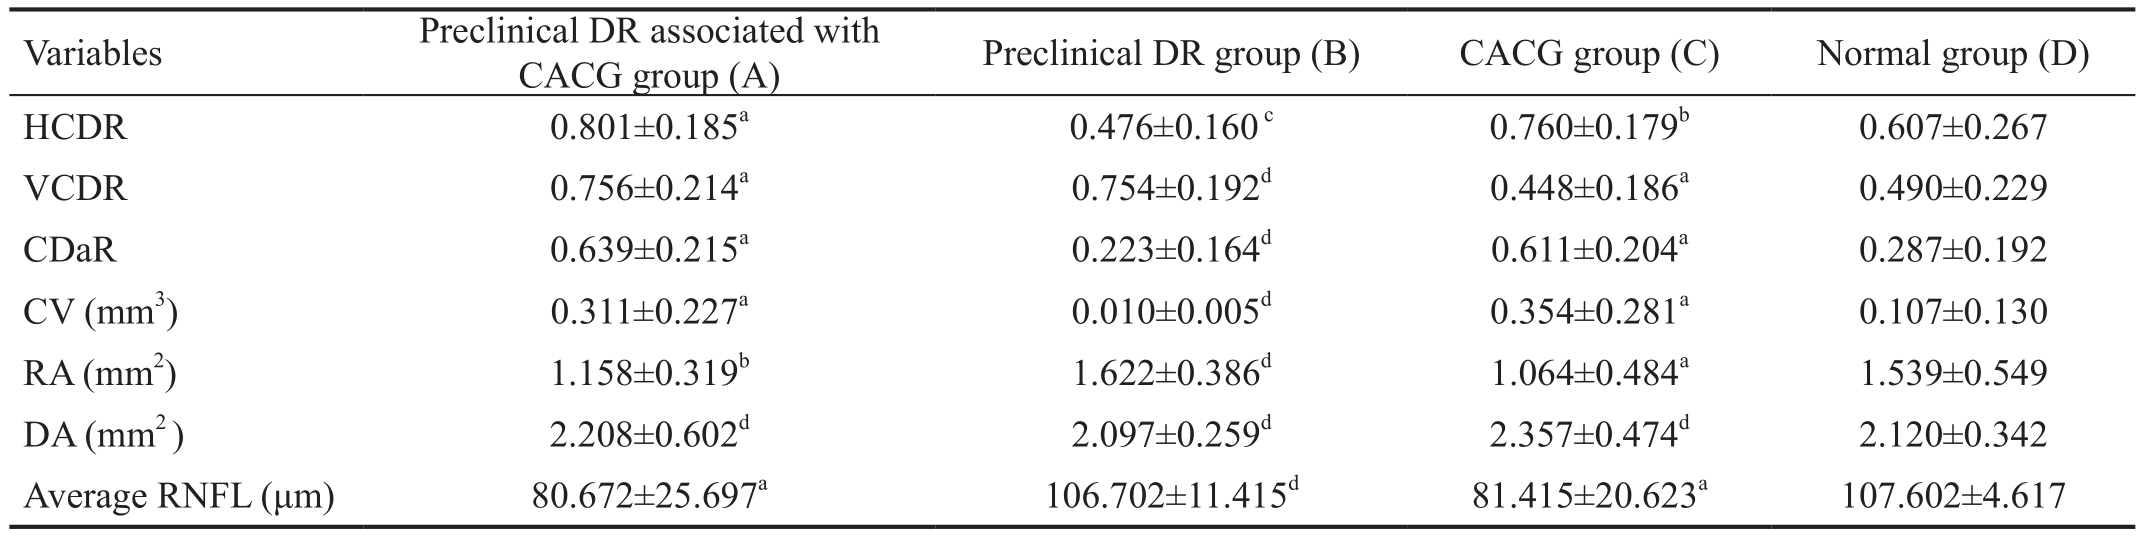
CACG: Chronic angle-closure glaucoma; CDaR: Cup-to-disc area ratio; DR: Diabetic retinopathy; CV: Cup volume; DA: Disc area; HCDR:Horizontal cup-to-disc ratio; ONH: Optic nerve head; RA: Rim area; VCDR: Vertical cup-to-disc ratio; RNFL: Retinal nerve fiber layer.
aP<0.0001,bP<0.01,cP<0.05,dP>0.05 vs normal group.
Variables Preclinical DR associated with CACG group (A) Preclinical DR group (B) CACG group (C) Normal group (D)HCDR 0.801±0.185a 0.476±0.160c 0.760±0.179b 0.607±0.267 VCDR 0.756±0.214a 0.754±0.192d 0.448±0.186a 0.490±0.229 CDaR 0.639±0.215a 0.223±0.164d 0.611±0.204a 0.287±0.192 CV (mm3) 0.311±0.227a 0.010±0.005d 0.354±0.281a 0.107±0.130 RA (mm2) 1.158±0.319b 1.622±0.386d 1.064±0.484a 1.539±0.549 DA (mm2 ) 2.208±0.602d 2.097±0.259d 2.357±0.474d 2.120±0.342 Average RNFL (μm) 80.672±25.697a 106.702±11.415d 81.415±20.623a 107.602±4.617
RESULTS
Comparisons of the Age in Group Pairs Among the Four Groups Among the groups A, B, C, and D, no statistical difference was found in age between any two groups (P>0.05),as shown in Table 1.
Comparisons of the Hozizontal Cup-to-disc Ratio Among the Four Groups The HCDR was significantly distinct between groups A and D (P<0.0001), groups B and D(P<0.01), and groups C and D (P<0.05). The HCDR values in group A were higher in comparison to those in groups B and D (P<0.0001 in both groups), while groups A and C were not distinct statistically (P>0.05; Table 2).
Comparisons of the Vertical Cup-to-disc Ratio Among the Four Groups The VCDR values were significantly distinct between groups A and D (P<0.0001) and between groups C and D (P<0.001), but these values were not distinct statistically between groups B and D (P>0.05). Moreover, the VCDR values in group A were higher relative to those in groups B(P<0.0001) and D (P<0.001), but these values were not distinct statistically between groups A and C (P>0.05; Table 2).
Comparisons of the Cup-to-disc Area Ratio Among the Four Groups The CDaR values were significantly distinct between groups A and D (P<0.0001) and between groups C and D (P<0.001). However, these values were not distinct statistically between groups B and D (P>0.05). Moreover, the CDaR values in group A were higher than those in groups B and D (P<0.0001 in both groups), but these values were not distinct statistically between groups A and C (P>0.05; Table 2).
Comparisons of the Cup Volume Among the Four Groups The CV values were significantly distinct between groups A and D (P<0.0001) and between groups C and D (P<0.001);however, these values were not distinct statistically between groups B and D (P>0.05). The CV values in group A were greater than those in groups B and D (P<0.0001 in both groups), while these values were not distinct statistically between groups A and C (P>0.05; Table 2).
Comparisons of the Rim Area Among the Four Groups Statistically significant differences in the RA were found between groups A and D (P<0.0001) and between groups C and D (P<0.001); while no difference was found between groups B and D (P>0.05). Moreover, the RA values in group A were less relative to those in groups B (P<0.0001) and D (P<0.01), but no difference was found in the RA values between groups A and C (P>0.05; Table 2).
Comparisons of the Disc Area Among the Four Groups The DA values were not significantly distinct between groups A and D (P>0.05), groups B and D (P>0.05), and groups C and D (P>0.05). Moreover, these values were not significantly distinct between groups A and B, groups A and C, or groups A and D (P>0.05 in the three cases; Table 2).
Correlations Between ONH Parameters and Average RNFL Thicknesses Among the Four Groups The VCDR,CDaR, RA, HCDR, and DA values all correlated with average RNFL thickness (P<0.05) in group A. The DA value was correlated with that thickness (P<0.05) in group B. The CDaR,RA, VCDR, CV, HCDR, and DA values all correlated with thatthickness (P<0.05) in group C. The CV, RA, and DA values all correlated with that thickness (P<0.05) in group D (Table 3).
Table 3 Correlation between ONH parameters and the average RNFL thickness among the four groups

CACG: Chronic angle-closure glaucoma; CDaR: Cup-to-disc area ratio; DR: Diabetic retinopathy; DA: Disc area; CV: Cup volume; HCDR:Horizontal cup-to-disc ratio; ONH: Optic nerve head; RA: Rim area; VCDR: Vertical cup-to-disc ratio; RNFL: Retinal nerve fiber layer.
Variables Preclinical DR associated with CACG group (A) Preclinical DR group (B) CACG group (C) Normal group (D) HCDR -0.668 <0.0001 0.278 >0.05 -0.612 <0.01 -0.034 >0.05 VCDR -0.863 <0.0001 0.033 >0.05 -0.732 <0.0001 -0.253 >0.05 CDaR -0.821 <0.0001 0.136 >0.05 -0.810 <0.0001 -0.326 >0.05 CV (mm3) -0.143 >0.05 0.267 >0.05 -0.672 <0.0001 -0.447 <0.01 RA (mm2) 0.780 <0.0001 0.022 >0.05 0.787 <0.0001 0.409 <0.05 DA (mm2) 0.441 <0.05 0.371 <0.05 -0.557 <0.05 -0.145 <0.05
Table 4 Correlation between HCDR values and the RNFL thickness of four quadrants in the preclinical DR associated with CACG group
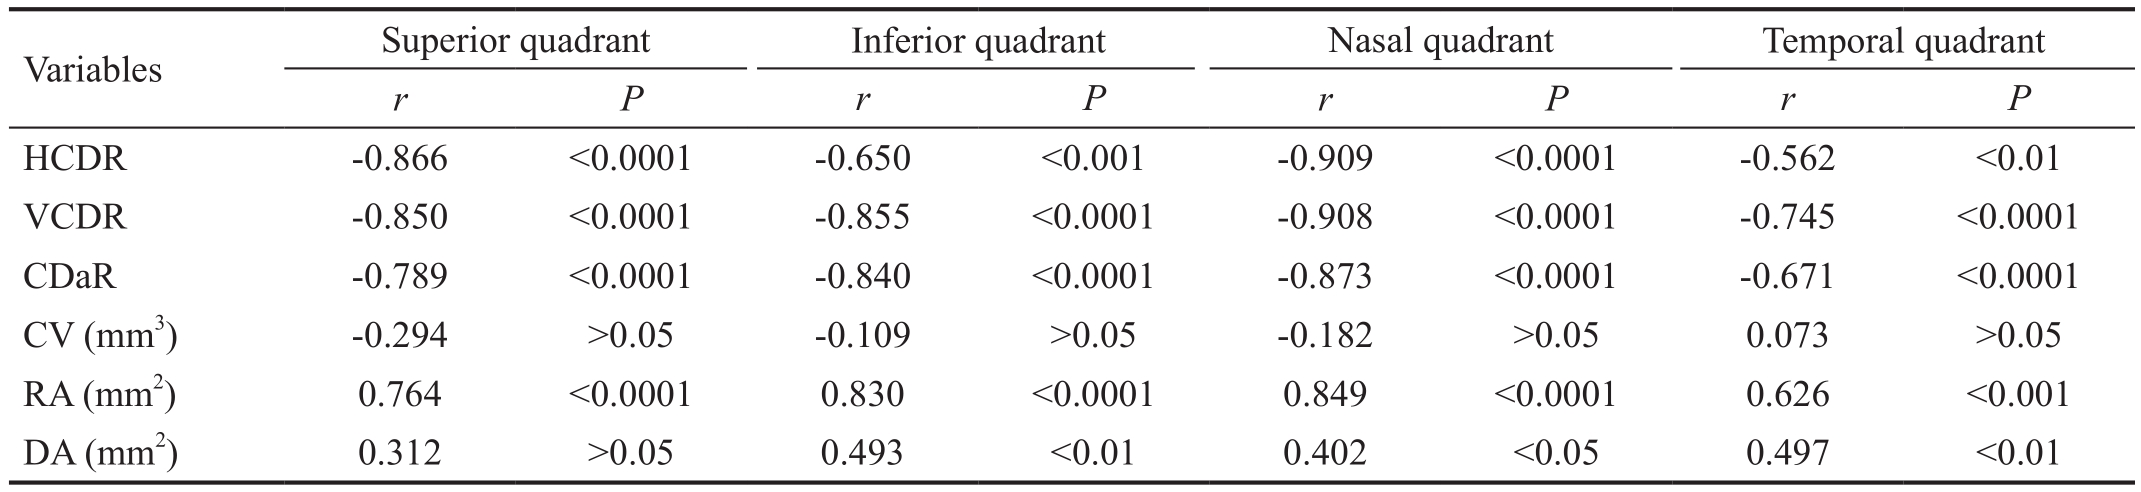
CACG: Chronic angle-closure glaucoma; CDaR: Cup-to-disc area ratio; DR: Diabetic retinopathy; DA: Disc area; CV: Cup volume; HCDR:Horizontal cup-to-disc ratio; RA: Rim area; VCDR: Vertical cup-to-disc ratio; RNFL: Retinal nerve fiber layer.
Variables Superior quadrant Inferior quadrant Nasal quadrant Temporal quadrant r P r P r P r P HCDR -0.866 <0.0001 -0.650 <0.001 -0.909 <0.0001 -0.562 <0.01 VCDR -0.850 <0.0001 -0.855 <0.0001 -0.908 <0.0001 -0.745 <0.0001 CDaR -0.789 <0.0001 -0.840 <0.0001 -0.873 <0.0001 -0.671 <0.0001 CV (mm3) -0.294 >0.05 -0.109 >0.05 -0.182 >0.05 0.073 >0.05 RA (mm2) 0.764 <0.0001 0.830 <0.0001 0.849 <0.0001 0.626 <0.001 DA (mm2) 0.312 >0.05 0.493 <0.01 0.402 <0.05 0.497 <0.01
Correlation Between HCDR Values and the Mean RNFL Thickness of Every Quadrant in the Preclinical DR Associated with CACG Group The HCDR, VCDR, CDaR and RA values all correlated with the mean RNFL thickness of nasal quadrant (P<0.0001) in group A. The HCDR, VCDR,CDaR, and RA values all correlated with that thickness of superior quadrant (P<0.0001) in group A. The VCDR, CDaR,RA, HCDR and DA values all correlated with that thickness of inferior quadrant (P<0.01) in group A. The VCDR, CDaR,RA, HCDR and DA values all correlated with that thickness of temporal quadrant (P<0.01) in group A (Table 4).
DISCUSSION
In this study, morphological parameters of the optic disc were quantitatively analyzed by OCT. OCT can determine sensitive parameters for the early detection of morphological and structural changes to the optic disc in the patients with preclinical DR associated with CACG.
Fifirstly, we found that the HCDR values were higher in the patients who suffer from preclinical DR associated with CACG relative to the controls (P<0.0001). The HCDR values were lower in the patients with preclinical DR relative to the controls (P<0.01); and the HCDR values were higher in the patients with CACG relative to the controls (P<0.05).Our results agree with that found by Anton et al[15] in which the HCDR values of patients who suffer from glaucoma were higher than those of normal individuals. Bellezza et al[18] indicated that initial axonal damage to the ONH could lead to cupping and visual loss caused by retinal ganglion cell apoptosis. We speculate that early DM and CACG can jointly cause retinal ganglion cell apoptosis, which eventually exacerbates cupping and visual field damage. In early DM,damage to retinal and other neurons has already occurred before pathological changes occur in the retina. This may be related to three effects of DM: the loss of ganglion and stellate cells, the toxic reaction caused by high glucose levels, and Müller cell dysfunction[19]. Moreover, retinal ganglion cell apoptosis caused pathological changes in RNFL thickness and optic nerve damage in patients with glaucoma[20]. This proved that pathological processes in early DM and CACG could play a combined role in morphological and structural changes to the optic disc.
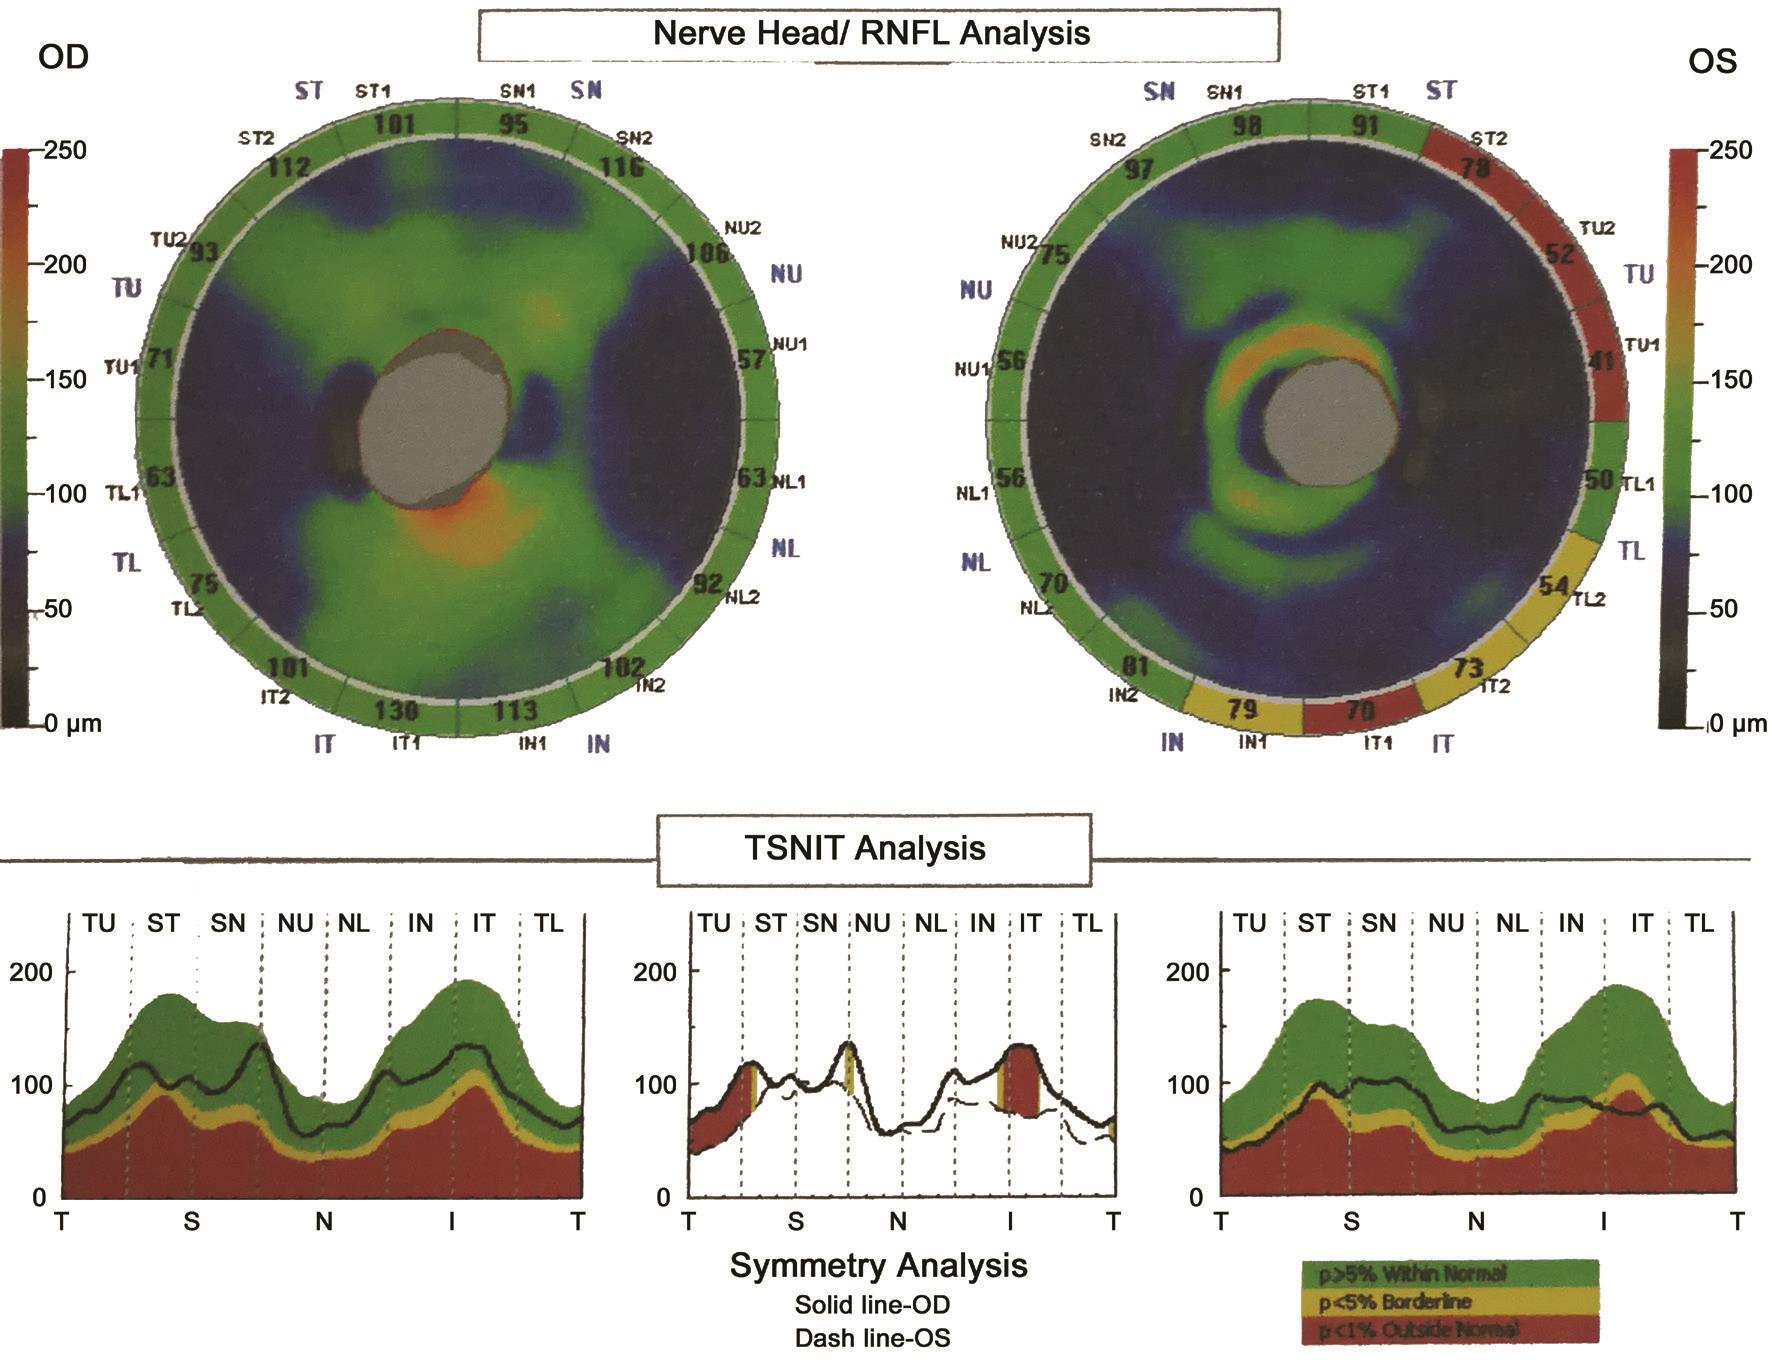
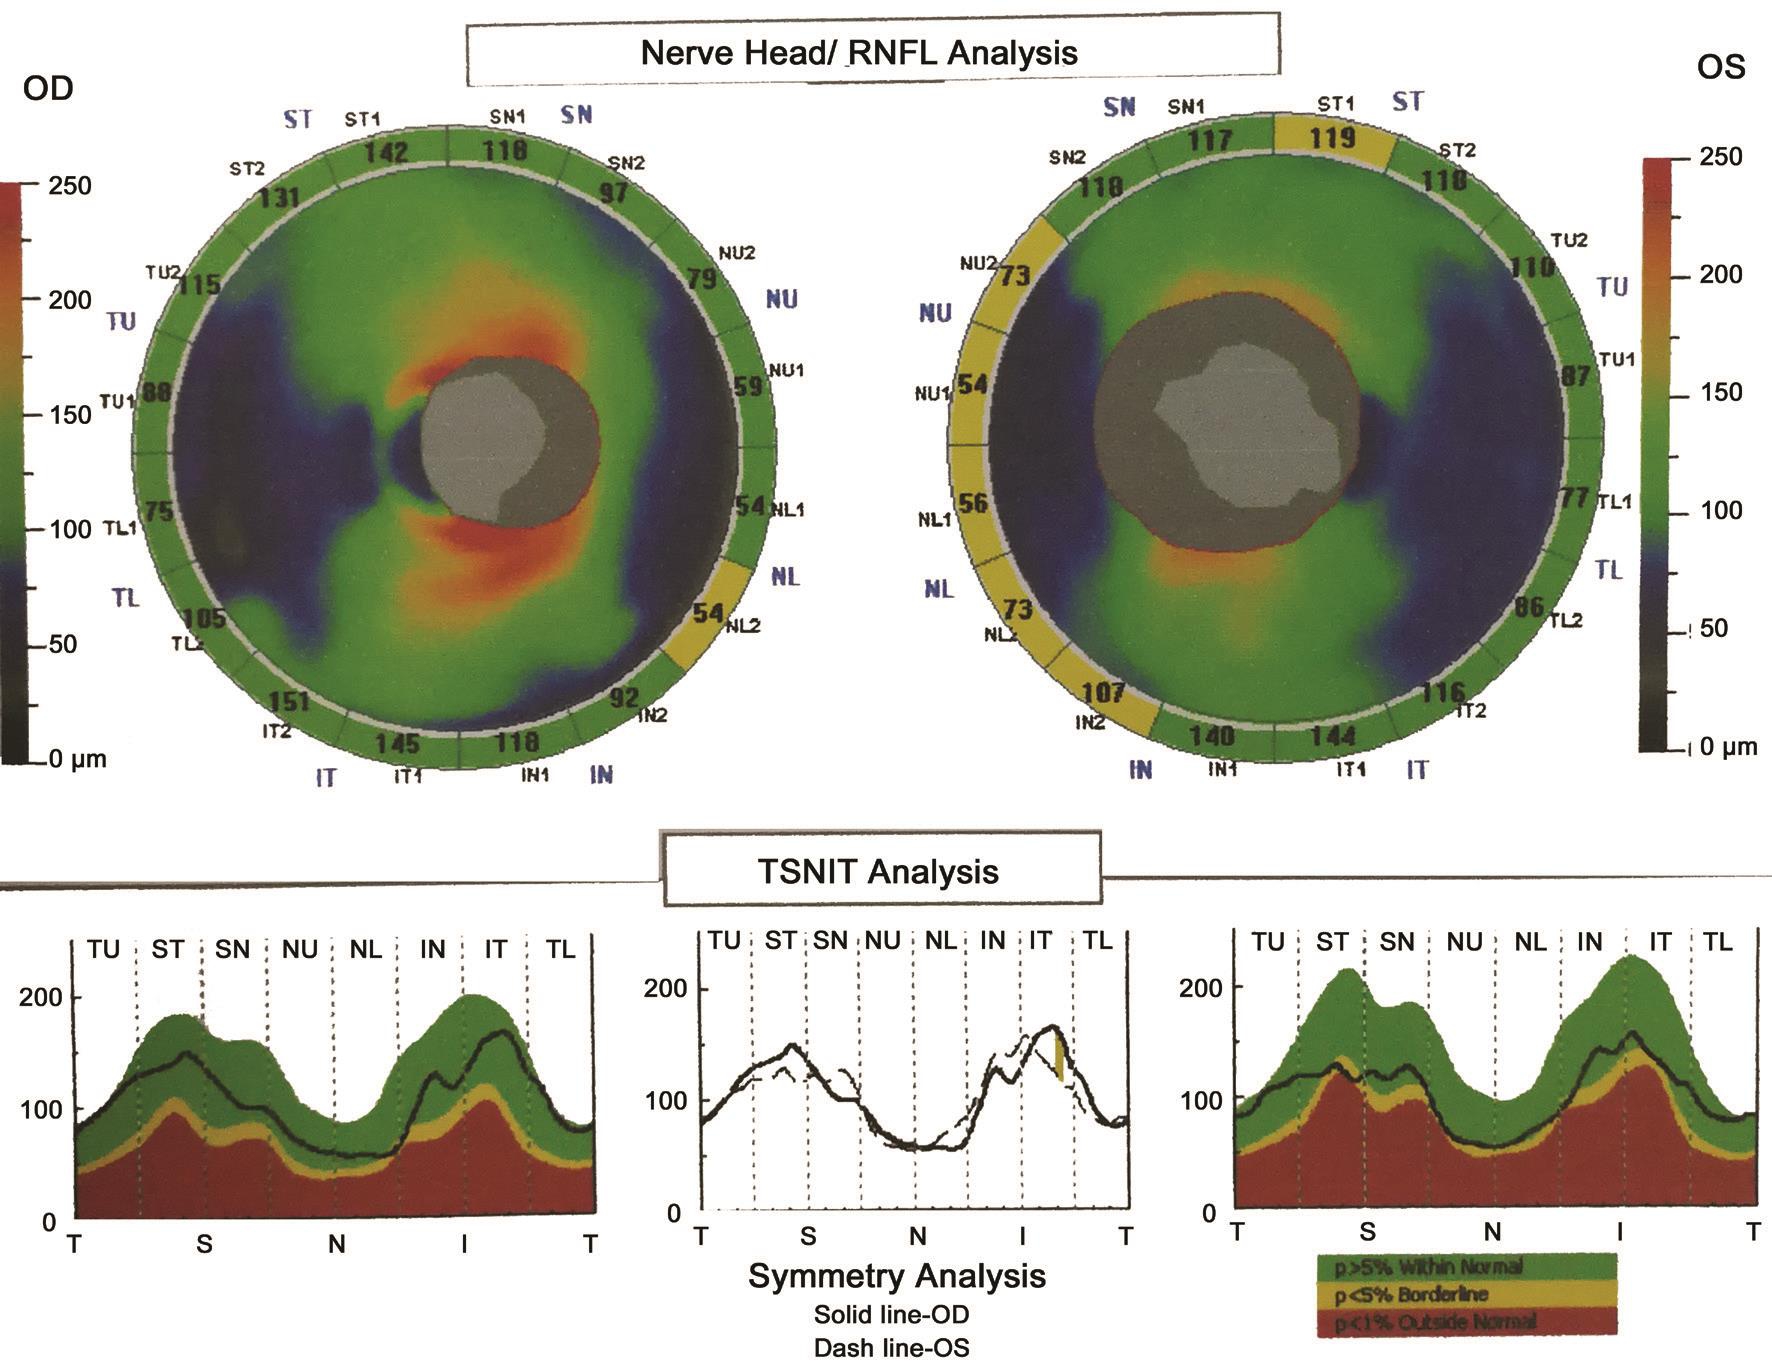
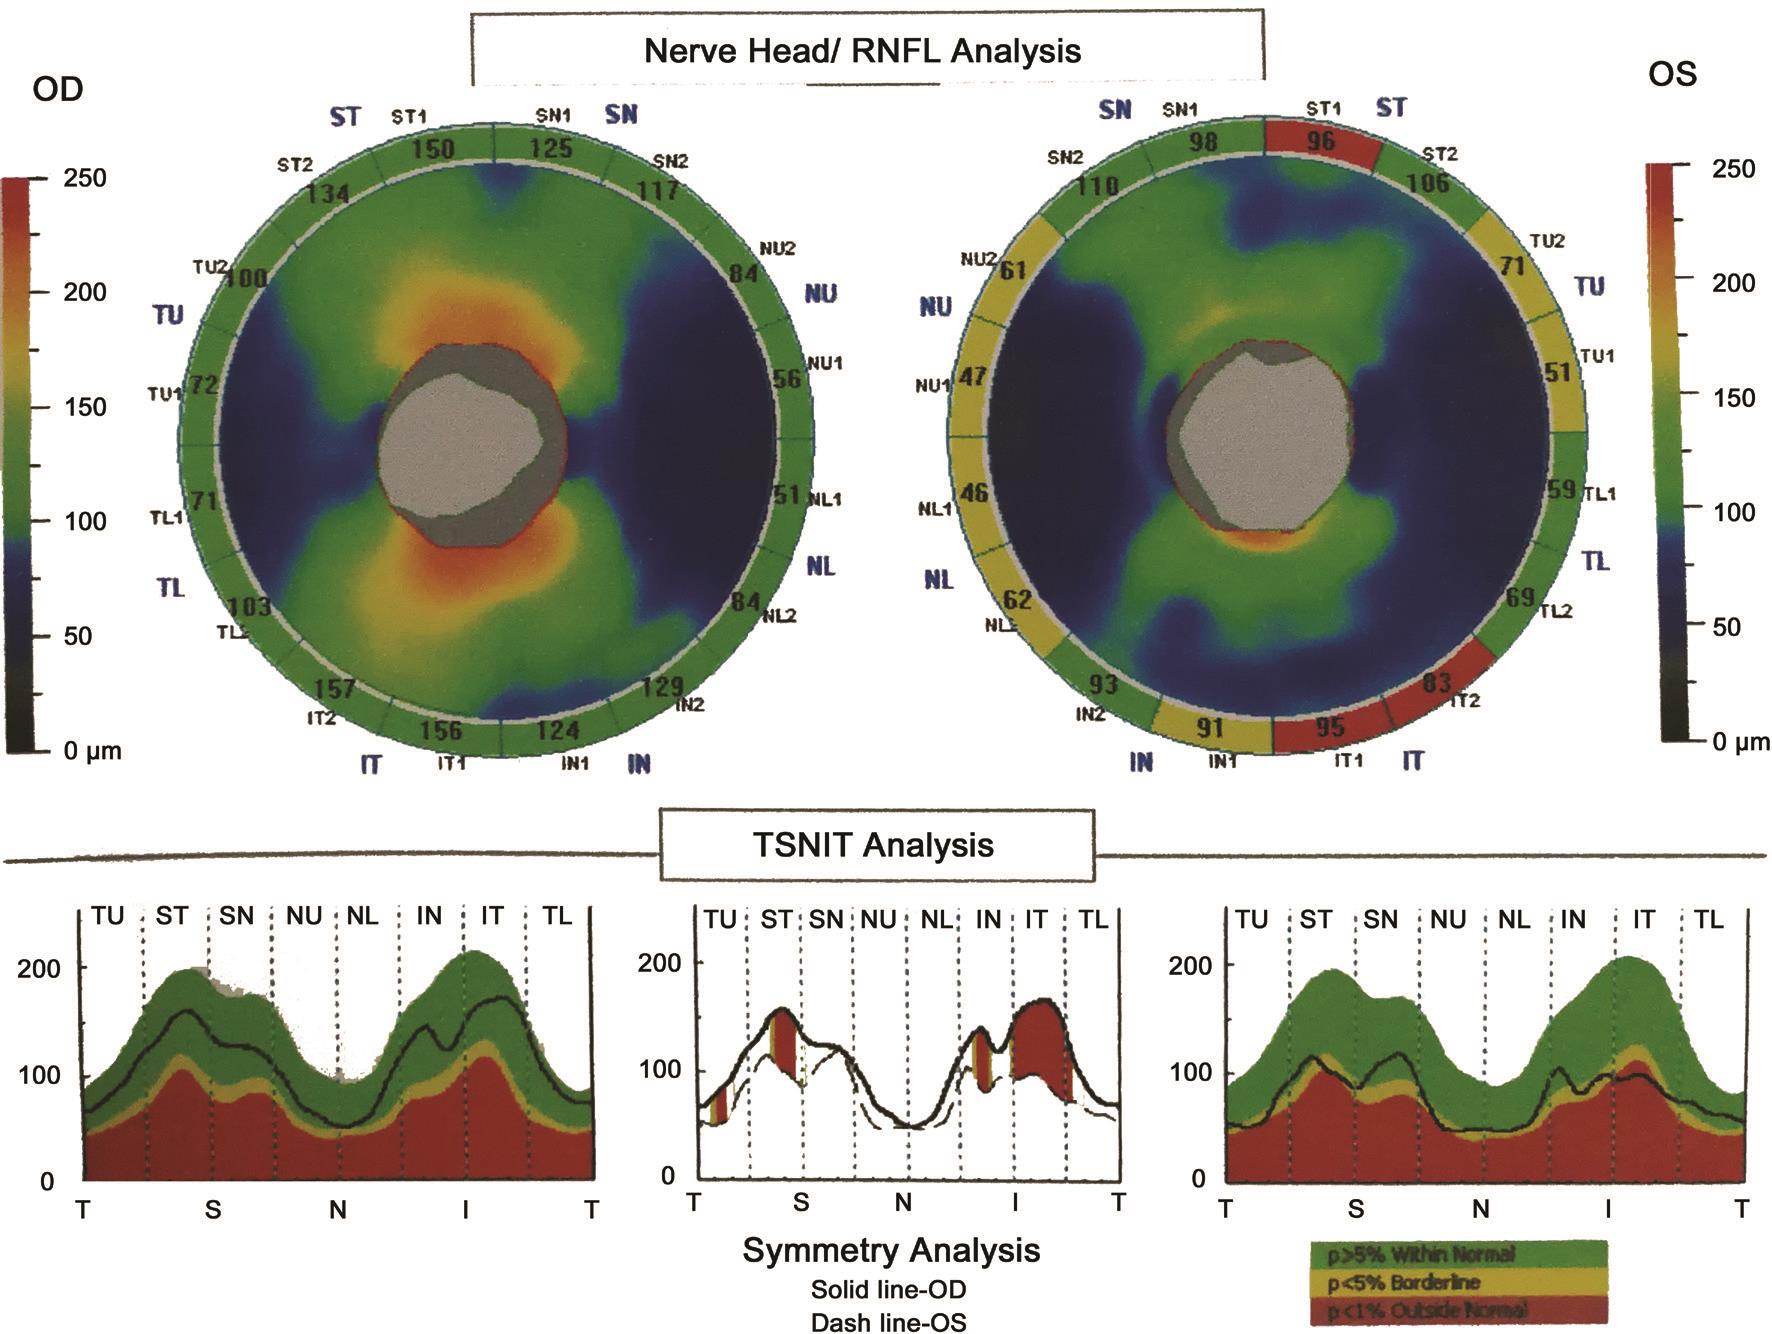
Previous research showed that combining the VCDR and number of nerve fiber layer neural networks best assessed neural damage caused by glaucomatous disease with respect to sensitivity and specificity[21]. However, we found that the HCDR value (0.99) was higher than the VCDR value (0.87)and the CDaR value (0.84) in a patient with preclinical DR associated with CACG in this study (Figure 1). Furthermore,the nasal, superior and inferior RNFL thicknesses both became obviously thinner and the average RNFL thickness did not indicate optic nerve atrophy (Figure 1). We also found that the HCDR value correlated with average RNFL thickness (P<0.0001; Table 3) and mean RNFL thickness of every quadrant (P<0.01) in the patients with preclinical DR associated with CACG (Table 4). Moreover, we observed that a higher HCDR might predict optic nerve atrophy in the right eye of patients with preclinical DR associated with CACG(Figure 1) and in the left eye of patients with preclinical DR(Figure 2). Besides, we also found that a higher HCDR might indicate optic nerve atrophy in the left eye of patients with preclinical DR associated with CACG (Figure 1) and in the left eye in patients with CACG (Figure 3). Therefore, we conclude that a higher HCDR may indicate and predict the occurrence of optic nerve atrophy. The results in this study prove that the HCDR was significantly distinct among the other three groups,which provides a very sensitive parameter in all indicators of optic disc morphological changes in patients with preclinical DR associated with CACG. This result is an important reference value for the early detection of morphological and structural changes by OCT in patients with preclinical DR associated with CACG.
Additionally, we found that HCDR and CDaR values were higher in the group of preclinical DR associated with CACG relative to the CACG group (P<0.01), and that HCDR and CDaR values were higher in the CACG group compared with the normal group (P<0.01), which agree with those found by Anton et al[15] in which the HCDR and CDaR values of patients who suffer from glaucoma were higher than in normal individuals. It is suggested that the HCDR and CDaR are important indicators of morphological and structural damage to the optic nerve in CACG, which may be of great importance in evaluating the occurrence, development, and prognosis of CACG.Another discovery in this study was that the differences between the HCDR, VCDR, CDaR, CV and RA values in the preclinical DR associated with CACG group and those in the control group were significant statistically (P<0.0001), which suggested that the HCDR, VCDR, CDaR, CV and RA, reflect the degree of optic nerve injury caused jointly by CACG and DM. Moreover, our research showed that the VCDR in the preclinical DR group was larger in comparison with the control group (P>0.05), according to a report by Pekel et al[16]. Therefore,the VCDR is a sensitive index that reflects morphological changes in the optic disc as well as degree of optic nerve injury caused by DM.
In addition to the above findings, we also revealed that the RA was greater in patients who suffer from preclinical DR in comparison with the normal group (P>0.05). It has been reported that the RA and disc volume of patients with DM associated with CACG were larger than those of normal individuals by using a Heidelberg retina analyzer[8]. This may be associated with optic nerve swelling, which has a protective effect on the optic nerve and RNFL in open angle glaucoma[8].Our results are different from the findings of these previous reports; probable reasons may include the different research subjects and testing instruments. We speculate that there is an association between increased RA values and swelling of the optic nerve in patients with preclinical DR. Therefore, further research in a larger sample and different methodological studies are needed to confirm these findings.
While some new discoveries were made in this study, there are also some limitations. One is the lack of random sampling,which may have led to a selection bias; thus, multicenter research is needed for further confirmation. Next, the sample size was relatively small. However, these samples were analyzed with correct statistical methods, and with reliable results. Larger samples are needed to verify the results in the patients with preclinical DR associated with CACG or in the patients with DR associated with CACG. Moreover, only samples from the Han population in northern China were selected for this study, which cannot reflect the characteristics of the general population. More research on morphological characteristics of the optic disc needs to be performed by experts in different populations worldwide to confirm the clinical features in patients with preclinical DR associated with CACG.In conclusion, the HCDR was a sensitive parameter for the detection of changes in the visual disc structure and the degree of damage in patients with preclinical DR associated with CACG. A higher HCDR can indicate structural changes in the optic nerve at an earlier time and predict the occurrence of optic nerve atrophy in these patients. This finding may provide a reference value for early diagnoses, detections of disease progression, and prognostic evaluations of DR, glaucoma, and other neuro-ophthalmic diseases.
ACKNOWLEDGEMENTS
We thank all the editors and anonymous reviewers in relation to this paper in the course of its preparation.
Conflicts of Interest: Zhong ZL, None; Chen S, None.
REFERENCES
1 Tayyab M, Maqsood SI, Azam A, Muslim I, Agha Z, Shafique S, Ahmed W,Niazi MK, Ishaq M, Waheed NK, Azam M, Qamar R. ATF6 polymorphisms and protective effect in diabetic retinopathy. Meta Gene 2018;17:56-60.
2 Lu QK, Zhang JT, Zhao N, Wang HY, Tong QH, Wang SL. Association of IL-6 gene (-174 and -572 G/C) polymorphisms with proliferative diabetic retinopathy of type 2 diabetes in a Chinese population.Ophthalmic Res 2017;58(3):162-167.
3 Kamal A, Abu Eleinen K, Siam I. Association of vascular endothelial growth factor -634G/C and receptor for advanced glycation end products G82S gene polymorphisms with diabetic retinopathy. Int J Ophthalmol 2016;9(8):1106-1111.
4 Li J, Hu YH. Susceptibility genes for diabetic retinopathy. Int J Ophthalmol 2009;2(1):1-6.
5 Zhong ZL, Chen S. Plasma plasminogen activator inhibitor-1 is associated with end-stage proliferative diabetic retinopathy in the Northern Chinese Han population. Exp Diabetes Res 2012;2012:350852.
6 Zhong ZL, Han M, Chen S. Risk factors associated with retinal neovascularization of diabetic retinopathy in type 2 diabetes mellitus. Int J Ophthalmol 2011;4(2):182-185.
7 Yan ZP, Ma JX. Risk factors for diabetic retinopathy in northern Chinese patients with type 2 diabetes mellitus. Int J Ophthalmol 2016;9(8):1194-1199.
8 Terai N, Spoerl E, Haustein M, Hornykewycz K, Haentzschel J, Pillunat LE. Diabetes mellitus affects biomechanical properties of the optic nerve head in the rat. Ophthalmic Res 2012;47(4):189-194.
9 Akkaya S, Can E, Öztürk F. Comparison of optic nerve head topographic parameters in patients with primary open-angle glaucoma with and without diabetes mellitus. J Glaucoma 2016;25(1):49-53.
10 Hasanreisoglu M, Priel E, Naveh L, Lusky M, Weinberger D,Benjamini Y, Gaton DD. Digital versus film stereo-photography for assessment of the optic nerve head in glaucoma and glaucoma suspect patients. J Glaucoma 2013;22(3):238-242.
11 Takahashi H, Chihara E. Impact of diabetic retinopathy on quantitative retinal nerve fiber layer measurement and glaucoma screening. Invest Ophthalmol Vis Sci 2008;49(2):687-692.
12 Chen YW, Li JF, Yan Y, Shen X. Diabetic macular morphology changes may occur in the early stage of diabetes. BMC Ophthalmol 2016;16:12.
13 Querques G, Lattanzio R, Querques L, Del Turco C, Forte R, Pierro L, Souied EH, Bandello F. Enhanced depth imaging optical coherence tomography in type 2 diabetes. Invest Ophthalmol Vis Sci 2012;53(10): 6017-6024.
14 Wang MW, Lu AT, Varma R, Schuman JS, Green field DS, Huang D,Advanced Imaging for Glaucoma Study Group. Combining information from 3 anatomic regions in the diagnosis of glaucoma with time-domain optical coherence tomography. J Glaucoma 2014;23(3):129-135.
15 Anton A, Moreno-Montañes J, Blázquez F, Alvarez A, Martín B,Molina B. Usefulness of optical coherence tomography parameters of the optic disc and the retinal nerve fiber layer to differentiate glaucomatous,ocular hypertensive, and normal eyes. J Glaucoma 2007;16(1):1-8.
16 Pekel E, Tufaner G, Kaya H, Kaşıkçı A, Deda G, Pekel G.Assessment of optic disc and ganglion cell layer in diabetes mellitus type 2. Medicine 2017;96:29(e7556).
17 Cennamo G, Forte R, Reibaldi M, Magli A, de Crecchio G, Cennamo G. Evaluation of retinal nerve fiber layer and ganglion cell complex thickness after ocular blunt trauma. Eye (Lond) 2013;27(12):1382-1387.
18 Bellezza AJ, Rintalan CJ, Thompson HW, Downs JC, Hart RT, Burgoyne CF. Deformation of the lamina cribrosa and anterior scleral canal wall in early experimental glaucoma. Invest Ophthalmol Vis Sci 2003;44(2):623-637.
19 Ibrahim AS, El-Remessy AB, Matragoon S, Zhang WB, Patel Y,Khan S, Al-Gayyar MM, El-Shishtawy MM, Liou GI. Retinal microglial activation and Inflammation induced by amadori-glycated albumin in a rat model of diabetes. Diabetes 2011;60(4):1122-1133.
20 Weinreb RN, Aung T, Medeiros FA. The pathophysiology and treatment of glaucoma: a review. JAMA 2014;311(18):1901-1911.
21 Vitale S, Smith TD, Quigley T, Kerrigan-Baumrind TA, Pease TE,Varma R, Friedman TS, Katz J, Tielsch JM. Screening performance of functional and structural measurements of neural damage in openangle glaucoma: a case-control study from the Baltimore Eye Survey. J Glaucoma 2000;9(5):346-356.
● KEYWORDS: optic nerve; diabetic retinopathy; chronic angle-closure glaucoma; angle closure; optical coherence tomography
Correspondence to: Song Chen. Department of Vitreoretinopathy, Tianjin Eye Hospital, Tianjin 300020,China. Chensong9999@126.com
Received: 2018-06-28 Accepted: 2018-11-19
DOl:10.18240/ijo.2019.02.13
Citation: Zhong ZL, Chen S. Indicating and predicting role of the horizontal C/D ratio in preclinical diabetic retinopathy associated with chronic angle-closure glaucoma. Int J Ophthalmol 2019;12(2):268-274