Relationship between contrast sensitivity and corneal shape following overnight orthokeratology
Li-Li Liu2, Li-Ping Gong3, Yue-Yuan Xu1, Xuan Zhu1,Kaddie Kwok Chen1,4, Wei-Feng Liu1
1The Third Affiliated Hospital of Nanchang University,Nanchang 330000, Jiangxi Province, China
2The Eye Hospital of Nanchang University, Nanchang 330000,Jiangxi Province, China
3The Second Affiliated Hospital of Nanchang University,Nanchang 330000, Jiangxi Province, China
4Department of Ophthalmology, University of California San Francisco, San Francisco, CA 94131, USA
Abstract● AlM: To evaluate the relationship between contrast sensitivity (CS) and corneal shape following overnight orthokeratology (OK).● METHODS: We conducted a retrospective clinical study of 80 lens-wearing myopia patients, all of whom had undergone OK and had been evaluated by Orbscan ll topography. We measured the surface irregularity index(SlRl) of corneal topography at 3 and 5 mm, the size of the fl attened central corneal curvature of OK lens (zone A), the size of the cornea altered by OK lens (zone B), the size of the pupillary area at the corneal level (zone C), the area of crossover between zones A and C (zone AC), the area of crossover between zones B and C (BC), the ratio of BC to B (BC/B), and the ratio of AC to C (AC/C). CS was evaluated using the CSV-1000 with spatial frequencies of 3,6, 12, and 18 cycles/degree (CPD).● RESULTS: Multiple correlation analyses indicated significant negative correlations between CS, zone C, BC/B,and 3-mm SlRl (all P<0.01). There were no significant differences between CS, zone B, AC/A, or 5-mm SlRl (P=0.60,0.94 and 0.11, respectively). Zone C was negatively correlated with 3, 6, 12, and 18 CPD. 5-mm SlRl were negatively correlated with 6, 12, and 18 CPD. BC/C was negatively correlated with 6 and 18 CPD. AC/C was positively correlated with 3 CPD.● CONCLUSlON: Zone C, 3-mm SlRl and BC/B affect the CS following overnight OK.
INTRODUCTION
O rthokeratology (OK) is a non-surgical clinical technique that makes use of a rigid contact lens to temporarily reshape the cornea for the purpose of reducing or eliminating refractive error. However, OK has been shown to cause decreases in the quality of vision[1-2], which caused mainly by fl attening the central cornea, included the position and the size of the base arc and reversal arc. Contrast sensitivity is an important clinical indicator of visual quality and function. It is unclear how much these parameters play a role in the decline in visual quality; thus this study used the relationship between the pattern changes and the contrast sensitivity (CS) of the corneal topography to explore the influence of different factors on the CS of different frequencies.
SUBJECTS AND METHODS
Ethical ApprovalThe study protocol was approved by the Institutional Review Board of the Third Affiliated Hospital of Nanchang University and complied with the tenets of the Declaration of Helsinki. The study was got the participants oral consent and no allowance.
Subjects A total of 80 subjects (n=149 eyes), all of whom wore OK (Boston XO lenses; Bausch and Lomb, Rochester,NY, USA) were enrolled. All subjects visited the Nanchang Eye Hospital and the Third Affiliated Hospital of Nanchang University, Nanchang, China, from August 2009 to August 2013. Inclusion criteria comprised of patients with no ocular diseases, refractive error between -1.00 to -6.00 diopters (D),astigmatism below 1.50 D, and corneal curvature between 8.23 to 7.41 mm. Exclusion criteria comprised of patients with eye disorders, enlarged pupils at night, the ratio of spherical to astigmatic powers greater than 2, and intraocular pressure greater than the normal range. Follow-up examinations included visual acuity, corneal topography, CS, lens and the anterior eye segment examination by slit lamp microscopy.
Table 1 Post-OK parameters mean±SD (range)
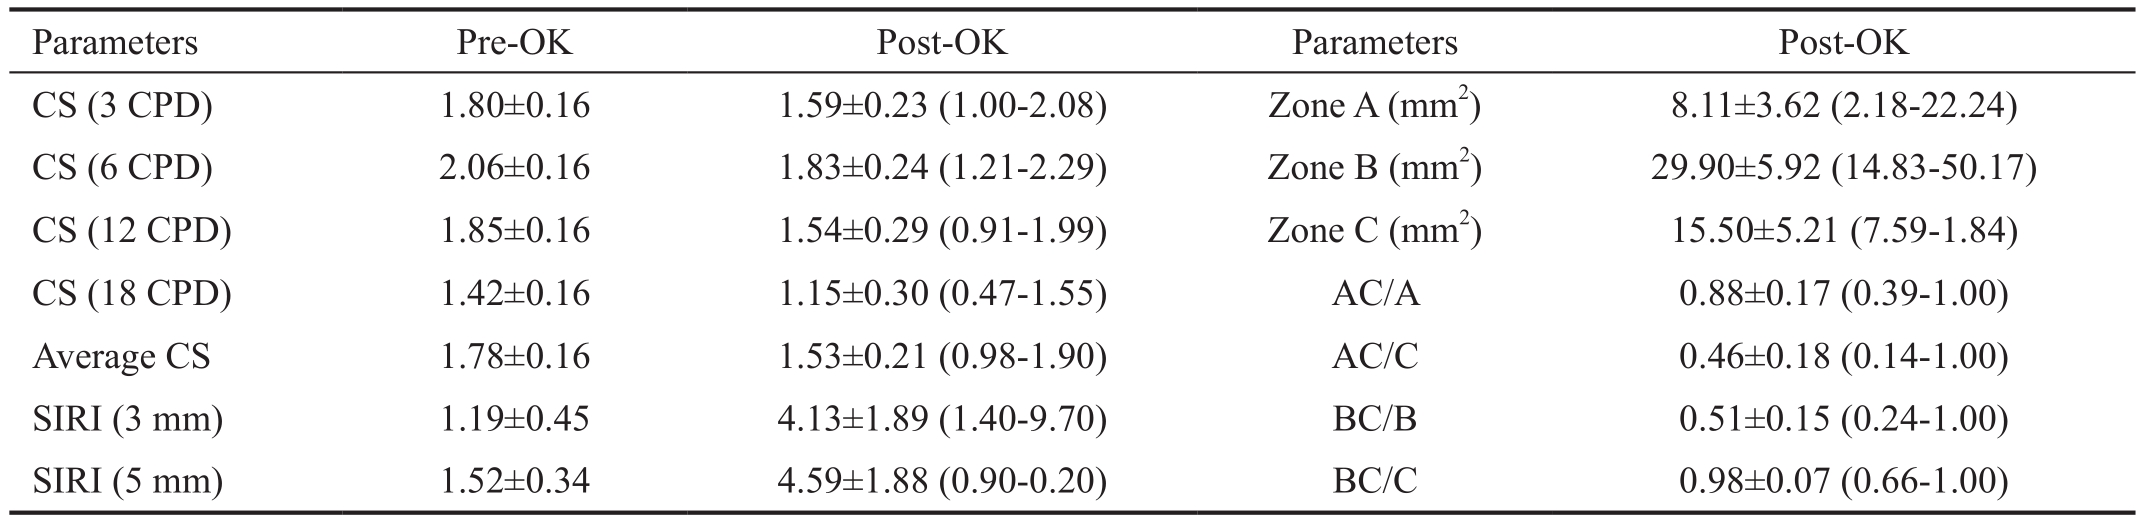
OK: Orthokeratology; CS: Contrast sensitivity; CPD: Cycles/degree; SIRI: Surface irregularity index.
 CS (3 CPD) 1.80±0.16 1.59±0.23 (1.00-2.08) Zone A (mm2) 8.11±3.62 (2.18-22.24)CS (6 CPD) 2.06±0.16 1.83±0.24 (1.21-2.29) Zone B (mm2) 29.90±5.92 (14.83-50.17)CS (12 CPD) 1.85±0.16 1.54±0.29 (0.91-1.99) Zone C (mm2) 15.50±5.21 (7.59-1.84)CS (18 CPD) 1.42±0.16 1.15±0.30 (0.47-1.55) AC/A 0.88±0.17 (0.39-1.00)Average CS 1.78±0.16 1.53±0.21 (0.98-1.90) AC/C 0.46±0.18 (0.14-1.00)SIRI (3 mm) 1.19±0.45 4.13±1.89 (1.40-9.70) BC/B 0.51±0.15 (0.24-1.00)SIRI (5 mm) 1.52±0.34 4.59±1.88 (0.90-0.20) BC/C 0.98±0.07 (0.66-1.00)
Contrast SensitivityCS was evaluated using the CSV-1000(Vector Vision, Inc., Ohio, USA), with spatial frequencies of 3, 6, 12, and 18 cycles/degree (CPD) under 85 lx/m2 and at a distance of 2.5 m. Values were transposed to logCS (http://www.vectorvision.com/html/educationCSV1000Norms.html).
Corneal Topography Corneal topography was determined using the Orbscan-II topographer (Bausch and Lomb, Inc.,USA). The surface irregularity indices (SIRIs) of corneal topography at 3 and 5 mm were analyzed.
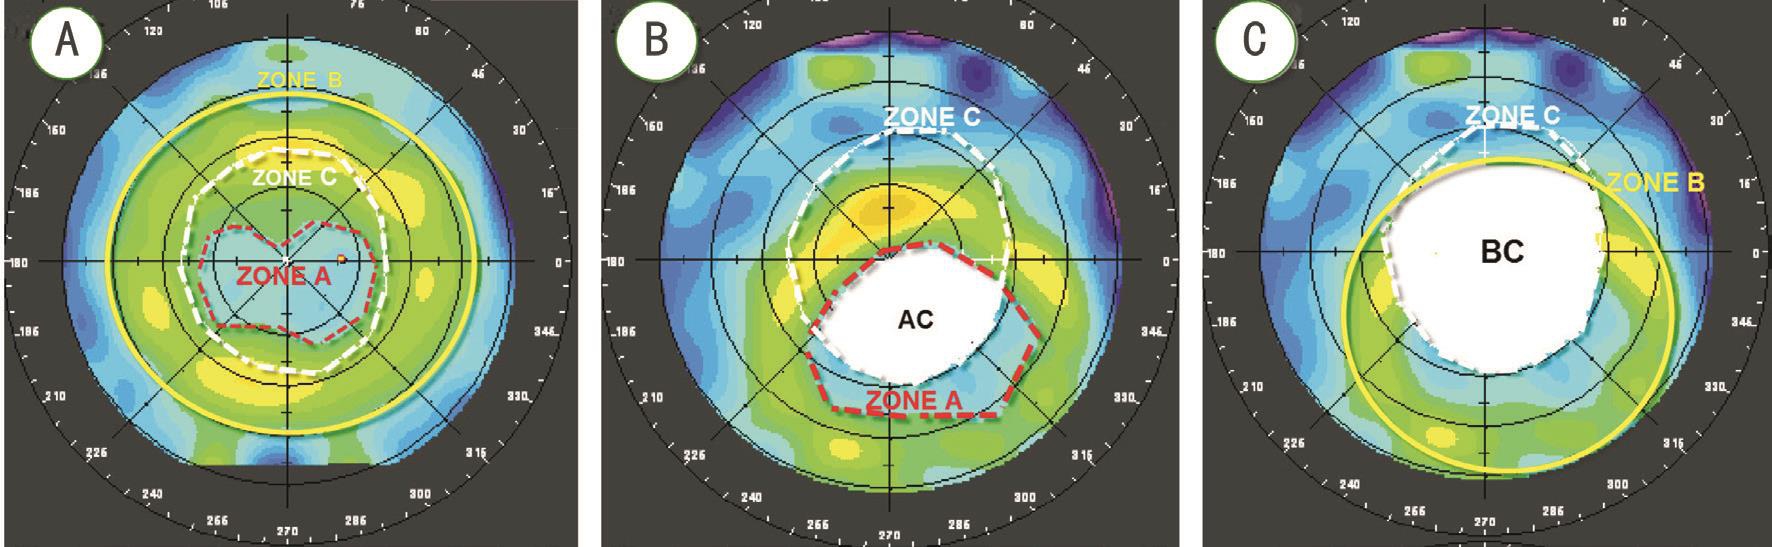
Corneal Zones Tomographic images of the corneal surface were divided into three zones. Zone A: size of the flattened central corneal curvature of OK lens; the reverse curve (RC)is the more deeply colored area surrounding zone A. Zone B:size of the cornea shaped by OK lens including zone A and zone RC. Zone C: size of the pupillary area at the corneal level(Figure 1A). Image J2x (Rawak Software, Inc., Germany)software was used to measure the size of zones A, B, and C(Figure 1A).
Location and Relationship Among Zones A, B, and C Zone AC was defined as the crossover area between zones A and C (Figure 1B). Zone BC was defined as the crossover area between zones B and C (Figure 1C). To describe the location and relationship between zones A and C, we calculated the ratios of AC to A (AC/A) and AC to C (AC/C). AC/A indicates the extent of deviation from zone A to zone C, and AC/C indicates the relationship between the size of zone A and zone C (Figure 1B). To describe the location and relationship between zones B and C, we calculated BC/B and BC/C. BC/B indicates the extent of deviation from the shaped corneal area to zone C, and BC/C indicates the relationship between the size of the shaped corneal area and zone C (Figure 1C).
Statistical Analysis Multiple correlation analyses among all corneal shape parameters and logCS were performed using version 13.0 SPSS software (SPSS, Inc., Chicago, IL, USA). A P-value of <0.05 was considered statistically significant.
RESULTS
Subjects ranged in age from 7 to 15y (mean 10.56±2.05y).Spherical equivalent (SE) ranged from -1.00 to -6.00 D (mean-3.06±1.21 D). Follow-up time ranged from 1 to 40mo (mean 11.29±9.22mo). Uncorrected visual acuity (UCVA) ranged from logMAR 2.0 to 0.2 (mean 0.72±0.30) and best-corrected visual acuity (BCVA) ranged from logMAR 0.1 to -0.5 (mean-0.008±0.049). Average logCS were 1.78±0.16 and 1.53±0.21 pre- and post-OK, respectively. The CS decreased in 3, 6,12, and 18 CPD after OK. The 20.1% (30/149) eyes kept the average CS of pre-treatment after OK. The 31.5% (47/149),33.5% (50/149), 26.8% (40/149) and 32.2% (48/149) eyes kept the normal CS in 3, 6, 12 and 18 CPD, respectively.Table 1 depicts data for CS, SIRI, and size of zones A, B, and C, as well as AC/A, AC/C, BC/B, and BC/C.
Table 2 Correlation of parameters of corneal shape to contrast sensitivity Pearson (P)
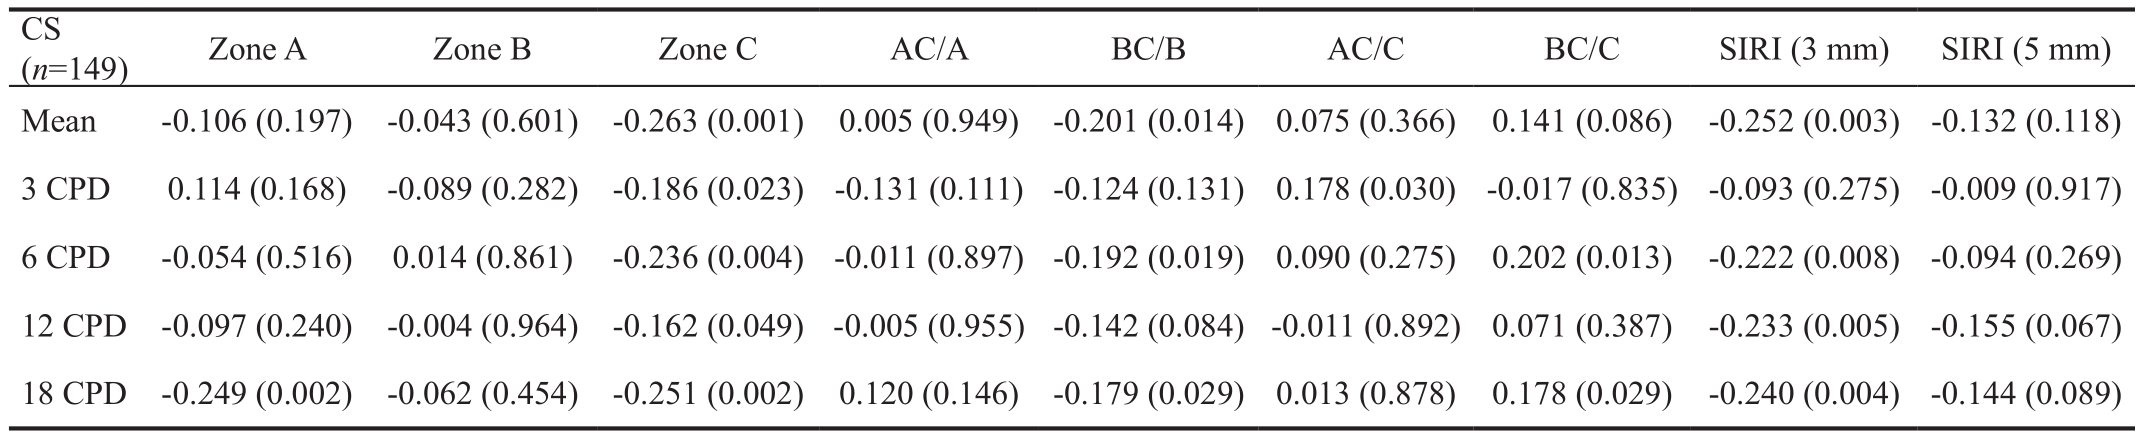
CS: Contrast sensitivity; CPD: Cycles/degree; SIRI: Surface irregularity index.
CS(n=149) Zone A Zone B Zone C AC/A BC/B AC/C BC/C SIRI (3 mm) SIRI (5 mm)Mean -0.106 (0.197) -0.043 (0.601) -0.263 (0.001) 0.005 (0.949) -0.201 (0.014) 0.075 (0.366) 0.141 (0.086) -0.252 (0.003) -0.132 (0.118)3 CPD 0.114 (0.168) -0.089 (0.282) -0.186 (0.023)-0.131 (0.111)-0.124 (0.131) 0.178 (0.030)-0.017 (0.835)-0.093 (0.275)-0.009 (0.917)6 CPD -0.054 (0.516) 0.014 (0.861) -0.236 (0.004)-0.011 (0.897)-0.192 (0.019) 0.090 (0.275) 0.202 (0.013) -0.222 (0.008)-0.094 (0.269)12 CPD -0.097 (0.240) -0.004 (0.964) -0.162 (0.049)-0.005 (0.955)-0.142 (0.084)-0.011 (0.892) 0.071 (0.387) -0.233 (0.005)-0.155 (0.067)18 CPD -0.249 (0.002) -0.062 (0.454) -0.251 (0.002) 0.120 (0.146) -0.179 (0.029) 0.013 (0.878) 0.178 (0.029) -0.240 (0.004)-0.144 (0.089)
Table 3 Parameters for typical cases
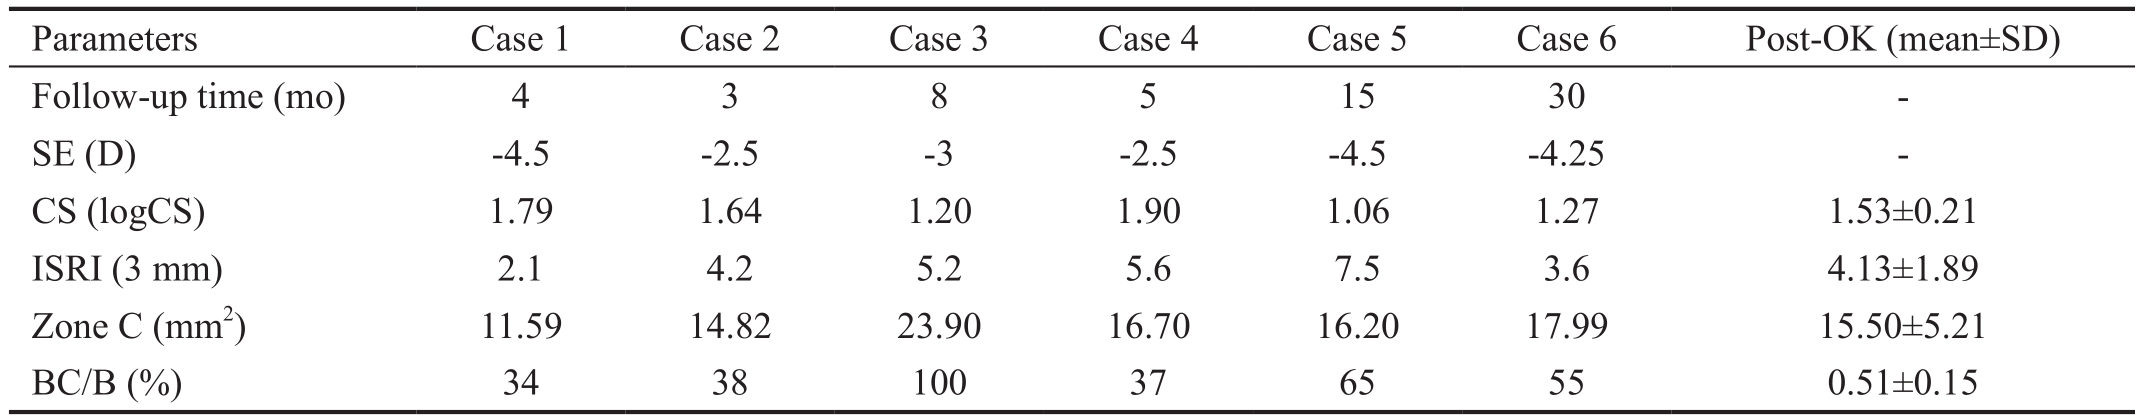
OK: Orthokeratology; SE: Spherical equivalent; CS: Contrast sensitivity.
 Follow-up time (mo) 4 3 8 5 15 30 -SE (D) -4.5 -2.5 -3 -2.5 -4.5 -4.25 -CS (logCS) 1.79 1.64 1.20 1.90 1.06 1.27 1.53±0.21 ISRI (3 mm) 2.1 4.2 5.2 5.6 7.5 3.6 4.13±1.89 Zone C (mm2) 11.59 14.82 23.90 16.70 16.20 17.99 15.50±5.21 BC/B (%) 34 38 100 37 65 55 0.51±0.15
Relationships Among Parameters of Corneal Shape and Contrast Sensitivity Multiple correlation analyses indicated significant negative correlations between logCS and zone C,BC/B, and 3-mm SIRI (all P<0.05). There were no significant correlations of logCS with zone B, AC/A, and 5-mm SIRI(P=0.601, 0.949, and 0.118, respectively). Only zone A demonstrated a negative correlation with 18 CPD (P=0.002).Zone C exhibited negative correlations with 3, 6, 12, and 18 CPD (all P<0.05). BC/C presented negative correlations with 6 and 18 CPD. AC/C had a positive correlation with 3 CPD(Table 2). SIRI 3-mm showed negative correlations with 6, 12,and 18 CPD.
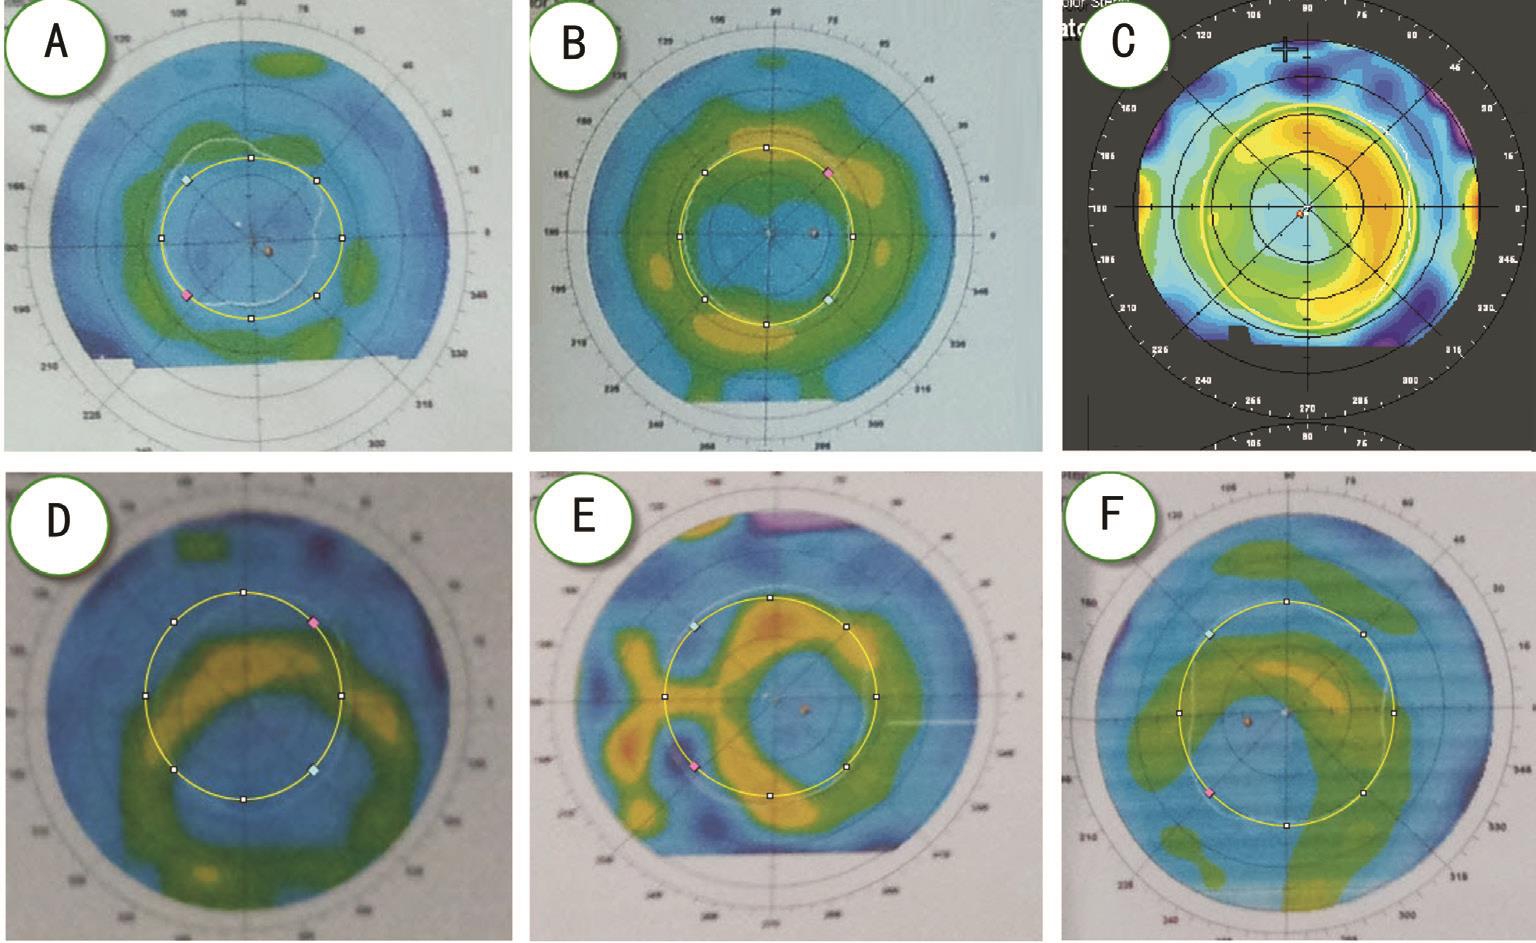
Analyses of Typical CasesWe analyzed the central shape(Cases 1-3) and the decentration shape (Cases 4-6) for zone C, BC/B, and 3-mm SIRI in three typical cases. All case parameters are presented in Table 3.
For Case 1 (Figure 2A), zones A and C were equal size. For Case 2 (Figure 2B), zone C was greater than zone A, but less than zone B. For Case 3 (Figure 2C), the size of zone C was greater than that of zone B. For Case 1, BC/B and 3-mm SIRI values were less than average post-treatment values, and this patient tested well for CS. For Case 2, post-treatment values for zone C and 3 mm SIRI were average, but BC/B was less than average; consequently, this patient had good CS. For Case 3, zone C, BC/B, and 3-mm SIRI demonstrated higher than average post-treatment values and, consequently, this patient had poor CS.
The centers of zones A and B deviated >0.5 mm from the central cornea. For Case 4 (Figure 2D), post-treatment values for zone C and 3-mm SIRI were approximately average, but BC/B was less than average; consequently, this case exhibited strong CS. For Case 5 (Figure 2E), post-treatment values for zone C, BC/B, and 3 mm SIRI were greater than average, and 3-mm SIRI increased to 7.5; thus, this case exhibited poor CS.For Case 6 (Figure 2F), although the post-treatment value for 3 mm SIRI was lower than the average value, values for zone C and BC/B were higher; consequently, this case also exhibited poor CS.
DISCUSSION
CS, unlike high contrast vision, is comprehensively reflective of visual quality[3]. Corneal shape-changing procedures, namely laser-assisted in situ keratomileusis (LASIK)[4] and OK,typically cause CS to decrease[5-6]. Similar to those studies, this study found that CS decreased in 3, 6, 12, and 18 CPD after OK, and further found that the changes in CS are not parallel to each CPD. It is commonly known that the design of OK changes the corneal curvature[7-8]. The OK design comprised of four circular arcs, including base curve (BC), reverse curve(RC), alignment curve (AC), and peripheral curve (PC), with radii of 3, 0.6, 1, and 0.4 mm, respectively. Unfortunately,we were not able to always attain a standard corneal shape according to these OK designs sometimes. Therefore, central and decentration shapes were analyzed. This study aimed to evaluate the changes in CS arising from the changes in corneal shape, looking for the main factors affecting the visual quality after OK lenses. We predicted that the size and location of BC,RC, and pupil may be important factors.
The corneal surface divided into three zones. The average size of zones A, B, and C were 8.11±3.62, 29.90±5.92, and 15.50±5.21 mm2, respectively. They were presented as a progressive one-times increase. Average AC/A is 0.88, which means that 88% of the size of zone A is located in the pupil.Average AC/C is 0.46, which means that 46% of the size of the pupil is in zone A. Therefore, we concluded that most of zone A is located in the pupil and that the size of zone A included less than half of the pupil after OK. Average BC/B is 0.51, which means that 51% of the shaped area is located in the pupil. Average BC/C is 0.98, which means that 98% of the size of pupil is in the shaped area. OK can only correct a refraction error in a ±10 degree visual field (VF) and less than a 30 degree VF[9]. Accordingly, we concluded that the shaped corneal area can cover the pupil, and that the size of the shaped corneal area is two times the size of the pupil after OK.
Hiraoka et al[10] concluded that visual quality decreases with decentration and myopic power[6,11]. Recent studies have indicated that CS decreased in correlation with pupil size[12-13]. This study valued the shaped parameters using A, B, and C zones, AC/A, AC/C, BC/B, and BC/C to replace the decentration. Our results indicated that CS demonstrated a negative correlation with zone C (pupil), the ratio of BC/B,and 3 mm SIRI, in addition to showing no differences in CS correlation with zone B, the ratio of AC/A, and 5 mm SIRI.We determined that more CPD indicates a higher effect factor.Reducing decentration values induced a decrease in CS,poor BCVA[1,14-15], and good visual quality within the shaped center[16]. We analyzed three typical center shaped cases and three typical decentration shaped cases. In the center shaped case, the size of zone A, pupil size, ratio of BC/B, and 3 mm SIRI are 15.04 mm2, 11.59 mm2, 34/100, 2.1, 7.27 mm2,14.82 mm2, 38/100, 4.2, 7.36 mm2, 23.9 mm2, 100/100, 5.2 in cases 1, 2, and 3, respectively. Large pupil size, a high ratio between BC/B and a high 3 mm SIRI induced poor visual quality in Case 3. The pupil size, ratio of BC/B, and 3 mm SIRI were good predictors for CS after OK. In the decentration shaped cases, Case 4 presented good CS but poor CS in Case 5 and 6. Cases 4 and 6 deviated to the infratemporal but different CS. We cannot explain the high 3 mm SIRI in Case 4, high BC/B in Case 6, and high 3 mm SIRI and BC/B in Case 5. A decentration value less 0.5 mm can maintain good visual quality and avoid decentration greater than 1 mm[17].Decentration values over 1 mm in these three cases had good visual quality except for Case 4. Thus, pupil size, ratio of BC/B, and 3 mm SIRI do not parallelly predict CS after OK and requires further research.
The authors concluded that OK does not induce subjective visual quality reduction after 1wk[1-2,18-19]. In this study, we analyzed the relationship between corneal shape and subjective visual quality after OK. In summary, CS presents a negative correlation with zone C, the ratio of BC/B, and 3 mm SIRI and demonstrates no correlation among CS, zone B, the ratio of AC/A, and 5 mm SIRI.
ACKNOWLEDGEMENTS
Conflicts of Interest: Liu LL, None; Gong LP, None; Xu YY, None; Zhu X, None; Chen KK, None; Liu WF, None.
REFERENCES
1 Ma W, Liao M, Jin HZ, Liu LQ. Evaluation of visual quality after overnight orthokeratology in pre-adolescent myopes. Zhonghua Shiyan Yanke Zazhi 2012;30(12):1104-1109.
2 Chen CM, Zhong H, Cheng LB, Wu PB, Wang X, Zhou Y, Huang TH.Clinical research on overnight orthokeratology for vision quality. Guoji Yanke Zazhi 2015;15(12):2127-2129.
3 Richman J, Spaeth GL, Wirostko B. Contrast sensitivity basics and a critique of currently available tests. J Cataract Refract Surg 2013;39(7):1100-1106.
4 Madrid-Costa D, García-Lázaro S, Albarrán-Diego C, Ferrer-Blasco T,Montés-Micó R. Visual quality differences between orthokeratology and LASIK to compensate low-moderate myopia. Cornea 2013;32(8):1137-1141.
5 Chen Y, Jiang J, Mao XJ, Lyu F. The dynamic influence of induced decentered orthokeratology lenses on higher-order wavefront aberrations.Chinese Journal of Optometry Ophthalmology and Visual Science 2013;15(11):656-661.
6 Hiraoka T, Okamoto C, Ishii Y, Kakita T, Oshika T. Contrast sensitivity function and ocular higher-order aberrations following overnight orthokeratology. Invest Ophthalmol Vis Sci 2007;48(2):550-556.
7 Chou CC, Huang YC, Tsai YY, Lin JM, Chen WL, Lin HJ. Changes in corneal curvature after wearing the orthokeratology lens. Taiwan Journal of Ophthalmology 2013;3(4):156-159.
8 Nieto-Bona A, González-Mesa A, Nieto-Bona MP, Villa-Collar C,Lorente-Velázquez A. Short-term effects of overnight orthokeratology on corneal cell morphology and corneal thickness. Cornea 2011;30(6):646-654.
9 Charman WN, Mountford J, Atchison DA, Markwell EL. Peripheral refraction in orthokeratology patients. Optom Vis Sci 2006;83(9):641-648.
10 Hiraoka T, Mihashi T, Okamoto C, Okamoto F, Hirohara Y, Oshika T.influence of induced decentered orthokeratology lens on ocular higherorder wavefront aberrations and contrast sensitivity function. J Cataract Refract Surg 2009;35(11):1918-1926.
11 Hiraoka T, Okamoto C, Ishii Y, Takahira T, Kakita T, Oshika T.Mesopic contrast sensitivity and ocular higher-order aberrations after overnight orthokeratology. Am J Ophthalmol 2008;145(4):645-655.
12 Faria-Ribeiro M, Navarro R, González-Méijome JM. Effect of pupil size on wavefront refraction during orthokeratology. Optom Vis Sci 2016;93(11):1399-1408.
13 Santodomingo-Rubido J, Villa-Collar C, Gilmartin B, Gutiérrez-Ortega R, Suzaki A. The effects of entrance pupil centration and coma aberrations on myopic progression following orthokeratology. Clin Exp Optom 2016;98(6):534-540.
14 Oshika T, Tokunaga T, Samejima T, Miyata K, Kawana K, Kaji Y.influence of pupil diameter on the relation between ocular higher-order aberration and contrast sensitivity after laser in situ keratomileusis. Invest Ophthalmol Vis Sci 2006;47(4):1334-1338.
15 Liu G, Chen Z, Xue F, Li J, Tian M, Zhou X, Wei R. Effects of myopic orthokeratology on visual performance and optical quality. Eye Contact Lens 2018;44(5):316-321.
16 Stillitano IG, Chalita MR, Schor P, Maidana E, Lui MM, Lipener C, Hofling-Lima AL. Corneal changes and wavefront analysis after orthokeratologyfitting test. Am J Ophthalmol 2007;144(3):378-386.
17 Tsai YY, Lin JM. Ablation centration after active eye-tracker-assisted photorefractive keratectomy and laser in situ keratomileusis. J Cataract Refract Surg 2000;26(1):28-34.
18 Johnson KL, Carney LG, Mountford JA, Collins MJ, Cluff S, Collins PK. Visual performance after overnight orthokeratology. Cont Lens Anterior Eye 2007;30(1):29-36.
19 Soni PS, Nguyen TT, Bonanno JA. Overnight orthokeratology: visual and corneal changes. Eye Contact Lens 2003;29(3):137-145.
Correspondence to:Wei-Feng Liu. The Third Affiliated Hospital of Nanchang University, 128 Xiangshan Northern Road, Nanchang 330000, Jiangxi Province, China.18970040725@163.com
Received: 2017-12-30 Accepted: 2018-10-15
● KEYWORDS:orthokeratology; contrast sensitivity; pupil size area; shaped cornea; myopia
DOl:10.18240/ijo.2019.02.14
Citation:Liu LL, Gong LP, Xu YY, Zhu X, Chen KK, Liu WF.Relationship between contrast sensitivity and corneal shape following overnight orthokeratology. Int J Ophthalmol 2019;12(2):275-279