
・Basic Research・
Effects
of the long wavelength-filtered continuous spectrum on natural refractive
development in juvenile guinea pigs
Rui-Qin Li1,2, Wei-Zhong Lan1,2,
Xiao-Ning Li2, Hao-Ran Wu1,2, Qing-Lin Xu2,
Hong Zhong2, Wen-Tao Li3, Zhi-Kuan Yang1,2
1Aier School
of Ophthalmology, Central South University, Changsha 410015, Hunan Province,
China
2Aier
Institute of Optometry and Vision Science, Changsha 410015, Hunan Province,
China
3Huizhou
Third People’s Hospital, Guangzhou Medical University, Huizhou 516002, Guangdong
Province, China
Correspondence
to: Zhi-Kuan
Yang. Aier School of Ophthalmology, Central South University, Changsha 410015,
Hunan Province, China. 13380071988@189.cn
Received:
Abstract
AIM: To investigate the effects of spectral composition and light intensity
on natural refractive development in guinea pigs.
METHODS: A total of 124 pigmented guinea pigs (2-week-old)
were randomly assigned to three groups at high (Hi; 4000 lx), medium (Me; 400
lx) and low (Lo; 50 lx) light intensities under a 12:12 light/dark cycle for
6wk. Each group was subdivided into subgroups with the following spectra: broad
spectrum Solux halogen light (BS), 600 nm above-filtered continuous spectrum (
RESULTS: After 6wk of exposure, high-intensity lighting
enhanced hyperopic shift; medium- and low-intensity lighting enhanced myopic
shift (P<0.05). Under the same spectrum, axial increase was larger in
the low light intensity group than in the medium and high light intensity
groups (HiBS: 0.65±
CONCLUSION: Under high-intensity lighting, high light intensity
rather than spectrum distributions that inhibits axial increase. Under medium-
and low-intensity lighting, filtering out the long wavelength inhibits axial
growth in juvenile guinea pigs.
KEYWORDS: myopia; wavelength; spectral
composition; light intensity; refractive development
DOI:10.18240/ijo.2019.06.01
Citation:
Li RQ, Lan WZ, Li XN, Wu HR, Xu QL, Zhong H, Li WT, Yang ZK. Effects of the
long wavelength-filtered continuous spectrum on natural refractive development
in juvenile guinea pigs. Int J Ophthalmol 2019;12(6):883-891
Outline
The prevalence rates of myopia have increased
dramatically in the past decades in many regions of the world[1, 2,
3, 4, 5]. By 2050,
approximately half of the world’s population will suffer from myopia[6]. Attempts
to arrest myopia progression could be dated back to centuries ago, and a
variety of interventions have been tested in humans[7]. Among all
interventions, outdoor exposure seems to be the most natual and economical approach. Both cross-sectional[8, 9,
10] and prospective studies[11, 12] have suggested that outdoor exposure is a strong
protective factor against myopia, although
the exact dose-response relationship is
yet to know[13, 14].
French et al[15] assumed many factors might be linked to the protective effect
demonstrated by outdoor exposure; among
which one notable difference between outdoor and indoor
environments is light. When comparing illumination indoors with outdoors, it’s evident that sunlight provides much
higher illumination than indoor lighting even in the shade of trees or during a
cloudy day[16, 17]. Animal
studies have also indicated that light intensity might be an important factor
against myopia. The inhibition effect of high illumination was found in natural refractive
development models[18] as well as in animals with lens-induced myopia[18, 19, 20, 21] and
deprivation myopia[22, 23].
In addition to light intensity, sunlight differs from
indoor light in spectral composition. The spectrum of sunlight includes a
continuous distribution of wavelengths from approximately 300 nm to 1200 nm
(adapted with permission from Kendric C Smith, ed. What is photobiology?
Photobiological Sciences Online. American Society for Photobiology,
http://www.photobiology.info/introduction.html.), while florescent lights, the
most common source of indoor lighting, emits only a spiked distribution of
wavelengths from 400 to 700 nm, with peaks in blue, green and red[18]. However,
Li et al[18] replicated real-world lighting environments using
spectrally spiked light (RGB light) and broad spectrum (BS) light and found
that they had similar effects on refractive development. We speculated
that although there were differences in spectral continuity between BS and RGB
light sources, both of them had a broad spectral range. So it seems that the spectral composition rather than
spectral continuity serves as a key factor for refractive development.
The pigmented guinea pig is one of the most commonly used
mammalian models in myopia research[24, 25, 26] and has a
unique wavelength-related optical system. According to some monochromatic light
studies on guinea pigs, long wavelengths accelerated ocular elongation, while
short wavelengths inhibited axial growth[27, 28, 29, 30, 31]. Therefore,
we raised guinea pigs under different long wavelength-filtered continuous
spectra to investigate how the differences in spectral composition and light
intensity affect the refractive development.
Ethical
Approval All
experiments adhered to the ARVO Statement for the Use of Animals in Ophthalmic
and Vision Research and were approved by the animal experimentation ethics
committee of Aier School of Ophthalmology, Central South University.
Lighting Guinea pigs
were kept in cages covered with black shading cloth (Figure 1). Solux halogen
lamps (4100 K; Eiko Ltd., Shawnee, KS, USA), which emit continuous wavelengths
ranging from approximately 350 to 1050 nm, were used as continuous BS lighting
sources in the experiment. Since the superior retina of the guinea pig is
dominated by middle wave-sensitive (M) cones (maximum absorbance, 530 nm), and
all cones in the inferior retina are strongly labelled for shortwave-sensitive
(S) photopigments (maximum absorbance, 400 nm)[32]. The
spectral sensitivity functions curves of S cones and M cones are separated at
480 nm and do not overlap[33]. The transitional zone between these two retinal
areas is populated by co-expressing cones that express both M and S cone
photopigments[32]. According to the spectrum sensitivity of S and M
cones, optical filters (Zeiss, Germany), which can filter out wavelengths above
600 nm, 530 nm, and 480 nm, and control filters (CR39) which allow all
wavelengths to pass, were placed under the Solux light source respectively. The
spectrum profile was measured with a spectrophotometer (UltraScan PRO,
HunterLab, USA) by the China Branch (Zeiss, Germany). The percentages of light
transmitting through the control filter substrate (Figure
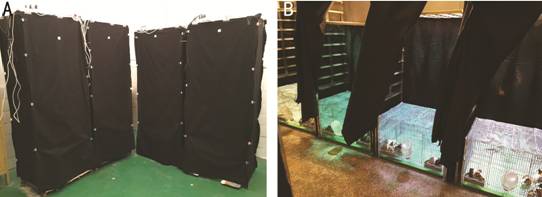
Figure 1 Rearing cages A: The cages
covered with black shading cloth; B: Light conditions in cages.
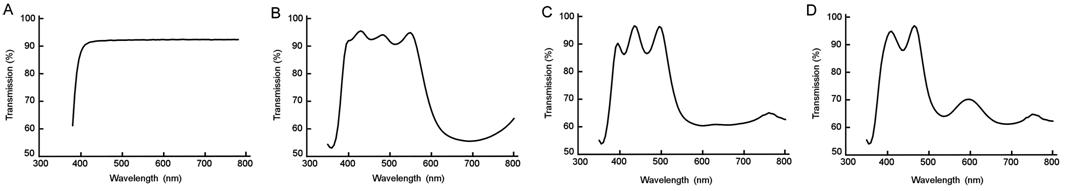
Figure 2 Percentage of light transmitted through
different filters A: Control
filter substrate; B: 600 nm short wavelength-pass filter; C: 530 nm short
wavelength-pass filter; D: 480 nm short wavelength-pass filter.
Animals and Experimental Design One hundred and twenty-four 2-week-old guinea pigs [Licence No. SCXK (Xiang) 2014-0010],
obtained by Tian Qin Biotechnology Co., Ltd. (Hunan Province, China) were
raised in a temperature-controlled room with free access to food and water. In order to investigate the effect of the light intensity and
spectral property on refractive development, three levels of light intensity combined with four
different spectral
composition were applied in the study.
Accordingly, guinea pigs were randomly assigned to one of the following
subgroups: high-intensity group (Hi; 4000 lx): 1) high-intensity with control
filter substrate (HiBS; n=10), 2) high-intensity with 600 nm
above-filtered spectrum (Hi
Ocular Biometry
Refractive error, corneal curvature, and axial dimensions
of the eyes in each group were measured prior to the experiment and every 2wk
during treatment. Refractive error: cycloplegia was induced by one drop of 0.5%
proparacaine hydrochloride (Alcaine; Alcon, Fort Worth, TX, USA), followed by five
drops of 0.5% tropicamide and 0.5% phenylephrine (Mydrin-P; Santen, Osaka,
Japan) instilled 5min apart. The animals were held horizontally for at least 1min after
each instillation to ensure that the cornea was bathed with the drug.
Cycloplegic refractive error was measured using handheld streak retinoscopy (66
Vision-Tech Co., Ltd., Suzhou, Jiangsu Province, China) by two independent
experienced optometrists from Aier Institute of Optometry and Vision Science who
were masked with regard to the treatment. The results from the two optometrists
were averaged. Refractive error was expressed as the spherical equivalent (SE),
that is, spherical error plus half the cylinder error. No correction was made
for the artifact of retinoscopy, which is relatively small in guinea pigs[34]. Corneal
curvature: the radius of the corneal curvature was determined by a custom-made
infrared photokeratometer as previously described[34, 35]. Readings were accepted only when the reflection of
the light emitting diode (LED) rings was centred on the pupil and all six
infrared lights were seen clearly from the screen. Then, three readings were
averaged to provide a value for each eye measured. Axial dimensions: the axial dimensions of the eye
were measured by A-scan ultrasonography with a 10-MHz probe (KN-1800; Kangning
Medical Device Co., Ltd., Wuxi, Jiangsu Province, China). One drop of 0.5%
proparacaine hydrochloride (Alcaine, Alcon) was administered to the eye prior
to the measurement. The ultrasound probe was placed in direct contact with the
corneal apex, and special attention was paid to ensure that the probe was
perpendicular to the corneal surface. The results from 10 readings were
averaged for each eye measured. The vitreous chamber depth (VCD) was calculated
using the following formula: VCD=axial length-anterior chamber depth-crystal lens thickness.
Data Presentation and Analysis All the statistical
analysis was performed using SPSS 22.0 (SPSS, Chicago, IL, USA). The data were
presented as mean±standard
deviation (SD) unless otherwise stated. Paired t-tests were
used to analyse the changes of ocular parameters between baseline and the end
of the experiment for individual subgroups. The difference in changes among
groups was compared by one-way ANOVA with the same spectral composition but
different intensities or with different spectral features but the same light
intensity. If significant differences were detected, post hoc tests were
performed using the Bonferroni test. Pearson’s correlation analysis was used to
examine the relationship between the changes in refractive error and axial
length. The level for statistical significance was set at two-tailed P<0.05.
All results were based on the average data from both eyes
of the guinea pigs. The average data on all ocular parameters at different time
points were shown in Figure 3 and Table 1. None of the parameters, such as
refractive error or axial length, were significantly different among all 12
groups at baseline (P>0.05).
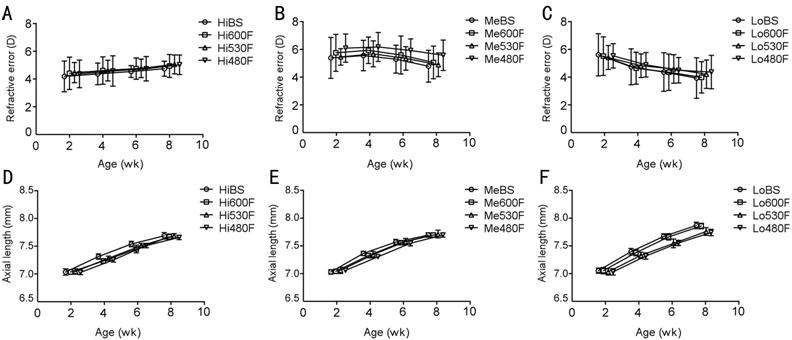
Figure 3 Average refractive error and axial length at
different time points A:
Changes in refractive error under 4000 lx; B: Changes in refractive error under
400 lx; C: Changes in refractive error under 50 lx; D: Changes in axial length
under 4000 lx; E: Changes in axial length under 400 lx; F: Changes in axial
length under 50 lx. BS: Solux halogen light;
Table 1 Changes of ocular parameters with
time
mean±SD
|
Groups |
Subgroups |
Time points |
Refractive error, D |
Corneal radius, mm |
ACD, mm |
LT, mm |
VCD, mm |
AL, mm |
|
High intensity (4000 lx) |
HiBS |
Baseline |
4.19±1.11 |
3.20±0.02 |
1.17±0.01 |
2.95±0.02 |
2.93±0.04 |
7.05±0.06 |
|
Week 6th |
4.74±0.54 |
3.55±0.01 |
1.19±0.01 |
3.27±0.03 |
3.24±0.04 |
7.71±0.06 |
||
|
Change |
0.60±0.69 |
0.35±0.02 |
0.02±0.01 |
0.32±0.01 |
0.31±0.01 |
0.65±0.02 |
||
|
|
Hi |
Baseline |
4.41±1.17 |
3.21±0.02 |
1.17±0.01 |
2.95±0.02 |
2.93±0.03 |
7.05±0.04 |
|
Week 6th |
4.94±0.83 |
3.55±0.02 |
1.19±0.01 |
3.27±0.02 |
3.23±0.03 |
7.69±0.05 |
||
|
Change |
0.53±0.64 |
0.35±0.01 |
0.02±0.01 |
0.32±0.01 |
0.31±0.01 |
0.64±0.02 |
||
|
|
Hi |
Baseline |
4.46±0.73 |
3.21±0.03 |
1.18±0.01 |
2.96±0.02 |
2.93±0.05 |
7.06±0.05 |
|
Week 6th |
5.06±0.68 |
3.55±0.03 |
1.19±0.01 |
3.28±0.03 |
3.24±0.04 |
7.71±0.04 |
||
|
Change |
0.60±0.83 |
0.35±0.01 |
0.02±0.01 |
0.32±0.01 |
0.31±0.01 |
0.64±0.02 |
||
|
|
Hi |
Baseline |
4.37±0.99 |
3.20±0.03 |
1.17±0.01 |
2.94±0.02 |
2.92±0.03 |
7.04±0.04 |
|
Week 6th |
5.03±0.71 |
3.53±0.02 |
1.19±0.01 |
3.26±0.02 |
3.23±0.03 |
7.68±0.04 |
||
|
Change |
0.66±0.80 |
0.34±0.01 |
0.02±0.01 |
0.32±0.01 |
0.30±0.01 |
0.64±0.01 |
||
|
Medium intensity (400 lx) |
MeBS |
Baseline |
4.20±1.13 |
3.20±0.03 |
1.17±0.01 |
2.95±0.02 |
2.94±0.03 |
7.06±0.04 |
|
Week 6th |
3.74±0.88 |
3.54±0.02 |
1.20±0.01 |
3.28±0.02 |
3.27±0.03 |
7.74±0.04 |
||
|
Change |
-0.44±0.60 |
0.34±0.02 |
0.02±0.01 |
0.32±0.01 |
0.33±0.01 |
0.67±0.01 |
||
|
|
Me |
Baseline |
4.48±1.02 |
3.21±0.03 |
1.17±0.01 |
2.96±0.02 |
2.94±0.03 |
7.07±0.04 |
|
Week 6th |
3.95±0.90 |
3.56±0.02 |
1.20±0.01 |
3.28±0.02 |
3.27±0.02 |
7.74±0.04 |
||
|
Change |
-0.49±0.62 |
0.34±0.02 |
0.02±0.01 |
0.32±0.01 |
0.33±0.01 |
0.67±0.01 |
||
|
|
Me |
Baseline |
4.26±0.46 |
3.20±0.03 |
1.18±0.01 |
2.97±0.03 |
2.94±0.04 |
7.09±0.06 |
|
Week 6th |
3.82±0.66 |
3.54±0.02 |
1.20±0.02 |
3.29±0.02 |
3.27±0.04 |
7.76±0.07 |
||
|
Change |
-0.44±0.59 |
0.34±0.02 |
0.02±0.01 |
0.32±0.01 |
0.33±0.01 |
0.67±0.01 |
||
|
|
Me |
Baseline |
4.74±0.78 |
3.20±0.01 |
1.18±0.01 |
2.96±0.01 |
2.95±0.03 |
7.09±0.03 |
|
Week 6th |
4.35±0.84 |
3.53±0.01 |
1.20±0.01 |
3.28±0.01 |
3.27±0.03 |
7.74±0.04 |
||
|
Change |
-0.39±0.41 |
0.33±0.01 |
0.02±0.01 |
0.32±0.01 |
0.32±0.01 |
0.66±0.01 |
||
|
Low intensity (50 lx) |
LoBS |
Baseline |
4.34±1.16 |
3.23±0.02 |
1.18±0.01 |
2.96±0.02 |
2.94±0.03 |
7.08±0.05 |
|
Week 6th |
3.06±1.12 |
3.57±0.03 |
1.20±0.02 |
3.30±0.03 |
3.41±0.03 |
7.91±0.06 |
||
|
Change |
-1.27±0.46 |
0.35±0.02 |
0.02±0.01 |
0.33±0.01 |
0.47±0.02 |
0.82±0.02 |
||
|
|
Lo |
Baseline |
4.27±1.06 |
3.21±0.04 |
1.17±0.01 |
2.96±0.02 |
2.96±0.04 |
7.08±0.06 |
|
Week 6th |
3.10±0.86 |
3.56±0.03 |
1.20±0.01 |
3.28±0.03 |
3.42±0.04 |
7.90±0.05 |
||
|
Change |
-1.17±0.47 |
0.35±0.01 |
0.02±0.01 |
0.33±0.01 |
0.46±0.02 |
0.81±0.01 |
||
|
|
Lo |
Baseline |
4.19±0.66 |
3.21±0.03 |
1.17±0.01 |
2.95±0.02 |
2.94±0.04 |
7.06±0.06 |
|
Week 6th |
3.27±0.78 |
3.56±0.03 |
1.20±0.01 |
3.28±0.02 |
3.32±0.04 |
7.80±0.07 |
||
|
Change |
-0.92±0.43 |
0.34±0.01 |
0.03±0.01 |
0.33±0.01 |
0.38±0.01 |
0.73±0.02 |
||
|
|
Lo |
Baseline |
4.28±0.67 |
3.21±0.03 |
1.17±0.01 |
2.95±0.02 |
2.94±0.04 |
7.06±0.06 |
|
Week 6th |
3.39±0.92 |
3.54±0.02 |
1.20±0.01 |
3.28±0.02 |
3.31±0.04 |
7.78±0.06 |
||
|
Change |
-0.90±0.60 |
0.34±0.02 |
0.02±0.01 |
0.32±0.01 |
0.37±0.02 |
0.72±0.02 |
ACD:
Anterior chamber depth; LT: Lens thickness; VCD: Vitreous chamber depth; AL:
Axial length. BS: Solux halogen light;
Refractive Error
At the end of the experiment, there was a significant
hyperopic shift in the refractive error of guinea pigs reared in high intensity
(4000 lx), while a significant myopic shift was observed in medium intensity
(400 lx) and low intensity (50 lx).
With the same spectrum distributions, HiBS group exhibited
a significant hyperopic shift (0.60±0.69 D), while LoBS group exhibited a significant
myopic shift (-1.27±0.46 D), followed by MeBS (-0.44±0.60 D; one-way ANOVA: F=26.67,
P<0.01). Similar findings were also observed for
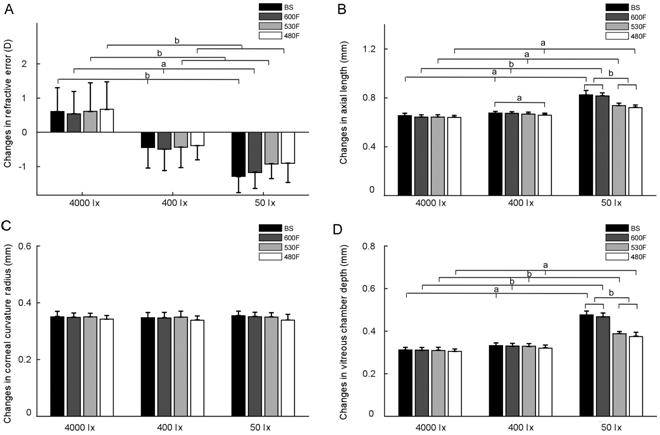
Figure 4 Comparison of the changes in ocular parameters
among the groups A: Refractive error; B: Axial length; C: Corneal
curvature radius; D: Vitreous chamber depth. BS: Solux halogen light;
Nevertheless, when comparing different spectrum
distributions at the same intensity (Figure
Corneal Curvature
The radius of corneal curvature significantly increased in
all groups (paired t-test: all P<0.01; Figure
Ocular Dimensions
The axial length of all groups increased throughout the
experiment (Figure 4B, paired t-test, P<0.01), with changes
ranging from 0.64 to
Comparing different intensity groups in the same spectrum
demonstrated that the axial changes in LoBS were 0.82±
Comparing different spectrum groups at the same intensity
showed no significant difference between HiBS, Hi
The changes in VCD were shown in Figure 4D. The outcomes
of VCD changes among different groups were similar to axial length changes
except for different spectral groups under 400 lx (F=1.68, P=0.19).
Correlation Between Changes in Axial Length and
Refractive Error The
correlation between the changes in axial length and refractive error for guinea
pigs reared in the subgroups with different light intensities and different
spectrum distributions were shown in Figure 5. Notably, the decrease in
refractive error (i.e. more myopia) was significantly correlated with
the elongation of axial length (Pearson correlated coefficient r=-0.67, P<0.01).
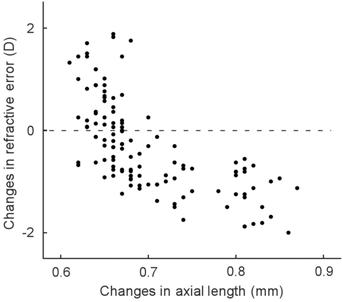
Figure 5 The correlation between changes in axial
length and refractive error.
In the current study, irrespective of spectrum
distributions, axial length development in high light intensity was slower than
that in medium and low light intensities. Additionally, high intensity induced
hyperopic shifts, while medium and low intensities induced myopic shift. Within
the same intensity, the effects of spectrum distributions were found in the
medium- and low-intensity groups only. In the 400 lx groups, axial growth in
The protective effect of high-intensity illumination
found in the present study was consistent with other previous studies[18, 19, 20, 21, 22,
23]. Dopamine (DA) is a neurotransmitter that inhibits
the progression of myopia[19, 36, 37, 38]. The synthesis and metabolism of DA in the retina
are light dependent[39, 40], and the
inhibitory effect of high-intensity lighting on myopia can be mediated by the
dopamine pathway[19]. In the current study, all subgroups exposed to
4000 lx intensity exhibited hyperopic shifts (+0.53 to +0.66 D); this result
was consistent with one of our previous study[18], that the
hyperopic shifts in normal refractive development of guinea pigs reared under
10 000 lx intensity ranged from +2.17 to +2.26 D, while all subgroups exposed
to 400 lx intensity exhibited myopic shifts (-0.39 to -0.49 D), which was
consistent with other previous researches[34, 41].
The protective effects of spectral properties were only
found in the 400 and 50 lx intensity groups. This may be due to the different
cones which perceive both photopic
and chromatic vision are oversaturated at 4000 lx intensity, and the retina
cannot distinguish the excitation levels of different types of cones. At a
certain high level, light intensity may play a more important role in regulating
ocular growth than the spectral component. A previous study in chicks[42] also
suggested that low light levels can reduce the effect of luminance cues and
increase the likelihood of chromatic cues to influence the emmetropization
process. Although the axial length changes were significantly different between
the BS and
Our study investigated the influence of different
spectral compositions and light intensities in a continuous spectrum on natural
refractive development in guinea pigs. However, we measured only the biological
parameters of the eyeball. Moreover, the guinea pig is not a diurnal animal,
and the cones are different from those in primates. Manipulations of the
spectral composition have opposite effects on guinea pigs[27, 29, 30] compared to
those on tree shrews[47, 48] and rhesus
monkeys[49, 50]. Gawne et al[48] found that the infant tree shrews exposed to red
light (626±10 nm) were significantly hyperopic compared with the normal ones
raised in white fluorescent lighting. In another experiment[47],
they found that narrow-band red light maintained this effect even in older
juvenile and adolescent tree shrews. The infant monkeys wearing long-wavelength
pass (red) filters (wavelengths longer than 660 nm) were induced significantly
hyperopic shift than those wearing neutral density filters and normal monkeys
under typical indoor lighting[49]. Hung et al[50] demonstrated that narrow-band long-wavelength
lighting not only produced axial hyperopia, but also prevented the axial
elongation produced by either form deprivation or hyperopic defocus. Therefore,
the inhibitory effect of the long wavelength-filtered continuous spectrum on
eye growth is typical for guinea pigs only, and extrapolation to humans may be
difficult. Further molecular biological mechanism studies and experiments on
primates are needed in the future.
In conclusion, under high-intensity lighting, it’s high
light intensity rather than spectrum distributions that inhibited axial
increase. Under medium- and low-intensity lighting, filtering out the long
wavelength inhibited axial growth in juvenile guinea pigs.
Authors’
contributions: Conceived and designed the experiments: Li RQ, Lan WZ, Li XN, Yang ZK. Performed
the experiments: Li RQ, Xu QL, Zhong H. Analyzed
the data: Li RQ, Lan WZ, Li XN, Wu HR, Yang ZK. Contributed reagents/materials/analysis tools: Li WT. Wrote the
paper: Li RQ, Lan WZ, Wu HR, Yang ZK.
Foundation: Supported by National Natural
Science Foundation of China (No.81770958).
Conflicts of
Interest: Li RQ, None; Lan WZ, None; Li XN, None; Wu
HR, None; Xu QL, None; Zhong H, None; Li WT, None; Yang
ZK, None.