
Citation: Wang YP,
Liang ZY, Chen S, Yang WC, Kong JH. Chronic photodamage in the chicken retina
using 650-nm semiconductor laser. Int J Ophthalmol
2019;12(6):936-942
DOI:10.18240/ijo.2019.06.09
・Basic Research・
Chronic
photodamage in the chicken retina using 650-nm semiconductor laser
Yi-Peng Wang1,2, Ze-Yu Liang3, Song
Chen3, Wen-Chao Yang2, Jia-Hui Kong2
1Clinical
College of Ophthalmology, Tianjin Medical University, Tianjin 300000, China
2Anyang Eye
Hospital, Anyang 455000, Henan Province, China
3Tianjin Key
Laboratory of Ophthalmology and Visual Science, Tianjin Eye Hospital, Tianjin
300000, China
Co-first
authors: Yi-Peng Wang
and Ze-Yu Liang
Correspondence
to: Song Chen.
Tianjin Key Laboratory of Ophthalmology and Visual Science, Tianjin Eye
Hospital, Tianjin 300000, China. chensong9999@126.com
Received:
Abstract
AIM: To investigate the occurrence of chronic photodamage in the cone-based
retina, following long-term exposure to a 650-nm semiconductor laser (power: 2
mW).
METHODS: Chickens fed for 1mo under natural light after
hatching were irradiated with 650-nm laser light at different times each day.
Fifteen animals were included in each group. Group A was a control group,
irradiated with natural light during the entire study. Group B was irradiated
with laser for 3 min/d. Group C was irradiated with laser for 6 min/d. Group D
was irradiated with laser for 30 min/d. The duration of the light experiment
was 6mo. We obtained data at 1, 3, and 6mo, including measuring the retinal
thickness in vivo using optical coherence tomography, hematoxylin and
eosin staining, TUNEL assay, apoptosis staining, malondialdehyde (MDA) content,
superoxide dismutase (SOD) activity, and Western blotting to detect changes in
L/M opsins and rhodopsin.
RESULTS: At 1mo, the MDA content in Group D was higher than
that observed in Group A (P=0.019). At 3mo the MDA content in Groups C
and D was higher than that reported in Group A (P=0.026, 0.003). At 6mo,
the MDA content in Groups B, C, and D was higher than that observed in Group A
(P=0.038, 0.032, 0.000, respectively). There was no difference in SOD
activity, and L/M opsin and rhodopsin content between the groups at 1 and 3mo.
The SOD activity in group D was significantly decreased at 6mo (P=0.000),
as was the content of rhodopsin. There was no significant reduction observed in
retinal thickness, abnormal cell arrangement, and positive staining of TUNEL in
the groups during the 6-month study period.
CONCLUSION: Irradiation using a 650 nm semiconductor laser
(power: 2 mW) for 6min per day over 6mo do not cause photodamage. Similarly, a
3-month exposure of 30min per day do not cause damage. However, irradiation for
6mo resulted in a significant increase in the content of free radicals and a
decrease in the content of rhodopsin in the retina, suggesting the presence of
photodamage.
KEYWORDS: light/adverse
effects; oxidative stress; red light; apoptosis; chicken retina
DOI:10.18240/ijo.2019.06.09
Citation:
Wang YP, Liang ZY, Chen S, Yang WC, Kong JH. Chronic photodamage in the chicken
retina using 650-nm semiconductor laser. Int J Ophthalmol
2019;12(6):936-942
Outline
Red light
plays roles in anti-inflammation and biological regulation of mitochondrial
electron chain transfer in biological tissues[1-4]. In recent years, its use in clinical practice has
gradually increased, promoting wound repair and tissue cell regeneration,
improving blood circulation, treating peripheral nerve injury and chronic pain,
and reducing damage to the retina, optic nerve, and other fields[5-10]. The clinically useful bands
mostly range between 630 and 700 nm, and both light-emitting diodes and lasers
exert similar therapeutic effects[11-12].
Laser is a special kind of light characterized by high brightness,
monochromaticity, and good directionality. Its use is associated with
advantages for the treatment of local lesions, such as in the macular area of
the human eye. Studies have shown that exposure to low laser illumination does
not cause obvious photodamage in the human eye in the short term[7,11]. However, studies investigating
the safety of long-term exposure to laser illumination are currently lacking.
In this study, the chicken retina was regularly irradiated using a 2 mW
semiconductor laser for different periods of time to assess the effects of
long-term exposure on the retina.
Ethical
Approval The study was approved by the Tianjin
Medical University Medical Ethics Committee and complied with the Declaration
of Helsinki and ARVO Statement. The procedures followed were in accordance with
institutional guidelines.
Experimental
Animals and Grouping Sixty Leghorn male chicken were
raised under natural light after hatching for 1mo. They were randomly divided
into four groups (15 animals per group). Exposures to laser per day included
0-min irradiation [Group A, (natural light, control)], 3-min irradiation (Group
B), 6-min irradiation (Group C), and 30-min irradiation (Group D). The rest of
the time, the chickens were exposed to natural light. Five experimental animals
were randomly selected from each group for to observed the indicators at 1, 3,
and 6mo.
Assessment
of the Chicken Retina Using Optical Coherence Tomography At each detection time point, the
heads of all experimental animals were fixed , and through the center of the
pupil for optical coherence tomography (OCT) scanning of both eyes (Heidelberg,
Germany). The scanning mode selected the ring of the nerve fiber layer thickness
measurement mode of the machine. The obtained images were analyzed by using the
ImageJ software (V
Histological
Observation After the animals were sacrificed,
the left eye of the chicken was selected for tissue fixation, and the eye was
cut along the equator of the eyeball on an ice table. After peeling, the retina
was removed from the adherent vitreous and pigmented membrane and fixed with 4%
paraformaldehyde for 24h. Subsequently, the retinal sections were dehydrated,
treated with the clearing agent xylene, and embedded in paraffin. The slice
thickness was 3 μm, and three slices were obtained from each sample. The
sections were subjected to conventional hematoxylin and eosin (HE) staining and
observed under a light microscope. Using TUNEL apoptosis detection kit to
detect apoptosis (Beyotime, Shanghai, China), The sections were dewaxed three
times using xylene, removal of xylene using gradient alcohol, dilution in
distilled water for 2min, digestion with proteinase K for 15min at
Determination
of Malondialdehyde Content and Superoxide Dismutase Activity The right eyes of the chickens were
selected to produce retinal homogenates. The posterior pole retina was placed
on the ice platform and ultrasonically pulverized to produce a 10% retinal
homogenate. The samples were centrifuged at 3500 r/min for 15min and the
supernatants were collected for experimental use.
Malondialdehyde
Content Determination The 0.1 mL of the 10% retinal
homogenate was added to the malondialdehyde (MDA) detection reagent (Beyotime,
Shanghai, China) and the mixture was placed in a
Determination
of Superoxide
Dismutase Activity Diluted some
10% of the retina homogenate to 1% using TBS, 40 μL of the 1% of the retina
homogenate was collected for use, and the detection reagent (Beyotime,
Shanghai, China) was added to the mixture. The mixture was placed in a
The protein
concentration was determined using the bicinchoninic acid (BCA) method.
Briefly, 50 μL of 1% retinal homogenate were placed in the well plate, the BCA
working solution (Beyotime, Shanghai, China) was added, and the mixture was
placed at
For the
determination of MDA content and superoxide dismutase (SOD) activity, the MDA
and SOD assay units were expressed as nmol/mg protein and nU/mg protein,
respectively, based on the protein concentration.
L/M-opsin
and Rhodopsin Determination Retinal homogenate (10%, 1 mL) was
centrifuged at 10 000 r/min for 10min. The sample volume was calculated
according to the protein concentration (25 μg protein), and an equal amount of
loading buffer was added to the mixture. The mixture was placed in a
Subsequently,
the membrane was washed thrice with TBST and incubated with secondary antibody
at
Optical
Coherence Tomography Retinal Thickness
In the
living state, the OCT images of the posterior retinas of the chickens were
obtained using a circular scan mode. The obtained images were analyzed using
the ImageJ software and the area of the retinal image was measured for
component comparison. At 1, 3, and 6mo, the variance analysis of each group was
F1=1.066 (P=0.371), F2=0.850 (P=0.476), and F3=0.817
(P=0.503), respectively, and the difference was not statistically
significant. The mean area of the retina in each group is shown in Table 1.
Table 1
Retinal layer area in each group according to optical coherence tomography mean±SD
|
Month |
Group A |
Group B |
Group C |
Group D |
F |
P |
|
1mo |
17.67±1.49 |
17.63±1.47 |
18.08±1.23 |
18.48±1.77 |
1.066 |
0.371 |
|
3mo |
22.4±1.34 |
21.95±1.19 |
21.65±1.45 |
21.66±0.83 |
0.850 |
0.476 |
|
6mo |
22.58±1.17 |
22.68±0.70 |
22.38±0.73 |
21.94±0.50 |
0.817 |
0.503 |
Histological
Observation
Hematoxylin
and eosin staining Under light microscopy, the
retinal structure in all groups was clear at all time points, and the inner and
outer sections of the photoreceptor were neatly arranged. There was no obvious
retinal cell structure disorder or fragmentation observed (Figure 1).
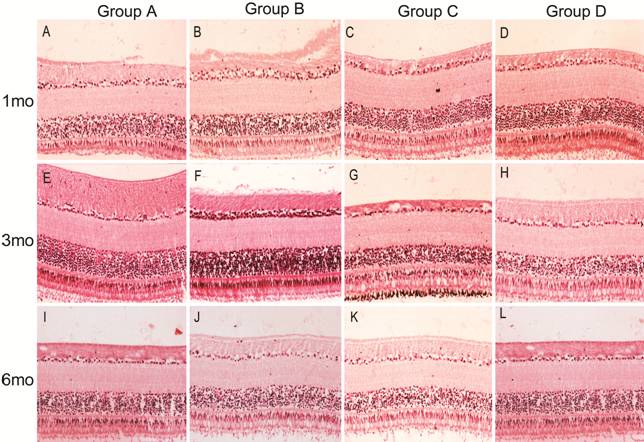
Figure 1 HE
staining sections of retinas in each group The cells in the retina were arranged
neatly and no obvious pathological changes were observed in each group.
TUNEL
staining All sections were visualized through
fluorescence microscopy after staining with the TUNEL reagent and DAPI
counterstaining. There was no obvious positive staining observed in the retinal
nuclei of all groups at all time points. The green fluorescence observed in the
picture was the autofluorescence of opsin (Figure 2).
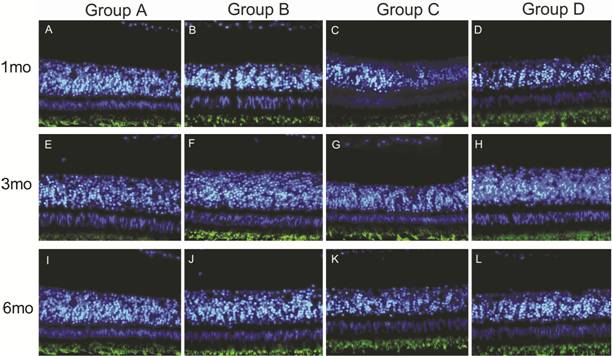
Figure 2
TUNEL immunofluorescence staining The
fluorescent images were stained by TUNEL FITC and DAPI. No obvious positive
staining was observed in the nucleus of each group. The green fluorescence
below was the autofluorescence of opsin.
Determination
of Malondialdehyde Content and Superoxide Dismutase Activity The MDA content and SOD activity in
the retinal homogenate of each group are shown in Tables 2 and 3, respectively.
According to variance analysis using Dunnett t-test. At 1mo, the MDA
content in each group was significantly different (F=3.652, P=0.035).
However, there was no significant difference observed in Groups B and C
compared with Group A (P=0.105 and P=0.057, respectively).
Notably, in Group D the MDA content was significantly different versus Group A
(P=0.019). At 3mo, there was significant difference in MDA content
between the three groups (F=5.784, P=0.007). There was no
significant difference between Group B and Group A (P=0.091). There was
significant difference in Groups C and D compared with Group A (P=0.026
and P=0.003, respectively). At 6mo, the MDA content in each group was
significantly different according to variance analysis (F=31.153, P=0.000).
There was significant difference in Groups B, C, and D compared with Group A (P=0.038,
P=0.032, and P=0.000, respectively).
Table 2 MDA content
mean±SD,
nmol/mg protein
|
Month |
Group A |
Group B |
Group C |
Group D |
|
1mo |
77.12±2.86 |
82.26±3.78 |
83.03±3.81 |
84.32±4.19 |
|
3mo |
79.81±2.58 |
83.77±2.72 |
84.89±2.01 |
86.83±3.49 |
|
6mo |
75.18±3.78 |
85.23±2.00 |
85.52±3.41 |
109.32±10.24 |
Table 3 SOD activity
mean±SD, nU/mg protein
|
Month |
Group A |
Group B |
Group C |
Group D |
|
1mo |
155.93±5.37 |
154.96±4.08 |
153.01±7.09 |
158.96±4.32 |
|
3mo |
157.89±4.86 |
160.21±6.46 |
159.54±3.27 |
161.44±3.04 |
|
6mo |
160.57±3.13 |
163.59±4.42 |
163.45±3.32 |
140.20±5.99 |
At 1mo,
variance analysis did not reveal significant differences in SOD activity
between the groups (F=1.076, P=0.387). At 3mo, variance analysis
did not show significant differences in SOD activity between the groups (F=0.513,
P=0.679). At 6mo, there was significant difference in SOD activity
according to variance analysis (F=33.215, P=0.000). There was no
significant difference in Groups B and C compared with Group A (P=0.574
and P=0.607, respectively). There was significant difference between
Group D and Group A (P=0.000).
Detection of
L/M-opsin and Rhodopsin via Western Blotting At 1mo, there was no significant
difference in the relative expression of L/M opsin and rhodopsin in all groups
[F=0.165 (P=0.919), F=0.611 (P=0.617),
respectively]. Similarly, at 3mo, there was no significant difference [F=1.523
(P=0.247), F=1.365 (P=0.289), respectively]. At 6mo, there
was no significant difference in the relative expression of L/M opsin between
the groups (F=0.333, P=0.802), whereas that of rhodopsin was
significantly different (F=7.840, P=0.002). There was no
significant difference in Groups B and C compared with Group A (P=0.726
and P=0.559, respectively). In addition, the expression level in Group D
was different versus that observed in Group A (P=0.001; Figure 3).
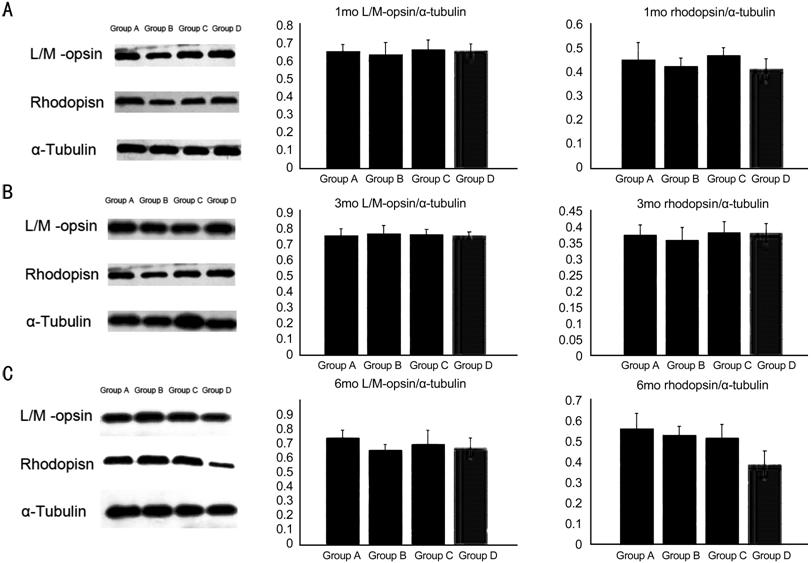
Figure 3
Western blot of L/M-opsion and rhodopsin
A, B, and C
are the Western results of 1, 3 and 6mo, respectively. There was no significant
difference in the relative expression of L/M opsin and rhodopsin in all groups
at 1 and 3mo. Whereas the rhodopsin was significantly different (F=7.840,
P=0.002) at 6mo. The expression level in Group D was different versus
that observed in Group A (P=0.001).
In this
study, the chicken retina was selected as the experimental subject, considering
that it is mainly composed of cone cells, accounting for approximately 80% of retinal
photoreceptor cells. Chicken cone cells can be divided into many kinds
according to the absorption wavelength of the optic protein. The absorption
peaks of long-, middle-, and short-wavelength cone cells are 571, 508, and 455
nm, respectively. Moreover, the absorption peak of rhodopsin in rod cells is
503 nm, which is similar to that reported in human cone-rod cells[13-14]. Moreover, the chicken retina
and human macular area do not contain blood vessels. These similarities render
the chicken an ideal animal model to simulate the human macular area. Studies
investigating eye tissues have shown that the wavelength of red light
bioregulation ranges between 630 and 700 nm, while the energy density of a
single irradiation ranges between 0.1 and 8 J/cm2[2,11,15-17]. In this
study, three experimental groups were irradiated using a 2 mW laser for 3, 6,
and 30min. The corresponding energy densities were 0.459, 0.917, and 4.586 J/cm2,
respectively.
The
occurrence of light damage is related to the power of the light, the
irradiation time, and the wavelength of the light. Some studies have shown that
irradiation with white light at 270 mW/cm2 (instantaneous power
density)[18] can cause light damage. The power of
the light used in eye bioregulation is far below this level. However, this does
not mean that low-power red light is safe, especially in the case of long-term
exposure. It is thought that the excessive production of free radicals is
closely related to the development of chronic light injury. The MDA content and
SOD activity are commonly used indicators, reflecting the balance of free
radicals in cells. The MDA content reflects the intracellular free radical
content, while the SOD activity reflects the ability to scavenge free radicals
in cells. Normally, the production and removal of intracellular free radicals
are in a dynamic balance. The disruption of this balance by external factors,
leads to the accumulation of free radicals. Excessive binding of free radicals
to lipid membranes, proteins, and bases in nucleic acids in cells affects the
normal biological functions of cells and induces apoptosis. There are many
reasons for the observed increase in the levels of free radicals caused by
chronic light injury, including dysfunction of organelles, excessive photodegradation
of lipofuscin, accumulation of intermediate products in visual circulation, etc.
Studies have shown that rod cells are more prone to light damage than cone
cells. This observation may be related to the lower rate-limiting enzyme
activity responsible for visual circulation in rod cells versus cone cells.
Thus, when rod and cone cells receive the same amount of light, both retinal
dimers and intermediates (which are similar to free radicals that disrupt
normal cellular function) are more likely to accumulate in rod cells[19-21]. Early retinal photodamage is
mainly manifested in cone-rod cells and their outer disc ganglia, including DNA
damage and chromosome concentration, optin degradation, abnormal calcium
metabolism, and peroxidation of polyunsaturated fatty acids in
extraphotoreceptor segments. As an important protein in extracellular segment
of cone-rod cells, the content of opsin reflects early injury[22].
In this
study, at 1mo, the MDA content and SOD activity in Group D were higher than those
reported in Group A. There was no significant difference in SOD activity among
groups, which indicated that the generation of free radicals was increased by
receiving additional laser irradiation. However, there is no excessive
consumption of SOD, the increase of free radicals may only occur temporarily,
and the body maintains the balance of free radical scavenging without obvious
damage. At 3mo, the MDA content in Groups C and D was higher than that observed
in Group A. In addition, there was no significant difference observed in SOD
activity between the groups. At 6mo, the MDA content in Groups B, C, and D was
higher than that observed in Group A, and the difference was statistically
significant. The MDA content in Group D was significantly higher than that
reported in Group A (MDA content: 109.32±10.24 nmol/mg protein). Compared with
Group A, there was no significant difference in SOD activity in Groups B and C;
however, SOD activity decreased in Group D with statistically significant
difference. The results showed that the balance of free radical scavenging was
disrupted after 6mo of exposure to laser irradiation, and the accumulation of
free radicals suggested the presence of light damage. In our study, we found
that the free radicals produced by 650 nm laser irradiation in chicken retina
progressively accumulated with time. At 1mo, the MDA content was increased in
the 30-min irradiation group. At 3mo, the MDA content was increased in the
6-min and 30-min irradiation groups. At 6mo, the MDA content in each laser
irradiation group was higher than that observed in Group A. Although there was
no significant decrease in SOD activity after 3-min and 6-min irradiation,
damage similar to that reported in the 30-min irradiation group may occur after
prolonged irradiation time. At 1, 3, and 6mo, there was no statistically
significant difference in L/M-opsin content in all groups. At 1 and 3mo, there
was no statistically significant difference in rhodopsin content between the
groups. However, at 6mo, the rhodopsin content in Group D was statistically
significantly lower than that reported in Group A. This suggests that cone
cells did not suffer from obvious damage to the outer disc ganglion during the
6mo of irradiation. In contrast, rod cells treated with 30min of irradiation
per day for 6mo showed some damage to the outer disc ganglion and degradation
of visual pigments. In this study, there was no significant decrease in retinal
thickness, abnormal cell arrangement, and positive apoptotic staining. It may
be inferred that chronic light injury does not reach the apoptotic level.
However, it may also be hypothesized that cone cells are the main retinal cells
in chickens, and the number of rod cells is too few to express in tissue
sections and imaging examination at the initial stage of light injury.
In this
study, it was found that light damage in rod cells appeared after 6mo of
irradiation with a 650-nm laser (power: 2 mW) per day for 30min. Although there
was no obvious damage noted in the 3-min and 6-min groups, the possible chronic
accumulation of free radicals may lead to damage after prolonged exposure and
observation. Furthermore, the sensitivity of the currently available detection
methods may not be sufficient to recognize minute defects of light damage. Further
studies investigating chronic light damage and the safety of red light
photobiomodulation in the eye are required to support the present findings.
Conflicts of
Interest: Wang YP,
None; Liang ZY, None; Chen S, None; Yang WC, None; Kong
JH, None.