
Citation: Kovacic H, Wolfs RCW, Kılıç E, Ramdas WD. Changes in intraocular pressure after intraocular eye
surgery―the influence of measuring technique. Int J Ophthalmol
2019;12(6):967-973
DOI:10.18240/ijo.2019.06.14
・Clinical Research・
Changes in intraocular pressure after
intraocular eye surgery―the influence of measuring technique
Hrvoje Kovacic, Roger C.W. Wolfs, Emine Kılıç, Wishal D.
Ramdas
Department of Ophthalmology, Erasmus
Medical Center, Rotterdam 3000 CA, the Netherlands
Correspondence to: Wishal D. Ramdas. Department of
Ophthalmology, Erasmus Medical Center Rotterdam, PO Box 2040, Rotterdam 3000
CA, the Netherlands. w.ramdas@erasmusmc.nl
Received:
Abstract
AIM: To investigate the changes in intraocular pressure (IOP)
before and after intraocular surgery measured with Goldmann applanation
tonometry (GAT) and pascal dynamic contour tonometry (PDCT), and assessed their
agreement.
METHODS: Patients who underwent trans pars plana
vitrectomy (TPPV) with or without cataract extraction (CE) were
included. The IOP was measured in both eyes with GAT and PDCT pre- and
postoperatively, where the non-operated eyes functioned as control.
RESULTS: Preoperatively, mean IOP measurements were 16.3±
CONCLUSION: The IOP is reduced after
surgery when measured with GAT and remained stable when measured with PDCT.
However, the agreement between GAT and PDCT is poor. Although PDCT may be a
more accurate predictor of the true IOP, it seems less suitable for daily use
in the clinical practice.
KEYWORDS: glaucoma;
intraocular pressure; intraocular surgery; trans pars plana vitrectomy
DOI:10.18240/ijo.2019.06.14
Citation: Kovacic H, Wolfs RCW, Kılıç E, Ramdas WD. Changes in intraocular pressure after intraocular eye
surgery―the influence of measuring technique. Int J Ophthalmol
2019;12(6):967-973
INTRODUCTION
Several studies reported a change in
intraocular pressure (IOP) after intraocular surgery. Most of them focused on
cataract extraction (CE), the most performed type of surgery in the world[1, 2, 3, 4,
5]. Trans pars plana vitrectomy (TPPV) is another type
of intraocular surgery that is performed regularly in the ophthalmic practice.
The indications and number of TPPVs performed are increasing. Although less is
known about the change in IOP after TPPV than after CE, studies have shown that
vitrectomy causes an elevation of 5%-35% of the IOP postoperatively[6, 7, 8]. In patients
who underwent CE the IOP decreased significantly, ranging from 14.2% to 21.1%
at one month follow-up[2, 3, 4, 5]. Also, after CE the number of
IOP-lowering medications was decreased in glaucoma patients[4,
9]. Patients with a high preoperative IOP or patient
who develop a deep anterior chamber postoperatively tend to have a greater
reduction in postoperative IOP, respectively 3.7±
The gold standard for measuring the
IOP still is Goldmann applanation tonometry (GAT)[19].
GAT measures the force that is needed to applanate the central cornea.
Therefore it is affected by the biomechanical properties of the cornea, like
the central corneal thickness and rigidity[20].
Pascal dynamic contour tonometry (PDCT) is another method of measuring the IOP[21]. In PDCT the measuring tip is made to match the
contour of the cornea, thus being less affected by the biomechanical properties
of the cornea[6, 20, 21].
The objective of this study is to
assess whether there are different changes in IOP after different types of
intraocular surgery (TPPV with or without CE).
SUBJECTS AND METHODS
Ethical Approval The Medical Ethics Committee of the
Erasmus University approved the study and the study adhered to the tenets of
the Declaration of Helsinki. For this study retrospective data of regular
visits of patients was used; therefore, neither a written informed consent was
required nor did the patients receive a stipend.
Participants All patients undergoing TPPV surgery
with or without CE by phacoemulsification with intraocular lens (IOL) implant
between March and July at the Erasmus Medical Center Rotterdam, the
Netherlands, were considered eligible. Eyes with an ocular trauma were excluded
from the study. Other exclusion criteria were: patients who were less mobile,
patients with cognitive impairment, patients with a corneal transplant, and
patients with surgical complications. Intraocular surgery consisted of TPPV or
a combination of TPPV and CE. The IOP was measured preoperatively, and 1mo
postoperatively.
Surgical Procedure In all patients, a 25-gauge TPPV
with or without laser coagulation was performed. Depending on the indication
for TPPV, the tamponades air, SF6-gas or oil were used. In the
TPPV+CE group, CE was performed in addition to the TPPV. CE consisted of
phacoemulsification with IOL implantation through a 2.4-mm corneoscleral
incision. The corneal incisions were self-sealing and left unsutured. Postoperatively,
all patients were treated with prednisolone 1.0% eye drops four times daily for
one week, and thereafter the eyedrops were tapered with 1 drop a week, in the
operated eye. All surgical procedures were completed without complications by
the same surgeon (Kılıç E). To minimize device-dependent IOP changes the same
surgical device was used[22, 23].
Ophthalmic Examination Patients underwent a comprehensive
ophthalmic examination before and after surgery. IOP was measured in both eyes,
where the non-operated eye served as a control. A drop of topical oxybuprocaine
0.4% mixed with fluorescence sodium 0.25% was introduced into both eyes. IOP
was measured with GAT (Haag-Streit, Köniz, Switzerland) and PDCT (SMT Swiss
Microtechnology, Zurich, Switzerland). Both devices had been calibrated conform
manufacturers standards. For a GAT measurement there is no quantitative quality
measurement, but PDCT registers the quality of the measurement. This
measurement (Q) is a number between 1 to 5, where Q1 is good, Q2 and Q3 are
acceptable, and Q4 and Q5 are poor measurements. If the PDCT quality
measurement was Q4 or Q5 the measurement was discarded. IOP was first measured
with GAT to prevent bias from the semiautomatic recording of PDCT. After two to
three minutes IOP was measured with PDCT. Measurements with both GAT and PDCT
were taken twice. A third measurement was taken if the difference in the first
two measurements was more than
The method of IOP measurement was
exactly the same before and after surgery. The measurement was taken one hour
before start of the intraocular surgery, before the start of the pre-operative
preparations. One month postoperatively, IOP was also measured with GAT and
PDCT according to a similar procedure. To minimize the possible effect of
diurnal variation in IOP the measurements were performed within a time frame of
one hour[24]. All IOP measurements were performed
by the same investigator (Kovacic H), except of the postoperative GAT
measurements (ophthalmic residents). The one-month postoperative appointments
were tracked with the electronic patient database of the hospital. General data
of the patient, such as age, gender, previous surgery, pre-operative
refraction, and axial length were recorded.
Statistical Analysis Analysis focused on the differences
between GAT and PDCT. First, we assessed the effect of the quality of the PDCT
measurement on IOP. Next, the agreement between GAT and PDCT was evaluated
statistically. Scatterplots were made for the preoperative and postoperative
averages of the GAT and PDCT. The Bland-Altman method, using Medcalc
The paired samples t-test was
used to assess the differences between pre- and postoperative IOP measurements
taken with GAT and those taken with PDCT. The Shapiro-Wilk test was used to
test the continuous data for normality. Differences in IOP between the TPPV and
TPPV+CE group were evaluated with the independent samples t-test or the
Mann-Whitney U test for continuous variables and the Chi-square test for
categorical variables. We also checked whether there were any postoperative
differences in IOP related to the type of tamponade used during TPPV. Linear
regression models were used to examine the associations between IOP and the
type of operation adjusted for age, gender and variables showing a significant
univariate difference between the TPPV and TPPV+CE group.
Statistical analyses were performed
using SPSS v22.0 for Windows (SPSS Inc., Chicago, IL, USA). A P-value of
<0.05 was considered statistically significant.
RESULTS
Forty-six eyes of 46 patients were included for analysis
and 46 contralateral eyes for comparison. The mean±standard deviation age was
64.1±13.7y, spherical equivalent was -1.4±4.2 D, axial length 23.9±
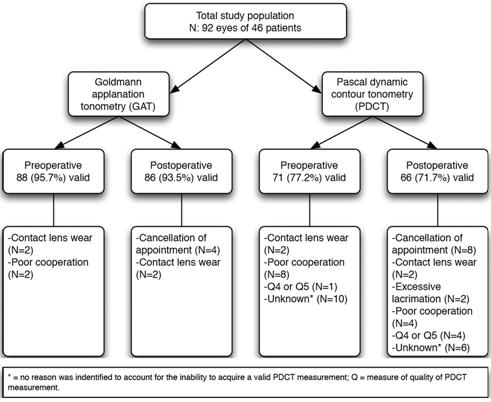
Figure 1 Flow chart of included
eyes.
Concerning the quality of
measurement values of the PDCT, no significant differences were observed in the
IOP between Q1, Q2 and Q3 preoperative (P=0.941) as well as
postoperative (P=0.608).
Figure
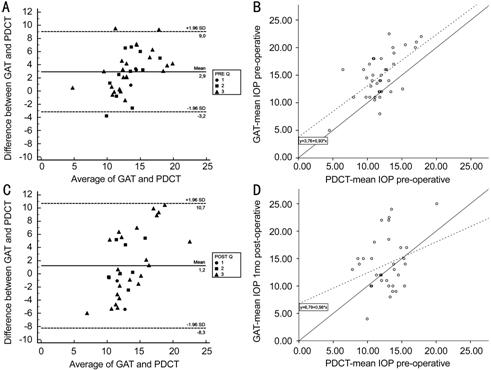
Figure 2 Bland-Altman plot of the
difference in preoperative (A) and postoperative (C) intraocular pressure (IOP)
between Goldmann applanation tonometry (GAT) and Pascal dynamic contour
tonometry (PDCT) plotted against the average IOP, with corresponding
scatterplot of the preoperative (B) and postoperative (D) average of GAT versus
the average of the PDCT In the Bland-Altman plot the solid
line represents the mean difference and the dashed lines represent the 95%
limits of agreement. The quality of the PDCT measurements are shown as circles
(Q1), squares (Q2), and triangles (Q3). In the scatterplot the solid line
represents the line y=x. The dashed line represents the regression line.
Table 1 show the difference in pre-
and postoperative IOP for the operated and non-operated eyes, respectively,
measured with GAT and PDCT. The mean IOP decreased significantly when measured
with GAT (P=0.011), but remained stable when measured with PDCT. As
expected, for the non-operated (control) eyes there was neither a significant
difference in IOP measured with GAT (P=0.673) nor with PDCT (P=0.137).
Table 1 Preoperative IOP of the
operated eyes and non-operated eyes measured with GAT and PDCT mean±SD, mm Hg
|
Parameters |
Preoperative |
Postoperative |
P |
|
Operated eyes |
|
|
|
|
IOP GAT |
16.3±6.0 |
14.3±5.6 |
0.011 |
|
IOP PDCT |
12.0±2.8 |
12.7±2.6 |
0.257 |
|
Non-operated eyes |
|
|
|
|
IOP GAT |
15.9±7.1 |
15.6±8.8 |
0.673 |
|
IOP PDCT |
12.3±2.9 |
13.0±2.5 |
0.137 |
GAT: Goldmann applanation tonometry; PDCT: Pascal dynamic
contour tonometry; IOP: Intraocular pressure.
The indications for TPPV were
epiretinal membrane (n=12 eyes), retinal detachment (n=13 eyes),
macular hole (n=6 eyes), vitreous hemorrhage (n=5 eyes),
vitreomacular traction syndrome (n=5 eyes), floaters (n=3 eyes),
and diagnostic vitreous biopsy (n=2 eyes). The types of tamponade used
were air (n=23 eyes), SF6-gas (n=12 eyes) and oil (n=11
eyes). There were no significant differences in type of tamponade used between
patients that underwent TPPV and those that underwent TPPV+CE. Furthermore,
differences in IOP between air, gas, and oil tamponades were not significant
when measured with GAT (P=0.327) and with PDCT (P=0.813).
In the univariate analysis no
significant differences in the baseline demographics of the patients between
TPPV and TPPV+CE were observed, except for previous surgery (P<0.001).
Table 2 shows the IOP between the TPPV and TPPV+CE group. Preoperatively, no
significant differences in IOP were found when measured with GAT (P=0.402)
and PDCT (P=0.063) between the TPPV and TPPV+CE group. Postoperatively,
there were also no significant differences in IOP measured with GAT (P=0.320);
however, with PDCT the IOP was significantly lower in the TPPV+CE group
compared to the TPPV group (P=0.012). Multivariate analysis (adjusted
for age, gender and previous surgery) did not change results. Concerning the
change in IOP (ΔIOP=postoperative IOP- preoperative IOP), in the TPPV+CE group the ΔIOP was significantly lower when
measured with GAT (P=0.044), while the ΔIOP was significantly higher in the
TPPV group when measured with PDCT (P=0.001). No differences in outcomes
were observed after exclusion of the TPPV’s for retinal re-detachment.
Table 2 Differences in IOP between
the TPPV and TPPV+CE group measured with GAT or PDCT
|
Parameters |
Preoperative |
Postoperative |
ΔIOPa |
|||
|
Mean±SD |
P |
Mean±SD |
P |
Mean±SD |
P |
|
|
GAT |
|
|
|
|
|
|
|
TPPV |
15.4±6.2 |
0.402
(0.938)b |
15.3±6.8 |
0.320
(0.655)b |
-0.4±4.5 |
0.044 |
|
TPPV+CE |
16.9±5.8 |
|
13.5±4.3 |
|
-3.4±5.0 |
|
|
PDCT |
|
|
|
|
|
|
|
TPPV |
10.9±2.4 |
0.063
(0.193)b |
13.8±2.2 |
0.012
(0.038)b |
3.0±3.4 |
0.001 |
|
TPPV+CE |
12.6±2.7 |
|
11.7±2.3 |
|
-1.0±2.4 |
|
aPostoperative IOP-preoperative IOP; bAdjusted
for age, gender and previous surgery; IOP: Intraocular pressure; GAT: Goldmann
applanation tonometry; PDCT: Pascal dynamic contour tonometry; TPPV: Trans pars
plana vitrectomy; CE: Cataract extraction.
DISCUSSION
In the present study, we found a
reduction in IOP after surgery when measured with GAT, while the IOP remained
unchanged when measured with PDCT.
When measured with GAT a significant
decrease in postoperative IOP was observed, which is consistent with previous
studies[2, 3]. Although corneal
hysteresis was not actually measured, this decrease might at least partly be
explained by a measurement error due to changes in the biomechanical properties
of the cornea. Changes in corneal biomechanical properties were shown before by
de Freitas Valbon et al[26]. They found a
significantly lower corneal resistance 30d after surgery, probably causing an
underestimation of measured IOP. However, other biomechanical properties did
not differ 30d postoperatively. Also, another study showed that differences
between PDCT and GAT are associated with biomechanical properties such as
central corneal thickness and corneal hysteresis[27].
However, the pathophysiological mechanism of the reduction in IOP after CE
still remains unclear. There are many different theories explaining the
possible mechanism. One of them is that CE leads to deepening of the anterior
chamber, facilitating aqueous outflow[14, 28,
29]. Another theory is that the surgical technique
used may play an important role[30]. Furthermore,
it has been suggested that interleukin-1 (IL-1) plays an important role in the
increase of the postoperative aqueous outflow facility. One study found that
IL-1 is being released together with tumor necrosis factors by cultured cells
of the trabecular meshwork. This in turn may lead to an increased production of
matrix metalloproteinases, which enhances tissue remodeling and reduces the
resistance of the extracellular matrix, thus increasing the facility of outflow[31].
We found no significant difference
in the pre- versus postoperative IOP when measured with PDCT. It could be that
GAT is underestimating the IOP due to surgery-induced changes in biomechanical
properties of the cornea. PDCT would not have this effect since the measuring
tip of the PDCT is concave and contour-matched, thus being less affected by the
change in the biomechanical properties of the cornea.
In non-operated eyes, which
functioned as control, no significant change occurred postoperatively when
measured with either GAT or PDCT. The mean IOP measured one month postoperative
was consistent with the mean IOP at baseline, as to be expected.
The mean IOP in operated as well as
non-operated eyes was higher when measured with GAT compared to PDCT when
measured preoperatively. It could be that GAT is systematically measuring a
higher IOP. One previous study comparing GAT and PDCT in phakic and in
pseudophakic eyes also found this effect in phakic eyes (18.0 and
According to our knowledge, this is
the first study comparing GAT with PDCT before and after TPPV and TPPV+CE
surgery. The IOP only differed between these groups when it was measured
postoperatively with PDCT, which could be a true IOP decrease not detected by
GAT due to measurement artifacts caused by possible changes in the
biomechanical properties of the cornea after surgery. Two studies compared the
IOP measured with GAT in patients who underwent TPPV and TPPV+CE. Both did not
find a significant difference between TPPV and TPPV+CE measured with GAT, which
is in agreement with the current GAT results[36, 37]. In our study, the change in mean IOP differed
between the TPPV and TPPV+CE group when it was measured with GAT as well as
PDCT. This might suggest that there is a difference in the change of
biomechanical properties of the cornea after TPPV and TPPV+CE.
Although the different TPPV
indications and tamponades may result in heterogeneity, it is not likely that
this influenced our results. For example, it is well known that in eyes with
retinal detachment IOP tends to be lower. However, we found no significant
differences in preoperative IOP between TPPV for the indication of retinal
detachment versus other indications when measured with GAT (P=0.352) as
well as PDCT (P=0.857). Therefore, it is not likely that this has
influenced the presented results. Only one study investigated the change in IOP
after TPPV by comparing GAT with PDCT. However, they focused on the difference
between GAT and PDCT when different types of tamponades were used, and found
that the change in IOP was independent of used tamponade[6].
Similarly, we could not find any significant difference in IOP between the
different tamponade-types measured with either GAT or PDCT. Another possible
limitation of this study is that preoperative GAT and PDCT measurements were
taken by the same trained researcher, whereas postoperative GAT measurements
were taken by ophthalmic residents. This could have led to interobserver
variability, which has already been proven to be a problem with GAT in previous
studies[33, 35, 38,
39, 40]. Nevertheless, the
variability of the postoperative measurements was similar to the preoperative
measurements, which diminishes the effect of interobserver variability.
In conclusion, the present study
shows a reduced IOP after surgery when measured with GAT and stable IOPs when
measured with PDCT. This difference might be influenced by changes in the
corneal biomechanical properties after the surgery. However, the difference in
pre- and postoperative IOP might also be due to GAT systematically measuring
higher IOP’s. Evaluation of corneal biomechanical properties such as corneal
hysteresis and corneal resistance factor combined with pre- and postoperative
measurements of GAT and PDCT is needed to further explore these findings.
ACKNOWLEDGEMENTS
Foundation: Supported by
Stichting Nederlands Oogheelkundig Onderzoek (SNOO).
Conflicts of Interest: Kovacic H, None; Wolfs
RCW, None; Kılıç E, None; Ramdas WD, None.
REFERENCES
|
1 He M, Wang W, Huang WY. Variations and trends in
health burden of visual impairment due to cataract: a global analysis. Invest
Ophthalmol Vis Sci 2017;58(10):4299-4306. |
|
|
|
|
|
2 Saccà S, Marletta A, Pascotto A, Barabino S, Rolando
M, Giannetti R, Calabria G. Daily tonometric curves after cataract surgery.
Br J Ophthalmol 2001;85(1):24-29. |
|
|
|
|
|
3 Leelachaikul Y, Euswas A. Long-term intraocular
pressure change after clear corneal phacoemulsification in Thai glaucoma
patients. Chotmaihet Thangphaet 2005;88(Suppl 9):S21-S25. |
|
|
|
|
|
4 Armstrong JJ, Wasiuta T, Kiatos E, Malvankar-Mehta M,
Hutnik CML. The effects of phacoemulsification on intraocular pressure and
topical medication use in patients with glaucoma: A systematic review and
meta-analysis of 3-year data. J Glaucoma 2017;26(6):511-522. |
|
|
|
|
|
5 Coh P, Moghimi S, Chen RI, Hsu CH, Masís Solano M,
Porco T, Lin SC. Lens position parameters as predictors of intraocular
pressure reduction after cataract surgery in glaucomatous versus
nonglaucomatous eyes. Invest Ophthalmol Vis Sci 2016;57(6):2593-2599. |
|
|
|
|
|
6 Donaldson MJ, Bhatnagar P, Dhrami-Gavazi E, Santos
RA, Barile GR, Del Priore LV, Iranmanesh R, Schiff WM, Chang S. Pascal
dynamic contour tonometry versus goldmann applanation tonometry in gas and
air-filled eyes after vitrectomy surgery. Retina 2009;29(4):481-486. |
|
|
|
|
|
7 Weinberg RS, Peyman GA, Huamonte FU. Elevation of
intraocular pressure after pars plana vitrectomy. Graefes Arch Clin Exp
Ophthalmol 1976;200(2):157-161. |
|
|
|
|
|
8 Han DP, Lewis H, Lambrou FH Jr, Mieler WF, Hartz A.
Mechanisms of intraocular pressure elevation after pars plana vitrectomy.
Ophthalmology 1989;96(9):1357-1362. |
|
|
|
|
|
9 Shingleton BJ, Gamell LS, O'Donoghue MW, Baylus SL,
King R. Long-term changes in intraocular pressure after clear corneal
phacoemulsification: normal patients versus glaucoma suspect and glaucoma
patients. J Cataract Refract Surg 1999;25(7):885-890. |
|
|
|
|
|
10 Shrivastava A, Singh K. The effect of cataract
extraction on intraocular pressure. Curr Opin Ophthalmol 2010;21(2):118-122. |
|
|
|
|
|
11 Guan H, Mick A, Porco T, Dolan BJ. Preoperative
factors associated with IOP reduction after cataract surgery. Optom Vis Sci
2013;90(2):179-184. |
|
|
|
|
|
12 Yang HS, Lee J, Choi S. Ocular biometric parameters
associated with intraocular pressure reduction after cataract surgery in
normal eyes. Am J Ophthalmol 2013;156(1):89-94.e1. |
|
|
|
|
|
13 Liu CJ, Cheng CY, Ko YC, Lau LI. Determinants of
long-term intraocular pressure after phacoemulsification in primary
angle-closure glaucoma. J Glaucoma 2011;20(9):566-570. |
|
|
|
|
|
14 Shin HC, Subrayan V, Tajunisah I. Changes in
anterior chamber depth and intraocular pressure after phacoemulsification in
eyes with occludable angles. J Cataract Refract Surg 2010;36(8):1289-1295. |
|
|
|
|
|
15 Mi CW, Thompson JT. Long-term follow-up of
intraocular pressure after vitrectomy in eyes without preexisting glaucoma.
Retina 2015;35(12): 2543-2551. |
|
|
|
|
|
16 Fang Y, Long QQ, Wang XQ, Jiang R, Sun XH.
Intraocular pressure 1y after vitrectomy in eyes without a history of
glaucoma or ocular hypertension. Clin Ophthalmol 2017;11:2091-2097. |
|
|
|
|
|
17 Miele A, Govetto A, Fumagalli C, Donati S, Biagini
I, Azzolini C, Rizzo S, Virgili G. Ocular hypertension and glaucoma following
vitrectomy: a systematic review. Retina 2018;38(5):883-890. |
|
|
|
|
|
18 Chang S. LXII Edward Jackson lecture: open angle
glaucoma after vitrectomy. Am J Ophthalmol 2006;141(6):1033-1043. |
|
|
|
|
|
19 Goldmann H, Schmidt T. Applanation tonometry.
Ophthalmologica 1957;134(4):221-242. |
|
|
|
|
|
20 Heinrich MA, Eppig T, Langenbucher A, Walter S,
Behrens-Baumann W, Viestenz A. Comparison of Goldmann applanation and dynamic
contour tonometry before and after cataract surgery. J Cataract Refract Surg
2012;38(4):683-689. |
|
|
|
|
|
21 Kanngiesser HE, Kniestedt C, Robert YC. Dynamic
contour tonometry: presentation of a new tonometer. J Glaucoma
2005;14(5):344-350. |
|
|
|
|
|
22 Kim YJ, Park SH, Choi KS. Fluctuation of infusion
pressure during microincision vitrectomy using the constellation vision
system. Retina 2015;35(12):2529-2536. |
|
|
|
|
|
23 Falabella P, Stefanini FR, Lue JC, Pfister M,
Reyes-Mckinley J, Koss MJ, Teixeira A, Schor P, Humayun MS. Intraocular
pressure changes during vitrectomy using constellation vision system's
intraocular pressure control feature. Retina 2016;36(7):1275-1280. |
|
|
|
|
|
24 Lee YW, Kim JM, Shim SH, Kim DY, Bae JH, Park KH.
The influence of a vitrectomy on the diurnal intraocular pressure. J
Ophthalmol 2015;2015:427808. |
|
|
|
|
|
25 Bland JM, Altman DG. Statistical methods for
assessing agreement between two methods of clinical measurement. Lancet
1986;1(8476): 307-310. |
|
|
|
|
|
26 de Freitas Valbon B, Ventura MP, da Silva RS, Canedo
AL, Velarde GC, Ambrósio R Jr. Central corneal thickness and biomechanical
changes after clear corneal phacoemulsification. J Refract Surg 2012;
28(3):215-219. |
|
|
|
|
|
27 Mangouritsas G, Mourtzoukos S, Mantzounis A,
Alexopoulos L. Comparison of Goldmann and Pascal tonometry in relation to
corneal hysteresis and central corneal thickness in nonglaucomatous eyes.
Clin Ophthalmol 2011;5:1071-1077. |
|
|
|
|
|
28 Huang GF, Gonzalez E, Lee R, Chen YC, He MG, Lin SC.
Association of biometric factors with anterior chamber angle widening and
intraocular pressure reduction after uneventful phacoemulsification for
cataract. J Cataract Refract Surg 2012;38(1):108-116. |
|
|
|
|
|
29 Slabaugh MA, Bojikian KD, Moore DB, Chen PP. The
effect of phacoemulsification on intraocular pressure in medically controlled
open-angle glaucoma patients. Am J Ophthalmol 2014;157(1):26-31. |
|
|
|
|
|
30 Meyer MA, Savitt ML, Kopitas E. The effect of
phacoemulsification on aqueous outflow facility. Ophthalmology
1997;104(8):1221-1227. |
|
|
|
|
|
31 Wang N, Chintala SK, Fini ME, Schuman JS. Ultrasound
activates the TM ELAM-1/IL-1/NF-kappaB response: a potential mechanism for
intraocular pressure reduction after phacoemulsification. Invest Ophthalmol
Vis Sci 2003;44(5):1977-1981. |
|
|
|
|
|
32 Mamas N, Fuest M, Koutsonas A, Roessler G, Mazinani
BE, Walter P, Plange N. Goldmann applanation tonometry versus dynamic contour
tonometry after vitrectomy. J Glaucoma 2016;25(8):663-668. |
|
|
|
|
|
33 Jordão ML, Costa VP, Rodrigues Mde L, Paula JS.
Comparison of dynamic contour tonometry and Goldmann applanation tonometry in
relation to central corneal thickness in primary congenital glaucoma. Graefes
Arch Clin Exp Ophthalmol 2013;251(1):117-121. |
|
|
|
|
|
34 Duba I, Wirthlin AC. Dynamic contour tonometry for
post-LASIK intraocular pressure measurements. Klin Monbl Augenheilkd
2004;221(5): 347-350. |
|
|
|
|
|
35 Anderson MF, Agius-Fernandez A, Kaye SB. Comparison
of the utility of Pascal dynamic contour tonometry with Goldmann applanation
tonometry in routine clinical practice. J Glaucoma 2013;22(5):422-426. |
|
|
|
|
|
36 Yang HK, Woo SJ, Park KH, Park KH. Intraocular
pressure changes after vitrectomy with and without combined
phacoemulsification and intraocular lens implantation. Korean J Ophthalmol
2010;24(6):341-346. |
|
|
|
|
|
37 Arikan Yorgun M, Toklu Y, Mutlu M, Ozen U. Clinical
outcomes of 25-gauge vitrectomy surgery for vitreoretinal diseases:
comparison of vitrectomy alone and phaco-vitrectomy. Int J Ophthalmol
2016;9(8): 1163-1169. |
|
|
|
|
|
38 Wang AS, Alencar LM, Weinreb RN, Tafreshi A, Deokule
S, Vizzeri G, Medeiros FA. Repeatability and reproducibility of Goldmann
applanation, dynamic contour, and ocular response analyzer tonometry. J
Glaucoma 2013;22(2):127-132. |
|
|
|
|
|
39 Albis-Donado O, Bhartiya S, Gil-Reyes M,
Casale-Vargas G, Arreguin-Rebollar N, Kahook MY. Citius, altius, fortius:
agreement between perkins and dynamic contour tonometry (Pascal) and the
impact of altitude. J Curr Glaucoma Pract 2018;12(1):40-44. |
|
|
|
|
|
40 Kotecha A, White E, Schlottmann PG, Garway-Heath DF.
Intraocular pressure measurement precision with the Goldmann applanation,
dynamic contour, and ocular response analyzer tonometers. Ophthalmology
2010;117(4):730-737. |
|