
Citation: Garrido-Hermosilla
AM, Méndez-Muros M, Gutiérrez-Sánchez E, Morales-Portillo C, Díaz-Granda MJ,
Esteban-González E, Relimpio-López I, Martínez-Brocca MA,
Rodríguez-de-la-Rúa-Franch E. Renal function and choroidal thickness using
swept-source optical coherence tomography in diabetic patients. Int J
Ophthalmol 2019;12(6):985-989
DOI:10.18240/ijo.2019.06.17
・Clinical Research・
Renal
function and choroidal thickness using swept-source optical coherence
tomography in diabetic patients
Antonio Manuel Garrido-Hermosilla1,2, Mariola
Méndez-Muros3, Estanislao Gutiérrez-Sánchez1,2, Cristóbal
Morales-Portillo3, María Jesús Díaz-Granda1,2, Eduardo
Esteban-González1,2, Isabel Relimpio-López1,2, María
Asunción Martínez-Brocca3, Enrique Rodríguez-de-la-Rúa-Franch1,2
1Department
of Ophthalmology, Virgen Macarena University Hospital, Seville 41009, Spain
2OftaRed, Institute
of Health Carlos III, Madrid, Spain
3Department
of Endocrinology and Nutrition, Virgen Macarena University Hospital, Seville
41009, Spain
Correspondence
to: Antonio
Manuel Garrido-Hermosilla. Department of Ophthalmology, Virgen Macarena
University Hospital, 3 Doctor Fedriani Avenue, Seville 41009, Spain.
gaherfamily@hotmail.com
Received:
Abstract
AIM: To assess the relationship between choroidal thickness and renal function
in diabetic patients.
METHODS: Cross-sectional retrospective clinical study of 42
eyes of 21 ocular treatment-naïve diabetic patients. Demographic data included:
age, sex, type and course of diabetes. Ocular data included: severity of
diabetic retinopathy; retinal thickness at the central macular region, as well
as choroidal thickness at the central and paracentral quadrants, using
automatically generated maps by swept-source optical coherence tomography;
presence of cystic macular edema; and ocular axial length (AXL). Lab-test
parameters included: glycated hemoglobin (HbA
RESULTS: A significant negative correlation was mainly
observed between several choroidal thicknesses, age (P<0.020) and
ocular AXL (P<0.030). On the contrary, a significant positive
correlation was found between all choroidal thicknesses, HbA
CONCLUSION: Choroidal thickness can represent an additional
tool to help clinicians predicting the renal status in ocular treatment-naïve
diabetic patients.
KEYWORDS: choroidal thickness; renal function;
swept-source optical coherence tomography; spectral-domain optical coherence
tomography; diabetes mellitus
DOI:10.18240/ijo.2019.06.17
Citation: Garrido-Hermosilla
AM, Méndez-Muros M, Gutiérrez-Sánchez E, Morales-Portillo C, Díaz-Granda MJ,
Esteban-González E, Relimpio-López I, Martínez-Brocca MA,
Rodríguez-de-la-Rúa-Franch E. Renal function and choroidal thickness using
swept-source optical coherence tomography in diabetic patients. Int J
Ophthalmol 2019;12(6):985-989
INTRODUCTION
Diabetes
mellitus (DM) is a complex progressive disease associated with multiple
physiopathological alterations that ultimately cause macro- and microvascular
complications (nephropathy, retinopathy and/or neuropathy)[1]. The prevalence of DM has increased in
the last decades and has become a major clinical and social concern due to its
economic burden and associated premature mortality. The overall prevalence of
DM in Spain (types 1 and 2) in subjects >18 years of age is 13.8%[2], with a remarkably higher prevalence of DM2, which
accounts for 90% of DM[3].
DM is the
main cause of chronic kidney disease (CKD) in developed countries[4]. Diabetic patients are three times more likely to
develop CKD as compared to non-diabetic subjects. The natural course of
diabetic nephropathy is characterized by changes in urinary excretion of
albumin, which are divided into three phases: normoalbuminuria,
microalbuminuria (MA) and proteinuria. The proportion of patients with DM2 who
develop MA at 10y after diagnosis is approximately 25%. The presence of MA is
known to increase overall mortality, cardiovascular morbimortality, the risk
for end-stage renal disease (ESRD) and the risk for proliferative diabetic
retinopathy. However, the correlation of MA with early-stage retinopathy is
still unclear[5].
There is
scant literature assessing the relationship between retinal structural changes
and renal function in subjects with DM. It has long been known that diabetic
patients with chronic retinopathy and nephropathy experience a thickening of
glomerular and retinal capillary vessels. This is suggestive that DM and renal
function may share microvascular pathogenic mechanisms related to abnormalities
in glucose metabolism, inflammatory alterations and endothelial dysfunction[6]. A recent study revealed that renal dysfunction might
be associated with a reduced retinal blood flow in early-stage diabetic
retinopathy[7].
The
development of swept-source optical coherence tomography (SS-OCT) has allowed
to detect diagnostic alterations related to chorioretinopathies including
diabetic chorioretinopathy. The use of a longer laser wavelength (1050 nm) in
SS-OCT scans has helped minimize dispersion caused by the retinal pigment
epithelium. Thus, SS-OCT provides a clear picture of the outer retinal layers,
primarily the choroid. Ultrahigh speed imaging (100
Previous
studies based on electronic microscopy have already recorded the presence of
vascular abnormalities in diabetic choriodopathy similar to those found in
retinopathy (microaneurysms, tortuous vessels, non-perfused quadrants, etc.)[8]. New high-resolution devices will help better
understand the choroid, the vascular layer of the eye which provides oxygen and
nourishment to the outer layers of the retina. Choroidal alterations may
precede findings related to the presence of retinopathy in fundoscopy.
The primary goal of this study
was to investigate the relationship between choroidal thickness in diabetic
patients and their demographic, ocular and lab-test characteristics, with
special focus on renal function parameters.
SUBJECTS AND METHODS
Ethical Approval This study protocol has been approved by the Ethics
Committee of the Virgen Macarena and Virgen del Rocío University Hospitals and
adheres to the tenets of the Declaration of Helsinki. All recruited patients
provided informed consent ahead of participation.
A cross-sectional study of 42
eyes of 21 diabetic patients referred from the Department of Endocrinology to
the Department of Ophthalmology for regular fundus examination during the first
semester of 2016.
Inclusion criteria were: 1)
diabetic patients without any previous treatment based on argon-laser retinal
photocoagulation, intravitreal injection of antiangiogenic drugs or pars plana
vitrectomy; 2) myopic or hypermetropic refractive error <6 diopters; 3)
ocular axial length (AXL) between 21 and
Based on these criteria, only 1
of the 42 eyes selected was excluded, as the patient had a severe amblyopia in
her left eye that hindered eye fixation during scanning. The right eye did meet
inclusion criteria.
Study variables included: 1)
demographic variables: age; sex; type and course of diabetes. 2) Ocular
parameters: severity of diabetic retinopathy based on 7-standard field fundus
photography performed using Visucam 500 (Carl Zeiss Meditec AG, Jena, Germany);
retinal thickness (Figure
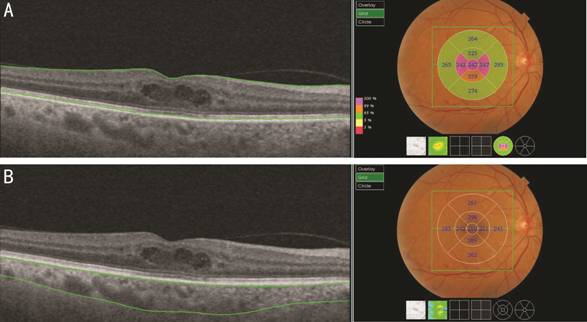
Figure 1 SS-OCT scans showing
retinal (A) and choroidal (B) thickness maps generated by automatic layer
segmentation Intraretinal cysts can be seen in the macular region.
Statistical analysis was
performed using IBM SPSS version 23.0 for Windows (SPSS Inc., Chicago,
Illinois, USA) and Excel 2013 spreadsheets (Microsoft Corporation, Redmond,
Washington, USA).
Quantitative variables were
expressed as means and standard deviations, whereas qualitative variables were
expressed as percentages. Linear associations between quantitative variables
were determined by Spearman’s rank correlation coefficients. The absence of
autocorrelation between adjacent observations was confirmed by the Durbin-Watson
test. Thus, analysis was performed in 41 eyes.
For bivariate analysis of
normally distributed quantitative and qualitative variables (Shapiro-Wilk
test), Student’s t-test was used to compare two independent samples, and
ANOVA was used for more than two independent samples. In case of abnormal
distribution, Mann-Whitney U and Kruskal-Wallis non-parametric tests
were performed, respectively. A P value <0.05 was considered
statistically significant.
RESULTS
Descriptive Analysis
Demographic variables Mean age was 49.76±17.61y (ranging from 18 to 74y) and
52.4% of study subjects were male. Most patients had type 2 DM (66.7%) and the
mean duration of disease was 12.14±10.08y.
Ocular variables The mean ocular AXL was 23.14±
Lab-test parameters The mean HbA
Bivariate Analysis of Choroidal
Thickness
Demographic variables A statistically significant negative correlation was
observed between age and C-CT (P=0.010), IS-CT (P=0.016), IT-CT (P=0.007),
and II-CT (P=0.006). In contrast, years of evolution of diabetes were not
observed to be significantly correlated to choroidal thickness. Statistically
significant differences were also observed in CMT (P=0.0005) and IN-CT (P=0.048)
between men and women, as well as in C-CT (P=0.040) and IT-CT (P=0.025)
by type of diabetes.
Ocular variables Ocular AXL was found to be negatively correlated to C-CT
(P=0.029), IN-CT (P=0.006), and II-CT (P=0.012). There
were no significant differences between the right and the left eye in any
choroidal thickness. In relation to the grade of diabetic retinopathy,
differences were only observed in IT-CT (P=0.016). Nevertheless, a
non-significant inverse trend was observed in choroidal thickness as the
severity of NPDR increased. Patients with CME showed a statistically
significant increase of CMT (P=0.048) accompanied by a general
non-significant choroidal thinning.
Quantitative
lab-test parameters Among renal function parameters,
albuminuria was found to have a statistically significant positive correlation
with chorioretinal thicknesses, occurring the same with glycosylated hemoglobin
(Table 1).
Table 1 Correlations between
chorioretinal thicknesses, renal function parameters and HbA
|
Parameters |
A |
ACR |
GFR CKD-EPI |
GFR MDRD-4 |
HbA |
|
CMT |
|
|
|
|
|
|
Correlation coefficient |
0.428 |
0.226 |
-0.139 |
-0.148 |
0.336 |
|
P |
0.005 |
0.156 |
0.385 |
0.357 |
0.031 |
|
C-CT |
|
|
|
|
|
|
Correlation coefficient |
0.394 |
0.181 |
0.104 |
0.018 |
0.412 |
|
P |
0.011 |
0.258 |
0.517 |
0.912 |
0.007 |
|
IN-CT |
|
|
|
|
|
|
Correlation coefficient |
0.324 |
0.145 |
0.091 |
0.031 |
0.374 |
|
P |
0.039 |
0.364 |
0.570 |
0.846 |
0.016 |
|
IS-CT |
|
|
|
|
|
|
Correlation coefficient |
0.389 |
0.231 |
0.024 |
-0.092 |
0.432 |
|
P |
0.012 |
0.147 |
0.884 |
0.567 |
0.005 |
|
IT-CT |
|
|
|
|
|
|
Correlation coefficient |
0.359 |
0.145 |
0.131 |
0.013 |
0.441 |
|
P |
0.021 |
0.365 |
0.415 |
0.937 |
0.004 |
|
II-CT |
|
|
|
|
|
|
Correlation coefficient |
0.351 |
0.114 |
0.276 |
0.194 |
0.359 |
|
P |
0.025 |
0.477 |
0.081 |
0.224 |
0.021 |
A: Albuminuria; ACR:
Albumin/creatinine ratio in urine; GFR CKD-EPI: Glomerular filtration rate
based on the CKD-EPI formula; GFR MDRD-4: Glomerular filtration rate based on
the MDRD-4 formula; HbA
DISCUSSION
The distribution of choroidal
thicknesses in diabetic patients has been proven to be similar to that in
non-diabetic patients, with the superior quadrant thicker than the inferior,
and the temporal thicker than the nasal quadrant[9].
Likewise, evidence has been obtained that HbA
Comparative studies of choroidal
thickness in diabetic patients with retinopathy and/or macular edema reveal a
tendency to thinning[11], although statistically
significant results have not been obtained in our investigation. In contrast,
some studies have reported choroidal thickening in diabetic patients without
retinopathy[12], or independently of disease
stage[13]. Other studies have uncovered choroidal
thinning in diabetic patients treated with argon laser or intravitreal
injections of antiangiogenic drugs, as they reduce vascular permeability[14]. In addition, the thinning of the choroid with age
and ocular AXL, reported in previous publications[11],
is supported by the results of our study. The advantage of the SS-OCT device
used for chorioretinal measurements is that it provides automatically generated
maps based on the standard ETDRS grid, versus manual measurements with
substantial intra- and inter-observer differences of up to 32 µm[15]. Circadian variations in choroidal thickness should
be taken into account as well. It has been observed that choroidal thickness
progressively decreases between
Regarding the renal function,
considering the growing incidence of DM and diabetic nephropathy worldwide,
early detection of the disease is crucial, as it allows to administer timely
therapies and prevent progression to ESRD. Urine markers, especially MA, play a
major role in early detection. MA is also a marker of generalized endothelial
dysfunction associated with DM, thus linking renal impairment to cardiovascular
and brain compromise. It has been demonstrated that MA is not only a marker of
glomerular injury, but also of renal tubular lesions. Ongoing studies are
analyzing other urine markers (transferrin, ceruloplasmin), which could precede
the establishment of MA in some patients[18].
The reduction of GFR generally
occurs secondary to MA, although it may also occur in patients with
normoalbuminuria[19]. For this reason, we
quantified albuminuria levels in all patients, not only in patients with MA
(30-300 mg/L). MA has a variable course. It can return to normal levels,
progress to macroalbuminuria, or remain stable without any changes. Even so, MA
has been proven to be a predictor of cardiovascular risk and ESRD in diabetic
patients[20].
A recent paper assessed the
relationship between MA and choroidal thickness[21].
The authors documented a significant thinning of the choroid in the group of
patients with DM2 and MA, especially at the subfoveal and temporal to the fovea
regions. In that study, where SD-OCT scanning was used, choroidal thicknesses
were measured manually by an experienced operator at several points of a
horizontal section through the fovea. Additionally, confounding factors such as
ocular AXL, refractive errors or capture time were not considered, at least
initially, as a replica study was performed later[22].
In contrast, our study included patients with DM1 and 2, with non-excluding
refractory defects and ocular AXL. Albuminuria levels were correlated with
choroidal thicknesses automatically mapped on ETDRS grids by SS-OCT. Scans were
performed within the same hour range. We found a statistically significant
positive correlation between albuminuria levels and all choroidal thicknesses
measured. These results are in agreement with those of previous studies
reporting a thickening of the choroid in diabetic patients without retinopathy[12], or independently of disease stage[13],
probably associated with a vascular hyperpermeability status.
Another
study performed in 2013 documented a thinning of the choroid following
hemodialysis in non-diabetic patients[23]. The
authors theorized that ultrafiltration may induce hypovolemia and increase
plasma oncotic pressure, which would reduce intraocular pressure and choroidal
thickness. Therefore, the opposite would occur when albuminuria increases.
Subsequent studies demonstrated greater reduction in choroidal thickness after
hemodialysis in diabetic patients with ESRD[24-25]. The authors speculated that it might be due to
diabetes-related vascular changes in the choroid, including alterations in its
autonomic regulation.
In conclusion, choroidal
thickness could represent an additional tool to help clinicians predicting the
renal status in ocular treatment-naïve diabetic patients. Nevertheless, the
preliminary retrospective cross-sectional design without a control group and the
limited sample size of this study require that larger, prospective, long-term
studies are conducted to confirm the results obtained and elucidate the role of
choroidopathy in the prognosis of diabetic retinopathy.
ACKNOWLEDGEMENTS
We would like to express our
gratitude to Prof. Ana Fernández Palacín, Ph.D., for her selfless help with the
statical analysis. We also thank Miss Nuria Hernández Buendía for her
translation work.
Authors’ contributions: Garrido-Hermosilla AM designed the study. Garrido-Hermosilla
AM and Méndez-Muros M were major contributors in acquisition, analysis and
interpretation of the study data, as well as in writing the manuscript.
Gutiérrez-Sánchez E, Morales-Portillo C, Díaz-Granda MJ, Esteban-González E,
Relimpio-López I, Martínez-Brocca MA and Rodríguez-de-la-Rúa-Franch E
contributed to interpret the study data and revise the manuscript. All authors
read and approved the final manuscript.
Conflicts of
Interest: Garrido-Hermosilla
AM, None; Méndez-Muros M, None; Gutiérrez-Sánchez E, None; Morales-Portillo
C, None; Díaz-Granda MJ, None; Esteban-González E, None; Relimpio-López
I, None; Martínez-Brocca MA, None; Rodríguez-de-la-Rúa-Franch E,
None.
REFERENCES