
Citation: Yilmaz H,
Durukan AH. Disorganization
of the retinal inner layers as a prognostic factor in eyes with central retinal
artery occlusion. Int J Ophthalmol 2019;12(6):990-995
DOI:10.18240/ijo.2019.06.18
・Clinical Research・
Disorganization
of the retinal inner layers as a prognostic factor in eyes with central retinal
artery occlusion
Hayati Yilmaz1, Ali H.
Durukan2
1Department of Ophthalmology, Mengucek Gazi Training and Research Hospital,
Erzincan 24000, Turkey
2Department of Ophthalmology, Gulhane Medical Faculty, Ankara 06010, Turkey
Correspondence to: Hayati Yilmaz. Department of Ophthalmology, Mengucek
Gazi Training and Research Hospital, Erzincan 24000, Turkey. dr.hyilmaz@hotmail.com
Received:
Abstract
AIM: To evaluate
baseline foveal disorganisation of retinal inner layers (DRIL) as a prognostic
factor in eyes with central retinal artery occlusion
(CRAO).
METHODS:
Twenty-eight CRAO patients who were followed-up between 2010 and 2016 were
retrospectively investigated. Demographic characteristics and detailed
ophthalmological examination findings of all patients were recorded. Macular
thicknesses (MTs) from 5
separate spots and DRIL were measured with spectral-domain optic coherence
tomography (SD-OCT). Correlations between DRIL score and logMAR converted
visual acuity (VA), change in VA, patient reference time (RT), number
of hyperbaric oxygen therapy (HBOT) sessions, MT and MT change were
investigated.
RESULTS: There was
a positive correlation between the DRIL score and the final VA (r=0.787)
and a negative correlation with the change in VA (r=-0.763). The RT and
MT were closely related to the DRIL score. A negative correlation was found
between the number of HBOT sessions and the DRIL score (r=-0.341).
CONCLUSION: The DRIL score is a parameter assessed by SD-OCT, which can provide us
reliable information regarding the prognosis of visual functions and response
to the treatment for CRAO patients at acute phase.
KEYWORDS: central retinal artery occlusion;
disorganisation; inner retina; spectral-domain optic coherence tomography;
prognosis
DOI:10.18240/ijo.2019.06.18
Citation: Yilmaz H, Durukan AH. Disorganization of the retinal
inner layers as a prognostic factor in eyes with central retinal artery
occlusion. Int J Ophthalmol 2019;12(6):990-995
INTRODUCTION
Central retinal artery occlusion (CRAO) is a rare disease of the eye that
could cause catastrophic result. Up-to-date treatment algorithms are not enough
for this disease and there are still ongoing studies for new treatments.
Moreover, there is not enough data to understand the prognosis. Hayreh and Zimmerman[1] described that
the most important factor is the type of the disease, but no reliable methods
exist to determine which individuals with CRAO will gain or lose vision over
time and which individuals could respond well to the treatments.
The noninvasive, easily performed imaging method of spectral-domain optical
coherence tomography (SD-OCT) ensures reliable, high-quality and
high-resolution imaging of retinal structures. Previous studies showed that at
acute phase, macular thickness (MT) is not correlated with the final visual acuity (VA) of
CRAO but it is correlated with the final MT and macular thickness change (MTC)[2]. It is very important to find out new reliable
parameters to understand the prognosis of CRAO at the acute phase of the
disease and its respond to treatment modalities.
Studies in diabetic macular edema (DME) revealed that disorganisation of
retinal inner layers (DRIL) is an important factor for visual prognosis[3-4]. DRIL was also found to be sensitive and specific
diagnostic parameter of capillary non-perfusion in diabetic retinopathy[5]. It is very likely to find out the same results with
CRAO patients. In this study, we evaluated baseline foveal DRIL and other
SD-OCT parameters to assess how they predict VA in eyes with CRAO.
SUBJECTS AND METHODS
Ethical
Approval The study
protocol was approved by the Kecioren Training and Research Hospital Ethical
Committee and adhered to the tenets of the Declaration of Helsinki. This was a
single-site, retrospective cohort study made in Ophthalmology Department of the
Gulhane Military Medical School, which is a tertiary center with a hyperbaric
oxygen therapy (HBOT) unit. Written informed consent was taken from all the
subjects after explaining the nature of the study.
Study Subjects The medical
charts of patients who followed up between January 2010 and January 2016,
in Ophthalmology Department of Gulhane Military Medical School, were
retrospectively reviewed. Inclusion criteria were: 1) diagnosis of acute CRAO; 2) completed
follow up more than 3mo; 3)
having fluorescein angiography (FFA), SD-OCT and fundus photography at the
initial visits. Exclusion criteria were: 1) anterior segment diseases such as
cataract and corneal opacities that reduces the quality of the FFA and SD-OCT
images; 2) posterior
segment diseases such as macular degeneration and vitreomacular traction; 3) optic
coherence tomography (OCT) image quality
score <7; 4)
cilioretinal artery sparing.
All subjects underwent standard threatment including ocular massage
(repeated manual compression for 10s followed by sudden release, for 10min),
anti-glaucomatous agents (topical timolol and dorzolamide combination drops and
intravenous 20% mannitol 100 mL), anti-platelet aggregating agents (oral
acetylsalicylic acid 100 mg). All subjects were also referred immediately to
the Undersea and Hyperbaric Oxygen unit and underwent HBOT sessions. The HBOT
sessions were terminated when there is no change in VA for last 2 sessions.
Demographic Data and Ophthalmic Examinations All subjects’
demographic data were recorded. All patients in this study had detailed
ophthalmic exeminations including best corrected visual aquity (BCVA) by logMAR
chart, slit-lamp biomicroscopy, non-contact tonometry, fundus photography, FA
and SD-OCT. OCT examinations were perfomed by Spectralis (Hidelberg
Engineering, Germany) and FAs were performed by HRA (Hidelberg Engineering,
Germany) at each visit by the same technician.
The difference between the first and last BCVA was recorded. The increase
of 0.3 or more was accepted as clinically significant increase of the BCVA[6].
Macular Thickness Measurement The MT was
calculated manually at the foveal scan at 5 seperate points because most
patients could not fixate the fovea due to severely impaired VA. Five seperate
points were foveal thickness (FT), nasal
parafoveal thickness (NpaT; 500 µm away
nasally from the fovea), nasal perifoveal thickness (NpeT; 1500 µm away
nasally from the fovea), temporal parafoveal thickness (TpaT; 500 µm away temporally
from the fovea) and temporal perifoveal thickness (TpeT; 1500 µm away
temporally from the fovea). MTs in both eyes measured at initial and final OCT
examinations. MTC (first MT -last MT) was calculated by using SPSS ver. 21 (IBM,
Armonk, New York, USA).
Definition and Analysis of the Disorganisation of Retinal Inner Layers The SD-OCT scan
passing through the foveal center was selected along with 3 B-scans immediately
above and below, for a total of 7 scans. DRIL was defined as the inability to identify
any boundaries between the ganglion cell-inner plexiform
layer complex, inner nuclear layer, and outer plexiform layer. This definition
of the DRIL is maintained from Nicholson et al[5].
For each 7 scans DRIL was searched in 1000 µm centered the fovea and for each
scan if the detected DRIL was grater than 500 µm, that scan
accepted as DRIL (+) (Figure 1) than
the score of DRIL calculated by accumulating the DRIL (+) scans. All subjects
have been scored between 0 [no
DRIL (+) scan] to 7 [all scans are
DRIL (+)].
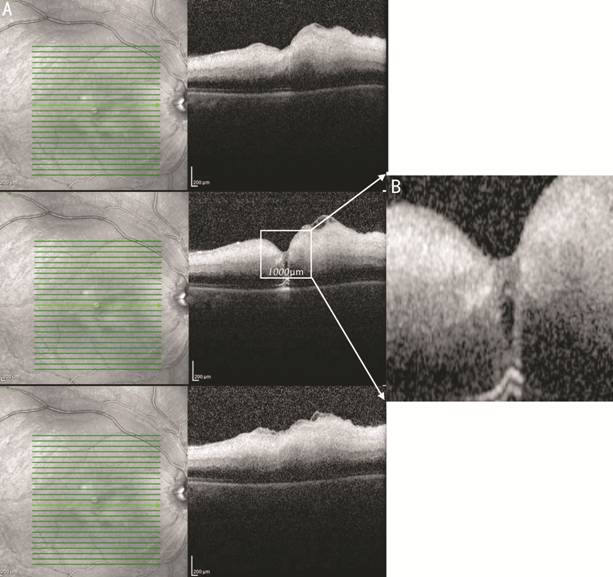
Figure 1 Determining the DRIL of a patient with CRAO A: Central 3
OCT images; B: Magnified
central 1000 µm section of the fovea. As shown in this figure the boundaries of
retinal inner layers could not be distinguished.
After all the OCT examinations recorded, correlations between the possible
prognostic factors such as age, reference time (RT) to the clinic,
mean MT, MTC, DRIL scores and VA measurements were analysed. The correlations
between the number of HBOT sessions, VA measurements and DRIL scores were also
analyzed.
Statistics SPSS ver. 21.0
(IBM, Armonk, New York, USA) was used to analyze data. Standard deviations,
means, percents were made to identificate the data. The t-test or Mann-Whitney U
test was used to compare the before and after data. Correlations between the
data were maintained by Pearson’s correlation test. P<0.05 considered
statistically significant in this study.
RESULTS
Twenty-eight eyes of 28 patients were studied. Participants had a mean age
of 63.39±13.86y. Mean (min-max) follow-up time was 11.39 (3-30)mo. Forty-two
percent of the participants were female and 53.6% of the affected eyes were
right side. The mean application time to the clinic after the first symptoms
occurred (RT) was 22.3±7.8h. Patients baseline characteristics including
intraocular pressure (IOP) are presented in Table 1.
Table 1 Patient baseline characteristics
|
Parameters |
Data |
|
Age (y), mean±SD |
63.39±13.86 |
|
Gender, n (%) |
|
|
F |
12 (42.8) |
|
M |
16 (57.2) |
|
Bilaterality, n (%) |
|
|
R |
15 (53.6) |
|
L |
13 (46.4) |
|
Referance time (h), mean±SD |
22.3±7.8 |
|
Follow up time (mo), mean
(min-max) |
11.39 (3-30) |
|
IOP, mean±SD |
14±3.32 |
At the first examination mean BCVA was 2.68±0.73 and it was 1.82±1.03 for
the last. The increase of the BCVA was statistically different (P<0.01).
The mean difference between first and last BCVAs was 0.85±0.97. Improvement of
the VA was clinically significant for 17 (60.7%) patients.
Macular Thickness The mean MT at
the initial and final OCT examinations for both eyes and mean MTC for the
affected eyes are presented in Table 2. For the affected eye, the MT at the first
examinations were much thicker than MT at the last examinations (P<0.01).
The affected eyes’ MT were thicker then the fellow eyes’ MT at the first
examination and thinner at the last (P<0.01).
Table 2 The affected and the fellow eyes’ mean MT at the initial
and final exams and MTC
|
MT locations |
Affected eye |
Fellow eye |
MTC |
Pa |
Pb |
|
FT, first |
293.1 (159) |
196.4 (26.1) |
107.8 |
0.001 |
<0.01 |
|
FT, last |
185.3 (60.4) |
202.5 (51.1) |
0.005 |
||
|
NPaT, first |
435.8 (132.5) |
273.6 (25.1) |
223.1 |
<0.01 |
<0.01 |
|
NPaT, last |
212.7 (43.5) |
274.4 (35.2) |
<0.01 |
||
|
TPaT, first |
399 (121.3) |
275.1 (28.6) |
192.1 |
<0.01 |
<0.01 |
|
TPaT, last |
206.9 (54.7) |
272.5 (41.3) |
<0.01 |
||
|
NPeT, first |
440 (93.4) |
319.9 (28.1) |
217.8 |
<0.01 |
<0.01 |
|
NPeT, last |
222.2 (47.8) |
309.8 (32.6) |
<0.01 |
||
|
TPeT, first |
392.3 (98.6) |
298.3 (31.7) |
189.7 |
<0.01 |
<0.01 |
|
TPeT, last |
202.6 (56) |
285 (96) |
<0.01 |
MTC: Macular thickness change, FT: Foveal thickness; NPaT: Nasal parafoveal
thickness; TPaT: Temporal parafoveal thickness; NPeT: Nasal perifoveal
thickness; TPeT: Temporal perifoveal thickness. aComparison of
affected eyes’ initial and final mean MT with Wilcoxson Signed Ranks test; bComparison of
affected and fellow eyes’ mean MT
with Wilcoxson Signed Ranks test.
Disorganisation of Retinal Inner Layers
DRIL scores’ distribution is presented in Table 3. Due to imbalance of the
distribution it was impossible to compare scores with each other. Because of
this 2 different groups were created. The subjects who had the scores of 0, 1,
2, 3 were included to DRIL-A group, and other scores were included to DRIL-B.
Table 3 Distribition of the score of DRIL
|
The score of DRIL |
0 |
1 |
2 |
3 |
4 |
5 |
6 |
7 |
|
n (%) |
0 |
3 (1) |
1 (0.3) |
5 (17.8) |
1 (0.3) |
2 (0.7) |
3 (1) |
13 (46.4) |
DRIL: Disorganization of retinal inner layers.
Investigation of the Efficacy of Hyperbaric Oxygen Therapy The
correlations between HBOT sessions count, initial and final BCVA were not
significant. There was a positive correlation between HBOT sessions and the
difference of BCVAs (Pearson’s correlation test, r=0.435) and negative
correlation with the DRIL score (Pearson’s correlation test, r=-0.341).
Investigation of Some Possible Prognostic Factors and DRIL as a Prognostic
Factor Correlations
between BCVA measurements and possible prognostic factors are presented in
Table 4. There were high correlations with all the parameters except initial
BCVA, age, the first FT and the first TPeT. The correlations between MTC and
BCVA measurements with DRIL score was also analyzed. The correlatios were not
significant with the initial BCVA but there were strongly correlated with the
final BCVA, difference of BCVAs and DRIL score.
Table 4 The correlations between the possible prognostic factors and BCVA
measurements
|
Parameters |
Initial BCVA |
Final BCVA |
The difference of BCVAs |
|
Age |
-0.078 |
0.063 |
-0.126 |
|
Referance time |
0.124 |
0.522b |
|
|
FT, first |
0.005 |
0.333 |
-0.351 |
|
NPaT, first |
0.90 |
|
-0.489b |
|
TPaT, first |
-0.53 |
|
|
|
NPeT, first |
0.96 |
-0.525b |
-0.488b |
|
TPeT, first |
0.006 |
0.104 |
-0.106 |
|
FT, last |
0.172 |
|
0.542b |
|
NPaT, last |
0.047 |
-0.564b |
0.637b |
|
TPaT, last |
0.04 |
-0.614b |
0.684b |
|
NPeT, last |
0.022 |
-0.67b |
0.698b |
|
TPeT, last |
0.56 |
-0.599b |
0.68b |
|
DRIL score |
0.101 |
0.787b |
-0.763b |
BCVA: Best corrected visual acuity; FT: Foveal thickness; NPaT: Nasal
parafoveal thickness; TPaT: Temporal parafoveal thickness; NPeT: Nasal
perifoveal thickness; TPeT: Temporal perifoveal Thickness; DRIL:
Disorganization of retinal inner layers. aThe correlation
is significant at the level of 0.05; bThe correlation
is significant at the level of 0.01.
The DRIL score was highly correlated with most of the other prognostic
factors except age, the first TPeT and the last FT (Table 5). The comparison of
DRIL-A and DRIL-B groups according to the visual function and other prognostic
factors is presented in the Table 6. DRIL-A and DRIL-B groups were
significantly different from each other for most of the parameters, but there
were not significantly difference between these 2 groups according to the age,
initial BCVA, first TPeT and last FT.
Table 5 The relations of DRIL score with other prognostic factors
|
PFs |
Age |
RT |
FT, first |
NPaT, first |
TPaT, first |
NPeT, first |
TPeT, first |
FT, last |
NPaT, last |
TPaT, last |
NPeT, last |
TPeT, last |
|
DRIL Score |
0.259 |
0.482b |
|
0.586b |
0.549b |
0.697b |
0.299 |
-0.274 |
-0.630b |
-0.542b |
-0.705b |
-0.555b |
DRIL: Disorganization of retinal inner layers; PFs: Prognostic factors; RT:
Reference time; FT: Foveal thickness; NPaT: Nasal parafoveal thickness; TPaT:
Temporal parafoveal thickness; NPeT: Nasal perifoveal thickness; TPeT: Temporal
perifoveal Thickness. aThe correlation
is significant at the level of 0.05; bThe correlation is significant at the level of 0.01.
Table 6 The comparison of DRIL-A and DRIL-B groups according to the BCVA
measurements and other possible prognostic factors
|
Parameters |
DRIL-A |
DRIL-B |
Pa |
|
Age |
60 (10.7) |
65 (15.1) |
>0.05 |
|
Reference Time |
17.4 (4) |
24.6 (8.2) |
<0.05 |
|
Initial BCVA |
2.45 (1.02) |
2.73 (0.53) |
>0.05 |
|
Final BCVA |
0.65 (0.51) |
2.37 (0.68) |
<0.01 |
|
The difference of BCVA |
1.80 (0.87) |
0.41 (0.64) |
<0.01 |
|
FT, first |
195.4 (96.6) |
339.4 (163.5) |
<0.01 |
|
NPaT, first |
339 (62.7) |
481.6 (133) |
<0.01 |
|
TPaT, first |
312.7 (45.3) |
439.8 (125.3) |
<0.01 |
|
NPeT, first |
361.8 (41.1) |
477.1 (88.6) |
<0.01 |
|
TPeT, first |
360.5 (41.4) |
407.4 (114.3) |
>0.05 |
|
FT, last |
215.5 (91.5) |
171 (32.2) |
>0.05 |
|
NPaT, last |
249.8 (51.7) |
195.2 (25.3) |
<0.01 |
|
TPaT, last |
253.2 (77.7) |
185 (14.8) |
<0.01 |
|
NPeT, last |
268.7 (53.9) |
200.2 (23.3) |
<0.01 |
|
TPeT, last |
250.6 (78.7) |
179.8 (15.9) |
<0.01 |
DRIL: Disorganization of retinal inner layers; BCVA: Best corrected visual
acuity; RT: Reference time; FT: Foveal thickness; NPaT: Nasal parafoveal
thickness; TPaT: Temporal parafoveal thickness; NPeT: Nasal perifoveal
thickness; TPeT: Temporal perifoveal thickness. aMann-Whitney U
test or t-test according to the normality test results.
DISCUSSION
CRAO is an analogue of cerebrovascular accident for the eye and it is an
ocular emergency. CRAO can cause legal bilindness if it is not treated or the
treatment is not enough (Figure 2).
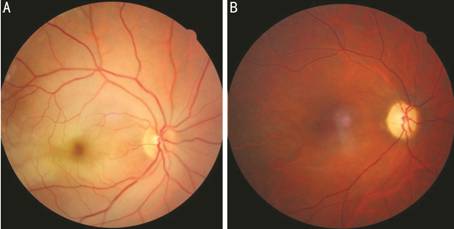
Figure 2 Fundus appearances of a CRAO patient A: First day
fundus photo of a CRAO patient; B:
Same patient’s fundus photo after 2mo. Arterial thinning developed, foveal light
refleks disappeared and optic disc seems pale. This patient’s right eye’s VA is
counting fingers.
In this study, analyses were performed with the aim of determining
prognostic factors in CRAO patients. By this date, there is no doubt that the
most important study according to the visual prognosis is Hayreh and Zimmerman[1]’s prospective study in 2005. In that study CRAO was
divided into 4 groups: non-arteritic permanent CRAO, non-arteritic transient
CRAO, non-arteritic CRAO with cilioretinal artery sparing, and arteritic CRAO.
Hayreh and Zimmerman[1] had emphasized that the
most important prognostic factor for determining the visual prognosis is the
type of the disease. In their study, 82% of the transient CRAO patients had VA
improvement while this ratio was 67% for CRAO with cilioretinal artery sparing,
22% for non-arteritic permanent CRAO. In our study we did not categorize our
patients like Hayreh did and searched for other prognostic factors independently.
The age, RT, MT (at first and last exam, from 5 seperate points), MTC and
DRIL score were analyzed as prognostic factors. The correlations between these
prognostic factors and visual function were investigated.
In this study we saw that age is not related to visual prognosis. But there
was a positive correlation between the RT and final BCVA (Pearson’s correlation
test, r=0.522) and a negative correlation with the difference of BCVAs
(Pearson’s correlation test, r=-0.464). The study published in 2004,
showed that the retina is irreversibly damaged by acute ischaemia of 4 hours
after total occlusion[7]. In practice not every
CRAO is totally occluded. That means shorter RT, better VA. This result
was similar to studies of Cope et al[8] and Beiran et al[9]. If we had put some limitations to RT (like maximum
12h) or while we made the statistics, if we had grouped the subjects according to
the RT, we would have some much significant findings. However, such a grouping
is not preferred because it reduces the number of cases.
Ahn et al[10], who studied that
whether MT is a prognostic factor, expressed that final central MT is
correlated with severe vision loss. Chen et al[2]
analyzed the relation between MTC and visual functions, and they expressed that
MTC is very important about visual prognosis. We also found out in our study
that MT and visual functions have a close relationship, especially the
correlations between visual functions with nasal MTs were statistically more
significant than with temporal MTs. Generally, if a subject’s first MT is
thick, last MT is thin and the difference of MTs is high, it seems unlikely to
improve that patients vision. Of course the duration of the retinal artery
occlusion and the sensitivity to treatments is also very important in these
cases.
The other parameter that we invastigated as a prognostic factor was DRIL.
There were no data about DRIL in retinal arterial oclusions until today. DRIL
was first evaluated in terms of visual prognosis in retinal vein occlusions
following diabetic patients and was found to be prognostically significant[3-5,11-14].
In Nicholson et al’s[5] study, DRIL showed
85% sensitivity and 100% specificity in capillary non-perfusion detection.
Grewal et al[15] studied DRIL in patients
with uveitic macular edema and found out that DRIL is a easily obtained marker
of VA for current or resolved uveitic macular edema patients. DRIL scoring has
been found to be very important for predicting visual prognosis in patients
with idiopathic epiretinal membrane[16]. Guo et
al[17] investigated structural changes
associated with VA in patients with idiopathic macular telangiectasia type 1
using multimodal imaging modalities and found that DRIL may be an important
biomarker of predicting VA. An OCT angiography study published in 2018 by
Onishy et al[18] showed DRIL is associated
with multilevel retinal capillary non-perfusion. Another study with OCT
angiography also concluded with the same results[19].
The pathogenesis of macular swelling in diabetic, uveitic, retinal venous
occlusion and idiopathic epiretinal membrane patients is very different than
CRAO patients but DRIL’s pathogenesis is the same; capillary non-perfusion and
ischemia. It is inevitable that the DRIL which is caused by capillary
non-perfusion could be also caused by retinal arterial occlusions. High DRIL
scores could be predicted when especially with prolonged elapsed time after the
onset of the symptoms. As predicted the DRIL score increased as the RT
increased (Pearson’s correlation test, r=0.482). We found out that DRIL
score has a positive correlation with the final BCVA (Pearson’s correlation
test, r=0.787) and a negative correlation with the difference of BCVAs
in CRAO patients (Pearson’s correlation test, r= -0.763). When we
investigated the relations of DRIL with other prognostic factors we saw that
DRIL has close relationship with RT, MT and MTC. There was a positive
correlations between DRIL score and first MTs and a negative correlation with
last MTs.
In our study, after all patients’ DRIL scores were determined, according to
the DRIL score we evaluated patients in 2 separate groups (DRIL-A and DRIL-B).
The patients in the DRIL-A (DRIL score 0-3) group had shorter RT (t-test,
P<0.05), thinner first MTs (Mann-Whitney U
test, P<0.01,except first TPeT), and thicker last MTs (Mann-Whitney U
test, P<0.01, except last FT). As we expressed before, short RT, thin
first MT, and thick last MT refers to good prognosis. As a result DRIL-A group
had better prognosis with better final BCVA and higher difference of BCVAs
compared to DRIL-B group.
We didn’t have any control group for the treatment algorythm to understand
the role of HBOT for CRAO, but in the lights of previus studies, HBOT seems to
be a good choise for treatment if the right conditions are provided[8-9,20]. DRIL score
was also correlated negatively with HBOT sessions count (Pearson’s correlation
test, r=-0.341). We think the reason for this was the treatment respond
was better for the patients with low DRIL scores, so the increasing VA
functions caused the increasing HBOT sessions, so DRIL can be a good guidance
for treatment.
Like diabetic rethinopathy, retinal vein occlusions and uveitic macular
edema, the DRIL for CRAO patients in the acute phase, could be valuable in terms
of visual prognosis, but further studies with larger samples and subgroups are
needed to validate this observation.
ACKNOWLEDGEMENTS
Conflicts of
Interest: Yilmaz H, None; Durukan AH, None.
REFERENCES