
Citation: Li MX, Yu
SQ, Zhang W, Zhou H, Xu X, Qian TW, Wan YJ. Segmentation of retinal fluid based
on deep learning: application of three-dimensional fully convolutional neural
networks in optical coherence tomography images. Int J Ophthalmol
2019;12(6):1012-1020
DOI:10.18240/ijo.2019.06.22
・Investigation・
Segmentation
of retinal fluid based on deep learning: application of three-dimensional fully
convolutional neural networks in optical coherence tomography images
Meng-Xiao Li1, Su-Qin Yu2, Wei
Zhang1, Hao Zhou2, Xun Xu2, Tian-Wei Qian2,
Yong-Jing Wan1
1School of
Information Science and Engineering, East China University of Science and
Technology, Shanghai 200237, China
2Department
of Ophthalmology, Shanghai General Hospital, Shanghai Jiaotong University
School of Medicine; Shanghai Key Laboratory of Ocular Fundus Diseases, Shanghai
200080, China
Co-first
authors: Meng-Xiao
Li and Su-Qin Yu
Correspondence
to: Tian-Wei
Qian. Department of Ophthalmology, Shanghai General Hospital, Shanghai Jiaotong
University School of Medicine; Shanghai Key Laboratory of Ocular Fundus
Diseases; Shanghai 200080, China. qtw6180@126.com; Yong-Jing Wan. School of
Information Science and Engineering, East China University of Science and
Technology; Shanghai 200237, China. wanyongjing@ecust.edu.cn
Received:
Abstract
AIM: To explore a segmentation algorithm based on deep learning to achieve
accurate diagnosis and treatment of patients with retinal fluid.
METHODS: A two-dimensional (2D) fully convolutional network
for retinal segmentation was employed. In order to solve the category imbalance
in retinal optical coherence tomography (OCT) images, the network parameters
and loss function based on the 2D fully convolutional network were modified.
For this network, the correlations of corresponding positions among adjacent
images in space are ignored. Thus, we proposed a three-dimensional (3D) fully
convolutional network for segmentation in the retinal OCT images.
RESULTS: The algorithm was evaluated according to
segmentation accuracy, Kappa coefficient, and F1 score. For the 3D
fully convolutional network proposed in this paper, the overall segmentation
accuracy rate is 99.56%, Kappa coefficient is 98.47%, and F1 score
of retinal fluid is 95.50%.
CONCLUSION: The OCT image segmentation algorithm based on deep learning is primarily
founded on the 2D convolutional network. The 3D network architecture proposed in this paper reduces the
influence of category imbalance, realizes end-to-end segmentation of volume images,
and achieves optimal segmentation results. The segmentation maps are
practically the same as the manual annotations of doctors, and can provide
doctors with more accurate diagnostic data.
KEYWORDS: optical coherence tomography images;
fluid segmentation; 2D fully convolutional network; 3D fully convolutional
network
DOI:10.18240/ijo.2019.06.22
Citation: Li
MX, Yu SQ, Zhang W, Zhou H, Xu X, Qian TW, Wan YJ. Segmentation of retinal
fluid based on deep learning: application of three-dimensional fully convolutional
neural networks in optical coherence tomography images. Int J Ophthalmol
2019;12(6):1012-1020
INTRODUCTION
Retinal
fluid, including sub-retinal fluid (SRF) and intra-retinal fluid (IRF), is a
considerably common retinal ailment secondary to numerous diseases, which may
cause severe vision loss. Therefore, a rapid and an accurate comprehensive view
of retinal fluid may be of considerable significance in its diagnosis and
treatment. Optical coherence tomography (OCT) technology, as a rapidly emerging
type of medical imaging technology, offers various advantages and broad
application prospects. It uses light instead of ultrasound to generate images.
According to the backward ability or retroreflection of weakly coherent light,
the biological tissue of different retina depths produces a cross-sectional
image with high resolution and gray-light changes[1].
This is beneficial for clearly visualizing various retinal layers in order to
assess and quantify different pathological features of the retina
qualitatively.
Presently,
intelligent automation in the medical field is mainly used for research on the
segmentation of magnetic resonance images and enhancement of retinal blood
vessels. Imaging with the OCT is a new technology, and research on retinal OCT
images is still in its early stage. In the study of retinal segmentation,
semi-automatic methods were first used. For example, Kashani et al[2] employed OCTOR software (Doheny Eye Institute, Los
Angeles, USA) for manual labeling; by manually clicking on the location of the
fluid on each slice, Zheng et al[3]
obtained the fluid contour according to the algorithm. In order to reduce the
workload of doctors, numerous researchers have also proposed automatic methods,
such as segmentation methods based on the threshold and graph theories. The
threshold-based segmentation algorithm mainly uses the characteristics of OCT
images with evident gradient changes. Chen et al[4]
used the threshold-based segmentation to mark the retinal pigment epithelial
(RPE) layer and determine the candidate region. However, the threshold-based
segmentation algorithm requires high image quality; hence, it is not considerably
adaptable to datasets with large quality variance among different images. Chen et
al[5] proposed the use of the graph search
method for fluid segmentation. When macular holes and fluid coexist, the
laboratory first removes the hole position; thereafter, the fluid segment is
cut using the Adaboost classifier combined with a graph[6].
Slokom et al[7] and Fernandez[8] used active contours to outline fluid regions. These
traditional algorithms involve large amounts of mathematical calculations and a
continuous iterative optimization process. Consequently, these methods will
consume considerable amounts of time in actual testing that is not in line with
actual application scenario requirements. With the development of deep
learning, image features are automatically extracted by means of the
convolutional network. It is observed that its effect is far superior than that
of traditional algorithms.
In recent years,
in the medical imaging field, deep learning methods have also been developed
and continually applied. Long et al[9]
first proposed a fully convolutional network (FCN) for semantic segmentation,
which achieved end-to-end image segmentation; it made pioneering progress in
the application of deep learning in image segmentation. As a result, the
algorithm quickly gained attention. The FCN has been applied to the
segmentation of retinal fluid, and the conditional random field was used to
fine-tune segmentation results[10]. Subsequently,
Ronneberger et al[11] and Badrinarayanan et
al[12] proposed the U-Net and SegNet
architectures, respectively, based on the FCN. The studies[13-16] applied U-Net to the segmentation of OCT images. It
has also been employed in the segmentation of drusen lesions[13],
and the effects of different image annotations on segmentation results have
been compared. Moreover, it is reported that U-Net was applied to divide the
IRF[14], employed to segment the retina layers
and fluid[15], and modified the loss function. In
another study[16], two-stage FCNs were proposed
based on U-Net. The first FCN was used to extract the retinal area, and the
second FCN was used for fluid segmentation combined with the retinal
information extracted in the previous stage. Although the retinal segmentation
information can be used to correct fluid segmentation, the network requires
separate training at each stage. If retinal segmentation is wrong in the first
stage because of large image noise, then the subsequent impact is extremely
serious.
The
development of deep networks has greatly improved the accuracy of image
segmentation. However, based on the review of a substantial amount of literature,
it was found that the networks used in each article differed; nevertheless, the
reason for the selection of a specific network is not indicated. To resolve
this problem, the effects of FCN, SegNet, and U-Net on retinal fluid
segmentation are compared, and the appropriate network architecture is
determined according to the results. In order to solve the category imbalance
problem in retinal OCT images, the network parameters and loss function are
modified based on the selected network. Considering that the OCT images are
volume data, trend change information exists among adjacent images, and the
two-dimensional (2D) fully convolutional network ignores the spatial
information. Furthermore, if the network is trained in stages, then it is more
difficult to utilize information. In order to solve this problem, the
application of three-dimensional (3D) CNN in video segmentation[17] is exploited. Therefore, we propose the construction
of a 3D network structure for flexibly exploring the spatial association
information to achieve improved segmentation results. Our research indicates
that this present study is the first to utilize the 3D network architecture in
the segmentation of retinal OCT images.
SUBJECTS AND METHODS
Ethical
Approval The images used in the research were
provided by Shanghai General Hospital. It was approved by the Medical Ethics
Committee of Shanghai General Hospital Medical Science and was conducted in
accordance with the tenets of the Declaration of Helsinki. Informed consent was
obtained from all participants in this study. The labels for the experimental
training data were annotated by the hospital’s professional ophthalmologists.
Description
of Project Objectives The overall process of the algorithm
research presented in this paper is illustrated in Figure 1. It includes two
stages: neural network training and testing.
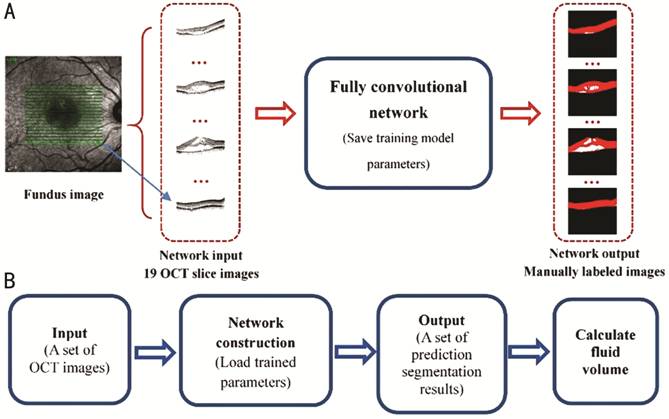
Figure 1
Overall flowchart of algorithm A: Training phase flowchart; B: Test
phase flowchart.
The training
process is depicted in Figure
Retinal
Fluid Segmentation Based on Improved 2D U-Net Improved 2D U-Net After Long et al[9] proposed the FCN, the image segmentation problem at the
semantic level was solved, and an end-to-end pixel-to-pixel image segmentation
was initially implemented. Since then, researchers have proposed various
FCN-based network architectures to achieve more accurate segmentation effects.
U-Net for biomedical image segmentation was proposed[11].
In this study, in order to solve the category imbalance problem in retinal OCT
images, an improved U-Net framework is proposed, which is illustrated in Figure
2. Each colored block in the figure represents the operation performed on the
image. The number above the colored blocks indicates the number of convolution
kernels in the current layer, whereas the number on the side indicates the size
of the current layer output.
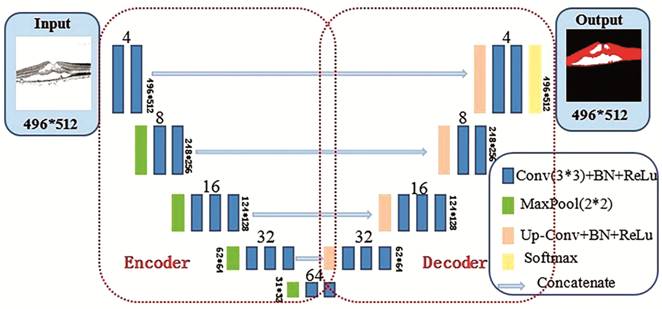
Figure 2
Improved 2D U-Net architecture diagram.
Network
structure layers Throughout the development of
convolutional neural networks, it is evident that most of the proposed networks
have been based on the modification of classic network architectures, such as
AlexNet[18], VGG-Net[19],
and GoogLeNet[20]. The VGG-Net architecture
proves that the convolutional layer of a small convolution kernel (with no
pooling in the middle) is the same as the receptive field of a large
convolution kernel; for example, two 3×3 convolutional layers have the same
receptive field as a 5×5 convolutional layers. Moreover, it makes the decision
function more discriminative; thus, the number of parameters can be
significantly reduced. This method lays a theoretical foundation for the
current network frame convolution kernel-size setting. Therefore, the basic
modules of the three networks implemented in this study were constructed using
the VGG-Net framework.
Furthermore,
because the deep neural network training process is prone to overfitting, the
U-Net convolution block originally proposed in only uses the convolution
(Conv)+ReLu operation and does not consider the overfitting phenomenon[11]. Through the continuous innovations introduced by
research scholars, it has been proposed that the aforementioned problem be
solved by data augmentation or changing the network structure, such as
increasing the regular term, dropout layer[21],
or batch normalization (BN) layer[22]. The BN
layer can improve the network gradient, considerably improve the training
speed, and cause the training result to converge rapidly. Moreover, the
addition of the BN layer can enable the network to reduce the use of the
dropout layer and regular term as well as improve the network generalization
ability. Therefore, each convolution block presented in this paper uses a
combination of Conv+BN+ReLu.
Loss
function An experimental comparison
demonstrates that the weighted loss function can make the seven-layer retinal
boundary segmentation more accurate and compensate for the imbalance between
the background and other categories[15]. In order
to achieve the research objectives of this study, it is not necessary to
stratify the retina; however, serious imbalances exist between the background,
ILM-RPE layer, and fluid. The background pixels have the greatest influence and
major contribution to the loss, such as leading the direction of the gradient
update and masking important information.
Most pixels are simple and easy
to divide; however, the characteristic information of pixels that are difficult
to classify (such as edge pixels) cannot be fully learned. Therefore, the
easy-to-classify pixels have a major contribution to the loss and dominate the
gradient update direction. In order to solve this problem, the focal loss is
proposed by Lin et al[23] that involves
solving the problem of unbalanced distribution in the target detection.
Combining the ideas of previous two studies[15,23], we propose an improved loss function, which is more
suitable for network training of data sets in this paper.
Retinal Fluid Segmentation Based
on Improved 3D U-Net Because the 2D FCNs can only consider
the neighborhood correlation of the image itself, the correlation of the
spatial positions among images is ignored, and the OCT images consist of volume
data with strong correlations among adjacent images. In actual cases, when the
fluid in a single OCT image cannot be accurately determined, it is necessary
for the ophthalmologist to combine the features of adjacent OCT images in order
to perform segmentation annotation. Therefore, to consider the correlations
among adjacent images, we propose the use of improved 3D U-Net, which is
illustrated in Figure 3.
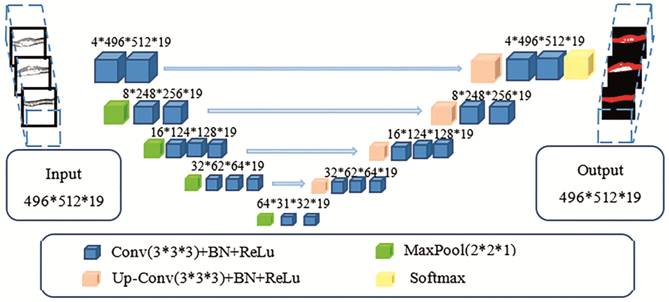
Figure 3
Improved 3D U-Net architecture.
As illustrated in Figure 3, the
entire network architecture is similar to that depicted in Figure 2, except
that the input and output are changed from a 2D image to a volume image, and
all convolution kernels in the network also become 3D structures. The numbers
in the figure indicate the output shape of the current layer. For example, the
input size is 496×512×19, that is, 19 OCT scans of B-scan size 496×512. The
size 4×496×512×19 indicates that the number of convolution kernels is four, and
the feature map shape following convolution is 496×512×19.
In the experiment, a convolution
kernel size of 3×3×3 is used in the convolutional layer; this means that the
single image is internally 3×3 convoluted, and spatial convolution is performed
directly on three adjacent images. Moreover, the zero-padding operation is
used. The ReLu activation function continues to be used in the hidden layer for
nonlinear transformation. Finally, for multi-classification probability
prediction, the softmax function is selected by the output layer activation
function. Furthermore, in order to reduce overfitting, the BN layer is used in
each coding or decoding block.
The pooling layer adopts maximum
pooling; its convolution kernel size is 2×2×1. This means that 2×2 maximum
pooling is used in the single image, and the pooling operation is not performed
between adjacent images in the space, which can consider additional
neighborhood relationships among images.
RESULTS
Dataset Dataset size: There were 75 OCT volumes from 42 patients;
each volume has 19 OCT scans of B-scan size 496×512 (a total of 1425 B-scans).
The ratio of training set (%) to test set (%) is 70:30. The training set has 53
OCT volumes (1007 B-scans) from 31 patients. The test set has 22 OCT volumes
(418 B-scans) from 20 patients.
Because the training dataset is
limited, and fluid distribution is not balanced, a data augmentation strategy
is applied to expand the training dataset for small samples to improve the
robustness of the network. The following data augmentations are randomly
applied to small samples for training: 1) Randomly rotated between 0 and 15°;
2) Randomly shifted horizontally within 20% of the image width; 3) Randomly
shifted vertically within 20% of the image height; 4) Randomly sheared between
0 and 0.2 scale; 5) Randomly flipped.
Eventually, the training set was
extended to 153 OCT volumes (2907 B-scans).
Experimental platform: The
experiment was run on a workstation with CPU Intel Core i7-7700K@4.20Hz
quad-core, 64-GB memory, 1024-GB disk, and two GPUs Nvidia GeForce GTX 1080
(each 8 GB). The experimental environment is the Ubuntu system.
Result
Evaluation Metrics The network performance of the
results of training and test datasets is evaluated. For the training dataset,
the segmentation effect and network convergence are observed according to the
accuracy rate of the dataset and loss trend during the training process. For
the test dataset, the segmentation accuracy, F1 score, and Kappa
coefficient are computed according to the prediction results of this dataset in
order to analyze the network generalization ability. The definitions of each
evaluation metric are as follows: 1) Accuracy: This reflects the network
ability to determine the entire dataset. The overall accuracy and the accuracy
of each class are analyzed. 2) F1 score[24]:
The harmonic mean of precision and recall, also known as the Dice coefficient[25]. 3) Kappa coefficient[26]:
Kappa is a statistic that measures inter-rater agreement for qualitative
(categorical) items. It is generally assumed to be a more robust measure than a
simple percentage agreement calculation because it considers the possibility of
the agreement occurring by chance.
Comparison and Analysis
Comparison results between 2D FCN
(FCN8/FCN16), SegNet, and U-Net Figure 4 illustrates the accuracy and loss curves for the
training dataset of all 2D convolutional networks. The abscissa is the number
of iterations, which is recorded when the entire dataset is trained once. The
ordinate is the accuracy (or loss). It should be noted that the four networks
in the figure do not have a BN layer, and the result is obtained from the
network trained with the cross entropy as a loss function. In Figure

Figure 4 2D
FCN training results A: Training accuracy curve; B:
Training loss curve.
In order to
prove that U-Net provides superior generalization ability, each network is
evaluated on the test dataset; Tables 1 and 2 summarize the test results. The
list in Table 1 indicates the scores of the evaluation metrics of the overall
classes of each network on the test dataset. It can be observed that the ACCoverall
and kappa values between FCN8, FCN16, and SegNet exhibit slight differences;
U-Net is observed to be significantly superior to these other networks. The
list in Table 2 provides the scores of each class of the evaluation metrics on
the test dataset; U-Net also achieves the best results in all metrics in each
class. Accordingly, based on the above results, U-Net is finally selected.
Table 1 Results of evaluation
metrics of all classes in test set
|
Metrics |
FCN8 |
FCN16 |
SegNet |
U-Net |
|
ACCoverall |
0.9854 |
0.9828 |
0.9856 |
0.9908 |
|
Kappa |
0.9507 |
0.9411 |
0.9515 |
0.9692 |
Table 2 Results of evaluation
metrics of each class in test set
|
Metrics |
Labelsa |
FCN8 |
FCN16 |
SegNet |
U-Net |
|
ACC |
0 |
0.9891 |
0.9863 |
0.9891 |
0.9934 |
|
1 |
0.9858 |
0.9833 |
0.9858 |
0.9910 |
|
|
2 |
0.9959 |
0.9960 |
0.9962 |
0.9973 |
|
|
F1 score |
0 |
0.9934 |
0.9917 |
0.9934 |
0.9960 |
|
1 |
0.9578 |
0.9492 |
0.9581 |
0.9731 |
|
|
2 |
0.7903 |
0.8074 |
0.8135 |
0.8785 |
aLabel 0 indicates background, label 1 indicates ILM-RPE
layer, and label 2 indicates fluid area.
Comparison Results between
Improved 3D U-Net, Improved 2D U-Net, and 2D U-Net Table 3 summarizes the scores of the overall evaluation
metrics of the three networks on the test dataset. According to the list,
improved 3D U-Net achieves superior results for all metrics; this indicates
that the proposed 3D U-Net exhibits the highest segmentation accuracy. Table 4
lists the evaluation scores of each class of the three networks on the test
dataset. Because our focus is on the retinal fluid, it can be observed in the
list that the proposed 3D U-Net achieves the best performance in all metrics
for the retinal fluid segmentation (label 2).
Table 3
Scores of evaluation metrics in test set
|
Metrics |
2D U-Net |
Improved 2D U-Net |
Improved 3D U-Net |
|
ACCoverall |
0.9908 |
0.9917 |
0.9956 |
|
Kappa |
0.9692 |
0.9725 |
0.9847 |
Table 4 Scores of evaluation
metrics of each class in test set
|
Metrics |
Labelsa |
2D U-Net |
Improved 2D U-Net |
Improved 3D U-Net |
|
ACC |
0 |
0.9934 |
0.9938 |
0.9970 |
|
1 |
0.9910 |
0.9918 |
0.9956 |
|
|
2 |
0.9973 |
0.9980 |
0.9986 |
|
|
F1 score |
0 |
0.9960 |
0.9962 |
0.9982 |
|
1 |
0.9731 |
0.9758 |
0.9860 |
|
|
2 |
0.8785 |
0.9109 |
0.9550 |
aLabel 0 indicates background, label 1 indicates ILM-RPE
layer, and label 2 indicates fluid area.
In order to
understand the segmentation effect intuitively, the segmentation results are
used as example. Figure 5 displays the results of a set of OCT images with the
IRF. Figure
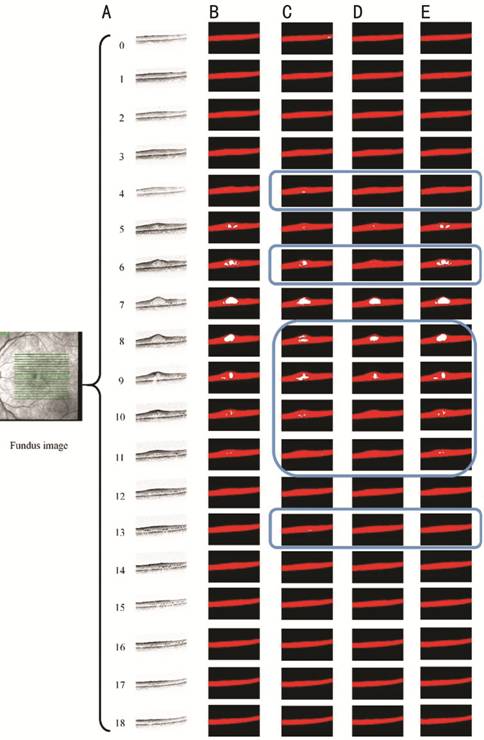
Figure 5
Segmentation results of OCT images with IRF A: 19 OCT images; B: Manually
labelled annotations of ophthalmologists; C: Results of original 2D U-Net; D:
Results of the improved 2D U-Net; E: Results of the improved 3D U-Net.
Figure 6
illustrates the segmentation results of a set of OCT images containing the SRF.
It can be intuitively observed that the overall segmentation results of the
proposed 3D U-Net are practically the same as the manually labeled results. As
can be observed from the images enclosed in blue, the segmentation results of
2D U-Net and improved 2D U-Net are evidently misclassified.
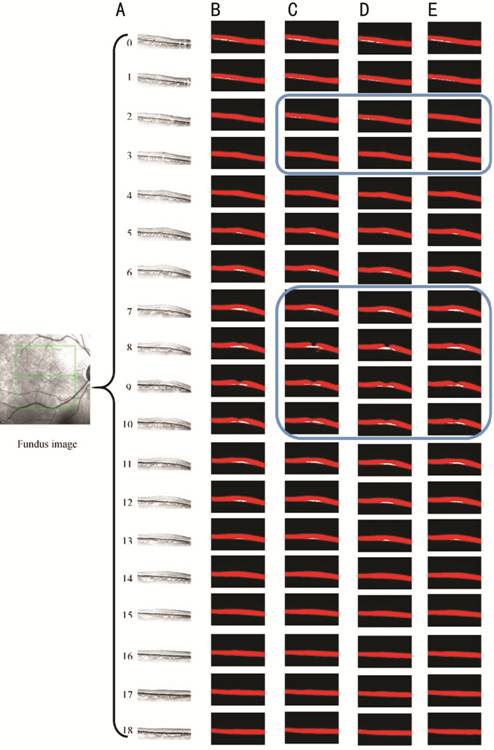
Figure 6
Segmentation results of OCT images with SRF A: 19 OCT images; B: Manually labelled
annotations of ophthalmologists; C: Results of original 2D U-Net; D: Results of
improved 2D U-Net; E: Results of improved 3D U-Net.
Overall
Process Framework In order to provide doctors with an
improved visual experience, the OCT images of patients are integrated into the
original fundus map to illustrate the fluid contour; accordingly, the doctor
can view the fluid shape more intuitively. The overall framework of this study
based on the proposed 3D U-Net above is illustrated in Figure 7.

Figure 7
Overall process structure.
DISCUSSION
OCT images have high resolutions,
and they distinctly display retinal tissue layers. When retinal fluid is
present, the retina shape changes. Accordingly, the analysis of retinal fluid
based on OCT images has become one of the most popular methods for clinical
diagnosis. However, the OCT technique acquires numerous scanned slice images,
and the retinal fluid shape and amount are uncertain. Moreover, it is
time-consuming and cumbersome to analyze these images only by visual
observation and perform manual segmentation. In order to realize intelligent
medicine, deep learning algorithms have been continuously applied. In relation
to this, to facilitate the pixel-level segmentation of images, the fully
convolutional network[9] has been proposed;
accordingly, such a network has become a potential solution to problems
involving medical image segmentation[10,13-15].
In this study, the proposed 3D
U-Net framework, which is found to be superior to other methods of comparison,
achieves a 99.56% accuracy; the Kappa coefficient and F1 score of
retinal fluid achieved 98.47% and 95.50%, respectively. The segmentation
results of our proposed algorithm are considerably similar to the annotations
of professional doctors. All of the foregoing demonstrate that the proposed
algorithm has accurate segmentation ability; it is an effective and significant
guide in practical applications.
In this study, although the input
images are decentralized, they contain substantial amounts of speckle noise. In
fact, the noise characteristics are considerably different from the target
features; hence, whether noise improves or reduces performance is uncertain. To
remove speckle noise, different algorithms (such as non-local mean filtering[27] and algorithms based on sparsity de-noising[28]) will be tested, and the effect of noise on
segmentation results through experiments will be compared. The current training
dataset is relatively small, and the types of retinal fluid images are limited.
If the images contain several complicated diseases, then it is necessary to
improve the segmentation ability of the network. If significant amounts of data
can be collected in the future, the impact of this problem can be reduced.
Different types of retinal fluid can be classified such that the network can
distinguish the type of retinal fluid and calculate the corresponding volume;
as a result, this will make it possible to provide more detailed information to
the doctor. As for the problem that the medical images are relatively few,
adversarial networks may be a solution[29]. In
the future work, adversarial networks will be tested based on the framework
proposed in this paper. It is anticipated that the segmentation performance of
the network can be improved even in the case of fewer samples.
The novel method can demonstrate
retinal fluid and calculate the volume of them, which can help ophthalmologists
comprehensively grasp the extent of a patient’s macular edema. At present,
central retinal thickness (CRT) is usually used to evaluate the macular anatomy
in patients with fluid before and after treatment[30].
However, whereas CRT is a 2D index, the volume of fluid is 3D. As a result,
although CRT is somewhat useful in gauging the extent of retinal fluid, it has
limited utility in the overall assessment of the resolution of fluid. Under
these circumstances, OCT images have the potential to provide a more
comprehensive clinical picture of a patient’s macular edema. More specifically,
identification of the volume of IRF and SRF allows ophthalmologists to
intuitively and meaningfully analyze the extent of edema and its resolution over
time[31]. For many patients, it is difficult to
detect changes in the location and volume of edema without objective data.
Therefore, we believe it is necessary to use such data to gauge the regression
of edema, which will contribute to the adjustment of follow-up treatment
measures.
In this study, a segmentation
algorithm framework based on 3D neural networks is proposed; the framework is
aimed at resolving the problem of retinal fluid segmentation in retinal OCT
images. Compared with other methods, the proposed 3D U-Net network is more
aligned with the human working mode under real conditions. The network performs
fluid segmentation by combining the spatial temporal correlations among images;
thereby, more reasonable results are obtained. Moreover, the evaluation
coefficients demonstrate that the proposed 3D U-Net architecture exhibits
superior performance, and the fluid segmentation accuracy is higher. It is
illustrated that the shape, distribution and the volume calculation of the
retinal fluid can provide doctors with a more intuitive visual experience,
which is highly significant in monitoring disease development and drug efficacy
tracking.
ACKNOWLEDGEMENTS
Foundations: Supported by National Science Foundation of China
(No.81800878); Interdisciplinary Program of Shanghai Jiao Tong University
(No.YG2017QN24); Key Technological Research Projects of Songjiang District
(No.18sjkjgg24); Bethune Langmu Ophthalmological Research Fund for Young and
Middle-aged People (No.BJ-LM2018002J).
Conflicts of
Interest: Li MX,
None; Yu SQ, None; Zhang W, None; Zhou H, None; Xu X,
None; Qian TW, None; Wan YJ, None.
REFERENCES