
Citation: Zhang LW, Zhao H, Chen BH. Reactive oxygen species mediates a metabolic memory of high glucose stress signaling in bovine retinal pericytes. Int J Ophthalmol 2019;12(7):1067-1074
DOI:10.18240/ijo.2019.07.03
・Basic Research・
Reactive oxygen species mediates a metabolic memory of high glucose stress signaling in bovine retinal pericytes
Li-Wei Zhang1,2, Han Zhao1,2, Bai-Hua Chen1,2
1Department of Ophthalmology, the Second Xiangya Hospital, Central South University, Changsha 410011, Hunan Province, China
2Hunan Clinical Research Center of Ophthalmic Disease, Changsha 410011, Hunan Province, China
Co-first authors: Li-Wei Zhang and Han Zhao
Correspondence to: Bai-Hua Chen. Department of Ophthalmology, the Second Xiangya Hospital, Central South University, Changsha 410011, Hunan Province, China. chenbaihua2017@csu.edu.cn
Received:
Abstract
AIM: To investigate the role of reactive oxygen species (ROS) and antioxidant mechanism underlying the metabolic memory of bovine retinal pericytes (BRPs) induced by high glucose.
METHODS: Effects of high glucose levels and culture time on BRPs viability were evaluated by CCK-8. BRPs were grown in high-glucose media (30 mmol/L) for 4d followed by culture in normal glucose condition (5.6 mmol/L) for 4d in an experimental group. In contrast, in negative and positive control groups, BRPs were grown in either normal-glucose media or high-glucose media for 8d, respectively. The ROS levels, apoptosis, the expression and activity of manganese superoxide dismutase (MnSOD) in BRPs, as well as the protective effect of adeno-associated viral (AAV)-mediated over expression of MnSOD were determined separately by DCHFA, ELISA and Western blot.
RESULTS: Comparing the result of cells apoptosis, activity and protein expression of MnSOD and caspase-3, the cell culture system that exposed in sequence in 30 mmol/L and normal glucose for 4d was demonstrated as a suitable model of metabolic memory. Furthermore, delivery of antioxidant gene MnSOD can decrease BRPs apoptosis, reduce activated caspase-3, and reverse hyperglycemic memory by reducing the ROS of mitochondria.
CONCLUSION: Increased ROS levels and decreased MnSOD levels may play important roles in pericyte loss of diabetic retinopathy. BRPs cultured in high glucose for 4d followed by normal glucose for 4d could be an appropriate model of metabolic memory. rAAV-MnSOD gene therapy provides a promising strategy to inhibit this blinding disease.
KEYWORDS: diabetic retinopathy; metabolic memory; manganese superoxide dismutase; molecular therapeutics; reactive oxygen species
DOI:10.18240/ijo.2019.07.03
Citation: Zhang LW, Zhao H, Chen BH. Reactive oxygen species mediates a metabolic memory of high glucose stress signaling in bovine retinal pericytes. Int J Ophthalmol 2019;12(7):1067-1074
INTRODUCTION
Diabetic retinopathy (DR) is the common capillary complication caused by chronic hyperglycemia, and is the most important cause of vision loss and blindness in working-age adults[1]. Pericyte loss is thought to be the earliest pathological manifestation and the key factor of DR development[2]. Diabetic pericyte loss and hyperglycemia-induced apoptosis of retinal capillary endothelial cells lead to the formation of acellular capillary[3].
A large multi-center clinical trial demonstrated that early intensive glycemia control reduces microvascular injury, and the benefits persist for years[4, 5]. However, existing vascular injury caused by previous hyper-glycemic exposure was unable to be reversed by long-term intensive glucose control[6, 7]. The authors of the Diabetes Control and Complications Trial (DCCT) and Epidemiology of Diabetes Interventions and Complications (EDIC) study groups proposed a “metabolic memory” hypothesis to explain these findings[8, 9]. Therefore, the ideal therapeutic strategy to reduce the risk of diabetes capillary complications not only include the early aggressive glycemia control, but also together with reverse abnormal metabolism induced by prior hyperglycemia status.
Previous studies demonstrated that high glucose induced excessive reactive oxygen species (ROS) levels which mediated the retinal pericyte apoptosis[10, 11]. However, whether the roles of ROS during pericyte loss and metabolic memory after glucose normalization remains elusive. The mitochondrial antioxidant manganese superoxide dismutase (MnSOD) is a mitochondrial antioxidant enzyme, which catalzses superoxide anion radicals to hydrogen peroxides, and protect cells from ROS-mediated injury[12, 13]. Our previous study showed that[14], in streptozotocin (STZ)-induced diabetic rats, after maintaining at a high glucose level for 6mo, intensive glycemia control failed to ameliorate capillary cell apoptosis and acellular capillaries formation, as well as decreased activities of retinal MnSOD in vivo. Moreover, no reversion of MnSOD activities observed in mouse even after glucose normalization for another 6mo. This lead to the conclusion that as a primary ROS detoxifying enzymes, MnSOD could be a specific symbol to evaluate and predict the severity of metabolic memory. Moreover, it’s come up to a hypothesis that will MnSOD over-expression be effective against metabolic memory? Could it be a potential therapeutic strategy of hyperglycemia induced capillary injury? In the present study, we observed the changes of bovine retinal capillary pericytes (BRPs) activities under high glucose exposure in vitro and investigated the roles of ROS in pericytes injury. Then we utilized gene therapy to increase the expression of MnSOD in BRP in vitro, and evaluated their therapeutic efficiency on DR.
MATERIALS AND METHODS
Ethical Approval All protocols of the experiments were approved by the Institutional Animal Care and Use Committee of Central South University, China. The animal experiments are performed according to the ARVO Statement for the Use of Animals in Ophthalmic and Vision Research.
Isolation and Culture of Bovine
Retinal Pericytes Retinal pericytes were isolated from
bovine retinal microvesselsas previously described[15].
Briefly, fresh bovine retinas (2 retinae per culture dish) were dissected and
homogenized. The homogenate was resuspended in DMEM containing 0.2% collagenase
II. After digestion (60min at
Experimental Groups and Cell Viability Assessment The experimental groups were described in Table 1. BRPs were grown in indicated media for 8d. Each high-glucose condition is paired with according control condition of equivalent osmotic pressure, which uses media containing 5.6 mmol/L glucose and certain levels of mannitol (14.4, 19.4, and 24.4 mmol/L, respectively). In metabolic memory experimental groups, BRPs were first cultured in high-glucose medium (20, 25, and 30 mmol/L) for 2, 4, and 6d respectively, and then grown in 5.6 mmol/L glucose medium till the 8th day. Cell viability was assessed using cell counting kit-8 (Beyotime Biotechnology, Shanghai, China) on day 0, 2, 4, 6, and 8 for each group. The percentage were obtained by normalizing to the normal glucose control condition defined as being 100%.
Table 1 Culture groups
Groups |
Glucose concentration (mmol/L) |
Group name |
Group name in short |
Culture days |
|
Hyper-glycemia |
Normal (5.6 mmol/L) |
||||
Control |
20/25/30 |
Hyperglycemia control |
Hy CG |
8 |
- |
5.6 |
Normal control |
CG |
- |
8 |
|
Metabolic memory |
20 |
Hyperglycemia 1 |
20 Hy-1 |
2 |
6 |
Hyperglycemia 2 |
20 Hy-2 |
4 |
4 |
||
Hyperglycemia 3 |
20 Hy-3 |
6 |
2 |
||
25 |
Hyperglycemia 1 |
25 Hy-1 |
2 |
6 |
|
Hyperglycemia 2 |
25 Hy-2 |
4 |
4 |
||
Hyperglycemia 3 |
25 Hy-3 |
6 |
2 |
||
30 |
Hyperglycemia 1 |
30 Hy-1 |
2 |
6 |
|
Hyperglycemia 2 |
30 Hy-2 |
4 |
4 |
||
Hyperglycemia 3 |
30 Hy-3 |
6 |
2 |
||
Gene therapy |
30 |
AAV-GFP Control |
AAV-GFP |
4 |
4 |
AAV-MnSOD |
AAV-MnSOD |
4 |
4 |
||
Hy: Hyperglycemia; AAV-GFP: Adeno-associated viral vector linked to green fluorescent protein; AAV-MnSOD: Adeno-associated viral vector linked to manganese superoxide dismutase.
Detection of Apoptosis in Cultured Pericytes by ELISA BRPs were washed and lysed by cell lysis solution. Supernatant after centrifugation was obtained and mixed with anti-histone-biotin and anti-DNA-POD (Cell Death Detection kit; Roche Biotechnology, Mannheim, Germany) in streptavidin-coated culture plate for 2h. Apoptosis values were calculated using the microplate reader with extinction coefficient at 450 nm. Total DNA was extracted from BRPs mixed with Hoechst 33258 (Beyotime Biotechnology, Shanghai, China), detected by microplate reader with extinction coefficient at 352 nm and emission coefficient at 461 nm. Apoptosis/Unit=Apoptosis value/Total DNA.
Detection of MnSOD and Caspase-3 by Western Blot Analysis Trypsinized cells were lysed with mammalian protein extraction reagent (M-PER, from Thermo Scientific, Rockford, IL, USA) containing a protease inhibitor cocktail (1:100; Sigma, St. Louis, MO, USA). Protein concentration was determined using the BCA protein assay kit with bull serum albumin as the standard (Beyotime Biotechnology, Mannheim, Germany). Pericyte proteins were resolved by SDS-PAGE, and Western blotting was carried out with 10 μg cell lysate protein, using one of the following antibodies: MnSODmAb (1:500 dilution), caspase-3 (1:1000 dilution; Cell Signaling Technologies, Danvers, MA, USA). Secondary antibodies were HRP-conjugated goat anti-rabbit antibody (1:2000 dilution). Western blots were developed using an enhanced chemiluminescence detection kit (Thermo Scientific, Waltham, MA, USA). The membrane was re-probed for the loading control with an antibody for β-actin (1:1000 dilution, Sigma, St. Louis, MO, USA).
Reverse Transcription-Polymerase
Chain Reaction Analysis of MnSOD mRNA RNA was
extracted from cells using the RNeasy mini kit and reverse transcription-polymerase
chain reaction (RT-PCR) was carried out using the one step RT-PCR Kit
(Applied Biosystems). The following forward and reverse primers were used:
MnSOD forward
Detection of MnSOD Activity in Bovine Retinal Pericytes The activity of MnSOD was measured under instructions using the kits from Cayman Chemical (AnnArbor, MI, USA). The method used for MnSOD detection was to quantify O2- generated by xanthine oxidase and hypoxanthine. MnSOD activity was determined by performing the assay in the presence of potassium cyanide to inhibit Cu-ZnSOD, thus measuring the residual MnSOD activity.
Adeno-associated Virus Recombinant MnSOD Preparation and Transfection The adeno-associated virus recombinant MnSOD (rAAV-MnSOD) was a gift from Dr. Alfred S. Lewin, Department of Ophthalmology, University of Florida, USA. The preparation was previously described in our study[14]. Briefly, recombinant AAV vector backbone pTR-UF11 was used to accept the MnSOD cDNA. Gene expression was driven by hybrid cytomegalovirus and chicken β-actin proximal promoter. The resultant pTR-MnSOD plasmids were amplified, then purified and packaged as an AAV serotype 2 vector. Each virus preparation contained approximately 10 genome copies/mL[12]. The resultant AAV packaged with humanized green fluorescent protein (GFP) was established as control.
Detection of Reactive Oxygen Species in Bovine Retinal Pericytes To measure cellular ROS, pericytes were loaded with CM. H2DCFDA and MitoTracker probes (Invitrogen, Eugene, Oregon, USA) separately. ROS and mitochondria were observed by fluorescence microscope, use 488 nm and 543 nm laser for irradiation. Three views were randomly chosen, the average fluorescence intensity was analyzed by Leica Qwin V3 software.
Statistical Analysis Statistical analysis was carried out using commercially available GraphPad Prism software (GraphPad Software, Inc., La Jolla, CA, USA). All results are expressed as mean±SEM, and compared by means of one-way ANOVA between several groups or t-test between two independent samples. Differences were considered statistically significant at P<0.05.
RESULTS
BRPs were grown in media containing different concentrations of glucose for 8d. The experimental groups were described in Table 1. After culture in high glucose for 2d, pericytes already showed signs of cell damage (Figure 1). As shown in Figure 1, high glucose decreased pericyte viability in a dose-dependent and time-dependent manner.
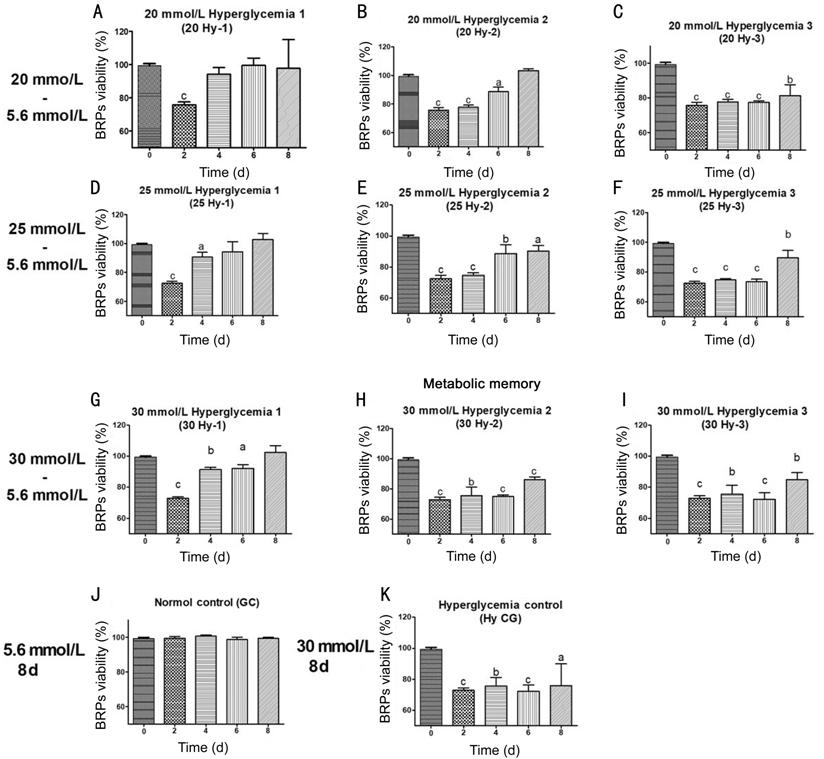
Figure 1 Effect of high glucose levels and culture time on BRPs viability A, D, G: BRPs were incubated in high glucose (20/25/30 mmol/L) for 2d followed by normal glucose (5.6 mmol/L) for 2, 4 or 6d; B, E, H: BRPs were incubated in high glucose (20/25/30 mmol/L) for 4d followed by normal glucose (5.6 mmol/L) for 2 or 4d; C, F, I: BRPs were incubated in high glucose (20/25/30 mmol/L) for 6d followed by normal glucose (5.6 mmol/L) for 2d; J, K: BRPs incubated in continous normal or high glucose (20/25/30 mmol/L) as control. The percentage were obtained by normalizing to the normal glucose control condition defined as being 100%. aP<0.05, bP<0.01, cP<0.001 compared to normal glucose group.
Viability of BRPs cells was
gradually reduced in 30 mmol/L hyperglycemia control group (Hy CG) over time
compared with normal control group (CG; Figure 1K). The rates of viability
reduction showed positive correlation with glucose concentrations. In 20 Hy-1 (Figure
The cells apoptosis, activity and
protein expression of MnSOD and caspase
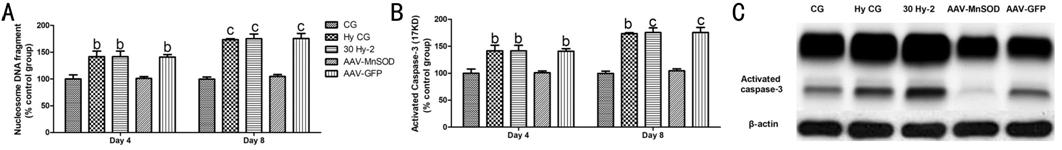
Figure 2 The role of MnSOD in BRPs
apoptosis A: Representative nucleosome DNA
fragment in different groups at day 4 or day 8; B: The expression of activitied
caspase
To further explore the underlying
mechanism of metabolic memory, the expression of MnSOD was assessed by Western
blot and RT-PCR. As showed in Figure 3, expression of MnSOD protein (Figure 3B,
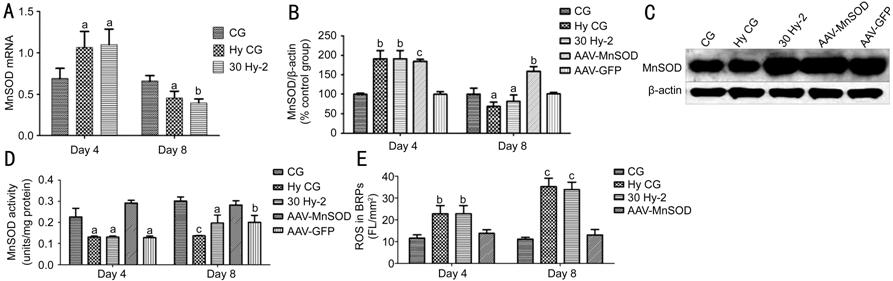
Figure 3 The effect of AAV-MnSOD transfection in BRPs apoptosis A: The expression of MnSOD mRNA for 4d or 8d; B: The expression of MnSOD protein after AAV-GFP and AAV-MnSOD for 4 or 8d; C: Representative the ratio of MnSOD and β-actin; D: The activity of MnSOD after AAV-GFP and AAV-MnSOD for 4d or 8d; E: DCF intensity per mm2 of cell area in groups pretreated with AAV-MnSOD. aP<0.05, bP<0.01, cP<0.001 compared to normal glucose group.
To detect intracellular ROS, we used two probes (Molecular Probes, Eugene, OR, USA). The probe DCFDA was used to detect hydrogen peroxide. DCFDA has no fluorescence until it passively diffuses into cells, where an esterase cleaves the acetates, and the oxidation of DCFDA produces a green fluorescent signal. MitoTracker RED FM could penetrate the cytomembrane and exert a red fluorescent signal in live cells. Thus, ROS in living cell was double marked and showed orange signal in mitochondria. The fluorescence intensity significantly increased in Hy CG and 30 Hy-2 groups versus GC group (Figure 3E; P<0.01).
Furthermore, we investigated the
effect of rAAV-MnSOD gene therapy on reversing metabolic memory phenomenon. As
shown in Figure 3B and
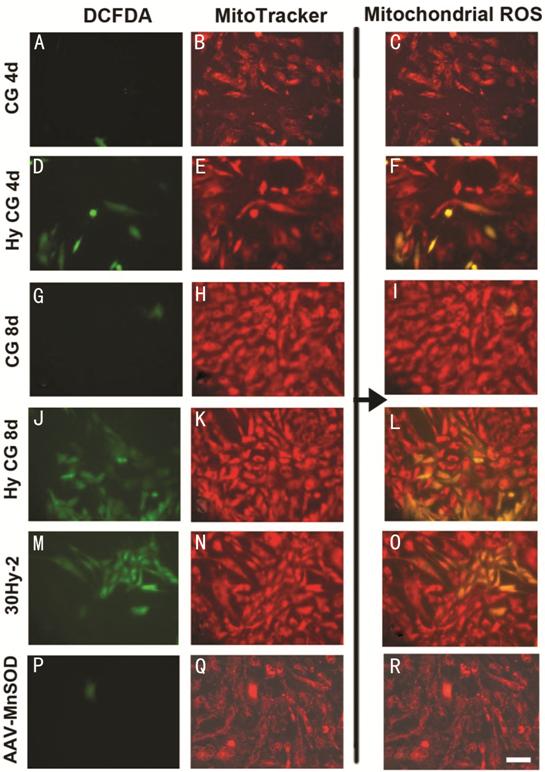
Figure 4 Location ROS and mitochondria of BRPs by DCFDA and MitoTracker probes A, D, G, J, M, P: Green fluorescence demonstrated the ROS in BRPs; B, E, H, K, N, Q: Red fluorescence demonstrated the mitochondria in BRPs; C, F, I, L, O, R: Yellow fluorescence was the merge image of green fluorescence and red fluorescence which demonstrated the ROS in mitochondria. Scale bar: 200 μm.
DISCUSSION
In the clinical course of DR, “metabolic memory” is a famous phenomenon, which indicates the long-term effect of poor prior glycemic control on diabetic complications[8, 9, 16]. This hypothesis has been supported by several large scales randomized clinical studies, while the exact mechanism remains elusive[17].
To investigate the pathophysiology changes of metabolic memory, we reported that STZ-induced rats after six months of hyperglycemia increased the thickness of capillary basement membranes in the nerve fiber layer and outer plexiform layer, decreased the ratio of pericyte area and cross-sectional area of capillary vessels, increased numbers of acellular capillaries and apoptosis of retinal capillary cells. Pathological changes listed above failing to reverse even after normalization of glucose level[14]. The earliest histopathological feature of DR is pericyte dropout from the retinal capillaries[18]. Similar experimental evidences were found in the kidney and cardiovascular system[19, 20, 21].
Emerging data suggest that the damage following hyperglycemia- induced oxidative stress is persistent for a long duration, and not easily reversed under metabolic memory situation[22, 23]. In order to seek a potential strategy to reverse this phenomenon, we imitated a model of metabolic memory in vitro. In our ex-vivo metabolic memory model, where the normal level of glucose was initiated soon after the hyperglycemia, BRPs viability remain decreasing, while cell apoptosis and activated caspase-3 expression increased over time, which indicated the model can represent metabolic memory for further investigation.
To date, four mechanisms have been regarded to play key roles in metabolic memory: oxidative stress, advanced glycation end products (AGEs), epigenetic changes, and chronic inflammation[24, 25, 26]. As reported, in the early stage of the hyperglycemia, increased oxidative stress, and excessive AGEs formation leading to a persistent damage in mitochondria. A linear relationship between AGEs accumulation and epigenetic changes, and the latter resulting DNA sequence and phenotypic changes. In this study, overproducing of intracellular ROS, the most common free radicals that contain oxygen, indicated the imbalance between the oxidative stress and antioxidant capacity. ROS are produced in mitochondria, which suggests that mitochondrial response plays an important role in hyperglycemia-induced tissue damage[24, 25, 26].
MnSOD is a mitochondrial superoxide scavenging enzyme which catalyzes the dismutation of superoxide anion (O2-) into hydrogen peroxides (H2O2) and molecular oxygen (O2) and protects cells from oxidative damage associated with exposure to ROS[18]. Previous studies showed that the decreasing of MnSOD activity was involved in the development of DR and metabolic memory phenomenon[27, 28, 29, 30]. The decreased scavenging enzymes activity and increased oxidative stress are causes of pericyte dropout in DR[31, 32]. In our study, the results showed that continuous high glucose exposure for 4 or 8d significantly elevated the ROS of mitochondria and significantly decreased the activity of MnSOD. However, the mRNA and protein expression of MnSOD was significantly increased for 4d. The increased MnSOD in early stage may be due to accommodating ROS production compensatively to protect BRPs cell from ROS damage[31]. However, with aggravation of ROS damage, the apoptosis of BRPs increased, and then the synthesis of MnSOD may be decreased in late stage and the compensative mechanism disappeared[13].
Previously, we reported that intravitreal injection of rAAV-MnSOD dramatically elevated the level and activities of retinal MnSOD in STZ-induced diabetic rats. Intravitreal injection of rAAV-MnSOD effectively increased the ratio of pericyte areas and cross-sectional areas of capillary vessels, preventing formation of acellular capillaries and apoptosis of retinal capillary cells[14]. In this study, we assessed a reverse effect for metabolic memory induced by gene therapy which focused on the expression of ROS and MnSOD, and observed similar effects on BRPs transfect with rAAV-MnSOD in vitro. Our results have demonstrated that BRPs were pretreated with rAAV-MnSOD and subsequently incubated in high glucose (30 mmol/L) for 4d followed by normal glucose (5.6 mmol/L) for 4d, the ROS of mitochondria, expression of caspase-3 and the cell apoptosis were significantly decreased compared with cells which unpretreated with rAAV-MnSOD or incubated in continuous high glucose for 8d. This suggests that the overexpression of MnSOD by rAAV-MnSOD transfection can effectively increase the activity of MnSOD, inhibit ROS production and BRPs apoptosis.
Taken together, we have presented in this study a new therapeutic method to decrease BRPs apoptosis and reverse hyperglycemic memory. Our study first builds an ex vivo cell model of metabolic memory by cell exposed in sequence in 30 mmol/L and normal glucose culture system for 4d. Furthermore, we demonstrated that delivery of antioxidant gene MnSOD can decrease BRPs apoptosis and reverse hyperglycemic memory by reducing the ROS of mitochondria. Thus, this study offers a new potential strategy to treat DR.
ACKNOWLEDGEMENTS
Foundations: Supported by the National Natural Science Foundation of China (No.81371054; No.81500746); Natural Science Foundation of Hunan Province (No.2014SK2010; No.2018JJ2576).
Conflicts of Interest: Zhang LW, None; Zhao H, None; Chen BH, None.
REFERENCES