
Citation: Chen AH, Khalid NM, Buari NH. Age factor affects reading
acuity and reading speed in attaining text information. Int J Ophthalmol 2019;12(7):1170-1176
DOI:10.18240/ijo.2019.07.19
��Investigation��
Age factor affects reading acuity and reading speed in attaining text information
Ai-Hong Chen, Nursyairah Mohd Khalid, Noor Halilah Buari
Optometry, Faculty of Health Sciences, Universiti Teknologi MARA, Cawangan Selangor, Kampus Puncak Alam 42300, Malaysia
Correspondence to: Ai-Hong Chen. Optometry, Faculty of Health Sciences, Universiti Teknologi MARA, Cawangan Selangor, Kampus Puncak Alam 42300, Malaysia. aihong0707@yahoo.com
Received:
Abstract
AIM: To investigate the effect of age on reading acuity and reading speed in attaining text information in healthy eyes.
METHODS: Reading acuity, critical print size, reading speed and maximum reading speed were measured in groups of 40 children (8 to 12 years old), 40 teenagers (13 to 19 years old), 40 young adults (20 to 39 years old), and 40 adults (40 years old and above) using the Buari-Chen Malay Reading Chart [contextual sentences (CS) set and random words (RW) set] in a cross-sectional study design.
RESULTS: Reading acuity was significantly improved by 0.04 logMAR for both CS set and RW set from children to teenagers, then gradually worsened from young adults to adults (CS set: 0.06 logMAR; RW set: 0.08 logMAR). Critical print size for children showed a significant improvement in teenagers (CS set: 0.14 logMAR; RW set: 0.07 logMAR), then deteriorated from young adults to adults by 0.09 logMAR only for CS set. Reading speed significantly increased from children to teenagers, [CS set: 46.20 words per minute (wpm); RW set: 42.06 wpm], then stabilized from teenagers to young adults, and significantly reduced from young adults to adults (CS set: 28.58 wpm; RW set: 24.44 wpm). Increment and decrement in maximum reading speed measurement were revealed from children to teenagers (CS set: 39.38 wpm; RW set: 43.38 wpm) and from young adults to adults (CS set: 22.26 wpm; RW set: 26.31 wpm) respectively.
CONCLUSION: The reference of age-related findings in term of acuity and speed of reading should be incorporated in clinical practice to enhance reading assessment among healthy eyes population.
KEYWORDS: reading acuity; critical print size; reading speed; maximum reading speed; age effect
DOI:10.18240/ijo.2019.07.19
Citation: Chen AH, Khalid NM, Buari NH. Age factor affects reading acuity and reading speed in attaining text information. Int J Ophthalmol 2019;12(7):1170-1176
INTRODUCTION
Reading is a complex skill and earned by learning[1, 2]. As economic changes revolution from traditional industry to information technology era, fluency of reading plays an important role in most educational, occupational and recreational activities[3, 4, 5, 6]. The efficiency to extract text information from our environment is a decisive factor for success in a knowledge-driven, highly-literate society[3, 4, 5, 6]. Our networked digital culture has transformed the way we read[3, 4, 5, 6].
Reading affects the quality of life from childhood to adulthood[7]. Quality of life declines for anyone who experiences difficulty in reading. Reading activity can be affected by several factors such as font size[8], font type[9], field size[10], contrast[11], eye movement[12], and age[13]. In the clinical setting, reading performance could be measured using several parameters such as reading error[14, 15], reading comprehension[16], reading rate[17], reading acuity[18], and reading speed[19]. Two good indicators about the ability of reading are reading acuity and reading speed. Further calculation for acuity and speed, which were the critical print size and maximum reading speed respectively, were the important functional measures of reading performance[19]. It echoes how we read and what we read. The reading speed increased with age, corresponding to 13% words per minute (wpm) from grades 3 to grades 8 of schoolchildren, as well as the improvement of reading acuity and critical print size[2]. The critical print size for children was adult-like by the age of 7 and reading acuity by the age of 9[20]. Healthy aging eyes exhibit subtle visual deficits. After 45 years of age, there are measurably losses especially in the middle and high spatial frequencies[21]. Eye tracking ability suffers similar subtle change with age[22]. Such losses might adversely affect performance on visual tasks involving fine detail, such as reading very small print. There is also evidence that the low-spatial frequency enhancement of contrast sensitivity due to temporal modulation is diminished in people over 60 years of age[23, 24]. Age-related deficits in extracting information from text composed of very large characters might be anticipated due to images of large texts from signage move across the retina during information extraction process. Reading speed declines for smaller or larger characters[7]. If contrast sensitivity plays a role in limiting reading speed, then age-related changes in low and high-spatial-frequency contrast sensitivity will result in reading deficits for large and small characters, respectively. Visual changes in old age other than contrast sensitivity might cause a different pattern of results. Smaller pupil size and increasing density of the crystalline lens both contribute to lower retinal illuminance and might reduce reading speeds at all character sizes. Physiological changes such as reduction of crystalline lens flexibility caused a reduction in quality of near vision that might affect reading performance[25, 26, 27]. Reading rate in normal vision is little affected by large changes in photopic luminance[28]. There might also be non-visual factors affecting reading performance in the elderly. The deterioration in reading performance was also associated with the increasing degree of addition required to see the end point, N8[29]. Reading acuity became the limiting factor[17]. Different types of optotypes, reading acuity and critical print size were essential for near visual function assessment in presbyopes because they were significantly correlated to each other[27]. Older subjects were reported to experience more noticeable deficits, even though they read about the same rate as the young subject when the text was of optimal size[7].
Conventional measures of visual functions, such as visual acuity, had limited value to reflect the performance of the daily task[1]. Skills in reading had gradually been incorporated as a standard measure of functional vision[30]. The reading chart was preferable as reading performance assessment tool, compared to near acuity chart. The full arrangement of words in the reading chart was relatively closer to the real scenario compared to the near letter acuity chart[31]. The baseline data for the reading acuity and reading speed among normally sighted from childhood to old age had been reported previously using MNREAD acuity chart. The study was accumulated over 22y with several incongruent studies, different examiners and different testing locations[13]. The data gathered from numerous studies contained more variation.
Thus, this study was conducted to investigate the effect of age on reading acuity and reading speed in attaining text information in healthy eyes, by minimizing the variation and maintain the consistency using the same examiner and the same testing location.
SUBJECTS AND METHODS
Ethical
Approval The cross-sectional experimental
study design was used to investigate the age effect on reading performance. The
study adhered to the tenets of the Declaration of Helsinki and was approved by
the Research Ethics Committee of the University [Approval Code: 600-RMI (
A total of 160 subjects were recruited and grouped according to their age; children (8 to 12 years old), teenagers (13 to 19 years old), young adults (20 to 39 years old), and adults (40 years old and above). Each group comprised of 40 subjects. All subjects were native Malay speakers and fluent in reading and speaking in the Malay language. All subjects had completely healthy eyes (no identifiable pathology). None of the subjects participated had the history of reading problems, visual or cognitive impairment. Subjects were screened for binocular vision procedures to exclude subjects with any latent binocular vision anomalies. Full refraction was carried out prior to the study to achieve an optimum near prescription for presbyopic subjects.
Despite many existing standardized reading charts such as MNREAD acuity chart[32], Bailey-Lovie reading chart[33], Radner Reading Chart[34], and Practical Near Acuity Chart[35], Buari-Chen Malay Reading Chart (BCMRC)[36] was used in our study due to the importance of using language that was familiar and mother tongue to our subjects. It has also been tested to have a good precision (repeatability and reproducibility) to be used as reading research tool and clinical diagnostic tool[37]. Another reason for BCMRC selection was due to the mixed sentence structure of the chart, including contextual sentences (CS) set and random words (RW) set[36]. CS or known as meaningful texts were found to have faster reading speed compared to RW or unrelated texts[38]. Both the reading strategy and the level of comprehension used for the two reading tasks were different[38]. In addition, CS also allowed the subjects to give a correct interpretation of the whole sentences without being conscious of having seen the words in the sentence but not for unrelated words[39]. Moreover, the CS make the task of establishing a near acuity threshold easier, more practical and relevant[36]. The strong correlation of near acuity was found previously between PNAC (CS) and Bailey-Lovie Word Reading Chart (RW)[36]. However, reading the PNAC recorded only half of the time taken by the Bailey-Lovie. Reading the RW took about double the time of reading CS[39]
Reading
assessments were conducted in a standardized experimental reading set up. The
BCMRC was placed on a reading stand inclined at 45�� with the chart illumination
range from 250 to 320 lx using a table lamp. Subjects were required to read
both sets of BCMRC in random order at a testing distance of
Reading acuity was defined as the smallest print size that can be read. Reading acuity in our study was calculated using an equation of 1.4�C(sentence��0.1)+(errors��0.017), where the sentence was a logMAR record for the smallest line a subject read and errors were counted as the number of misread word following the oral reading error categories[14, 15]. The critical print size was the optimal print size for reading or the smallest print that subject could be read with maximum rate[19]. Reading speed and maximum reading speed were measured. Reading speed was determined for each sentence by dividing the number of correct words in the sentence to the time taken (in a minute) to read the sentence[40]. Final reading speed for each subject was the average of reading speed for all print sizes, from the largest print to the reading acuity. An objective measure of the best reading performance could be predicted by calculating maximum reading speed[19]. Normally sighted subjects and most of the low vision subjects will obtain a typical shape of the graph of reading speed versus print size[13]. Reading speed was relatively constant across a large print size, resulted in plateau shape of the graph until it reached one point (critical print size) where the reading speed was significantly dropped. The maximum reading speed was measured by the mean of reading speed from the largest print up to critical print size sentence[41].
The data obtained was then analyzed using the Statistical Package of Social Sciences (SPSS) version 20.0 (USA). The descriptive data were presented as the mean��SD. A one-way multivariate analysis of variance (MANOVA) was run to determine the effect of different age groups (children, teenagers, young adults, and adults) on reading acuity and reading speed in different sets of sentence structured reading chart; CS set and RW set. The significant level was set at 0.05.
RESULTS
Age of subjects ranged from 8 to 71 years old (mean age: 25.63��18.60y). Subjects were classified into four groups; children (9.93��1.37y), teenagers (14.88��1.44y), young adults (23.08��2.57y), and adults (56.25��8.30y). Data were normally distributed for each group, as assessed by the Shapiro-Wilk test (P>0.05). One-way MANOVA was conducted to determine if acuity and speed of reading were different between groups with different age in reading both sets of the reading chart. All parameters improved with increasing age.
Reading Acuity The effect of age on the reading acuity was tabulated in Table 1 and plotted in Figure 1. Data were presented as a mean��SD. The reading acuity showed fairly steep improvement (reduction of logMAR) from children to teenagers, to young adults, but constant decline (increment of logMAR) towards adults group.
Table 1 Summary of mean and SD for reading acuity and critical print size in four different age groups������logMAR
Groups |
Reading acuity |
Critical print size |
||
CS set |
RW set |
CS set |
RW set |
|
Children |
0.07��0.08 |
0.11��0.06 |
0.28��0.12 |
0.31��0.11 |
Teenagers |
0.02��0.05 |
0.07��0.06 |
0.15��0.12 |
0.23��0.14 |
Young adults |
0.01��0.03 |
0.05��0.04 |
0.11��0.10 |
0.22��0.13 |
Adults |
0.08��0.08 |
0.13��0.08 |
0.20��0.11 |
0.25��0.11 |
CS: Contextual sentences; RW: Random words.
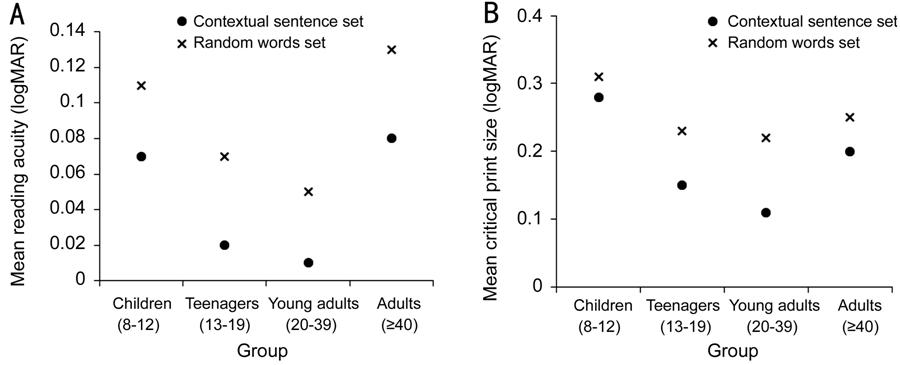
Figure 1 Comparison of reading acuity (A) and critical print size (B) among four different age groups in CS set and RW set.
One-way MANOVA was run to determine the effect of age on reading acuity and critical print size. Two sets of reading chart were used, CS set and RW set. All subjects achieved a better acuity (smaller logMAR) in reading CS set compared to RW set. The differences between age group on the reading acuity [F(6, 310)=6.919, P<0.001; Wilks�� ��=0.778; partial ��2=0.118] and critical print size [F(6, 310)=8.268, P<0.001; Wilks�� ��=0.743; partial ��2=0.138] were both statistically significant. Tukey HSD post-hoc tests showed that reading acuity was statistically significant improved from children to teenagers (P<0.05) for both CS set (mean difference =0.05 logMAR; 95%CI=0.01 to 0.08 logMAR) and RW set (mean difference=0.04 logMAR; 95%CI=0.00 to 0.07 logMAR), but significantly deteriorated from young adults to adults (P<0.05) also in both CS set (mean difference=-0.06 logMAR; 95%CI=-0.10 to -0.03 logMAR) and RW set (mean difference=-0.08 logMAR; 95%CI=-0.11 to -0.04 logMAR). No significant difference in reading acuity between teenagers and young adults and also between children and adults (P>0.05). For critical print size, Tukey HSD post-hoc revealed different outcomes between CS set and RW set. CS set had statistically improved (P<0.05) critical print size from children to teenagers (mean difference=0.14 logMAR; 95%CI=0.07 to 0.20 logMAR) and between children and adults (mean difference=0.09 logMAR; 95%CI=0.02 to 0.15 logMAR). Critical print size also significantly declined (P<0.05) from young adults to adults (mean difference=-0.09 logMAR; 95%CI=-0.15 to -0.02 logMAR) for CS set. RW set only showed significant improved (P<0.05) critical print size between children to teenagers (mean difference=0.07 logMAR; 95%CI=0.00 to 0.15 logMAR), but no significant difference found between other groups comparison (P>0.05).
Reading Speed The speed of reading was quantified using two parameters of reading, reading speed and maximum reading speed. Data were presented as the mean��SD tabulated in Table 2 and illustrated in Figure 2. According to age order, the reading speed increased from children to teenagers, about plateau from teenagers to young adults, and decreased in reaching adults. The effect of age on the reading speed was analyzed using one-way MANOVA. All subjects read faster in reading CS set compared to RW set. The differences between age group on the reading speed was statistically significant [F(6, 310)=13.887, P<0.001; Wilks�� ��=0.621; partial ��2=0.212], as well as comparison of maximum reading speed among different age [F(6, 310)=14.149, P<0.001; Wilks�� ��=0.616; partial ��2=0.215].
Table 2 Summary of mean and SD for reading speed and maximum reading speed in four different age groups
Groups |
Reading speed (wpm) |
Maximum reading speed (wpm) |
||
CS set |
RW set |
CS set |
RW set |
|
Children |
144.25��29.17 |
98.09��21.95 |
159.40��30.49 |
105.38��22.94 |
Teenagers |
190.46��30.58 |
140.15��24.41 |
198.77��28.20 |
148.76��24.03 |
Young adults |
193.12��25.58 |
137.59��19.98 |
199.71��25.98 |
149.06��20.35 |
Adults |
164.54��27.63 |
116.15��27.35 |
177.45��23.57 |
122.75��27.54 |
CS: Contextual sentences; RW: Random words.
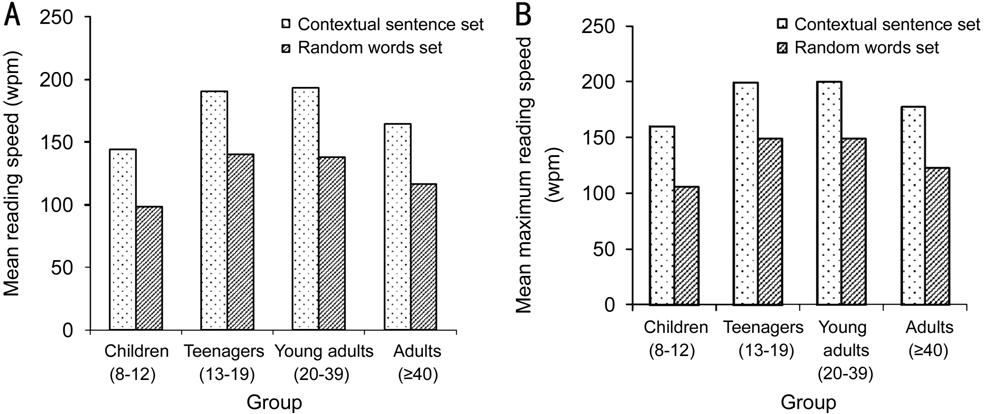
Figure 2 Comparison of reading speed (A) and maximum reading speed (B) among four different age groups in CS set and RW set.
Tukey HSD post hoc analysis revealed that the increment of reading speed from children to teenagers (CS set: MD=-46.20 wpm; 95%CI=-62.64 to -29.77 wpm, RW set: MD=-42.06 wpm; 95%CI=-55.75 to -28.37 wpm) and also decrement of reading speed from young adults to adults (CS set: MD=28.58 wpm; 95%CI=12.15 to 45.02 wpm, RW set: MD=21.44 wpm; 95%CI=7.75 to 35.14 wpm) were statistically significant (P<0.05), about 14% and 9% respectively, but no significant difference of reading speed found between teenagers and young adults (P>0.05). Similar to reading speed, maximum reading speed also increased from children, to teenagers, to young adults, but decreased in adults, as according to age order. About 14% increment (CS set: MD=-39.38 wpm; 95%CI= -55.16 to -23.59 wpm, RW set: MD=-43.38 wpm; 95%CI= -57.23 to -29.53 wpm) of maximum reading speed from children to teenagers and 8% decrement (CS set: MD=22.26 wpm; 95%CI=6.47 to 38.04 wpm, RW set: MD=26.31 wpm; 95%CI=12.46 to 40.17 wpm) from young adults to adults were proven to be significantly different (P<0.05) by Tukey HSD post hoc analysis. Summary of reading speed and maximum reading speed were tabulated in Table 2 and plotted in Figure 2.
DISCUSSION
Reading Acuity There was a steady increment in reading acuity and critical print size from children to teenagers and young adults before they declined in adults. The previous study has shown that a steep improvement pattern of reading acuity from children (-0.10 logMAR at the age of 8) to teenage years (-0.18 logMAR at the age of 16) and declined throughout adulthood (-0.05 logMAR by age of 81)[13]. Our study found similar pattern, where the reading acuity improved from children (CS set: 0.07 logMAR; RW set: 0.11 logMAR) to teenagers (CS set: 0.02 logMAR; RW set: 0.07 logMAR), to young adults (CS set: 0.01 logMAR; RW set: 0.05 logMAR), and declined in adults group (CS set: 0.08 logMAR; RW set: 0.13 logMAR). Critical print size in our study also displayed a similar pattern as per in reading acuity. However, it was contradicted to the previous claim that stated a different pattern in which critical print size was a plateau for children and teenagers, the slight increment in logMAR for young and middle-aged, and pronounced increase for older population[13]. This contradiction might be due to the dissimilarity of age range distribution among children. Children in previous study aged from 8 to 16 years old[13], while children in our study aged from 8 to 12 years old. Even though the visual acuity for children was found to be fully matured at the age of 5 years[42], but it might not reflect the reading abilities and skills.
Our findings
for reading acuity using Buari-Chen Malay Reading Chart (BCMRC) was found
higher in logMAR compared to previous studies findings using other standard
reading charts such as MNREAD acuity charts and Radner Reading Chart (RRC).
This might be due to the different limit of print sizes. Print size is closely
linked to spatial frequency. Previous studies examined the age effect on the
spatial frequency and reading rate might shield some clues on this hypothetical
assumption. In a study where reading rate was measured as a function of angular
character size for groups of young (mean age 21.6y) and old (mean age 68.3y)
subjects[7], the old group showed greater deficits
for large (12 degrees) and small (0.15 degree) characters than for characters
of intermediate size. They argued based on the fundamental characteristic of
the spatial frequency in the font size. Reading rates for normally sighted
subjects were reported to be the greatest for a range of intermediate character
sizes ranging from about 0.3 degrees to 2 degrees[17].
The spatial-frequency resolution required for reading 0.15 degree characters is
about 13 cycles per degree (cpd)[43]. The
fundamental spatial-frequency for a 0.15 degree character size is approximately
6.7 cpd. Reading requires spatial frequencies extending to at least twice the
fundamental frequency. Contrast sensitivity of 13 cpd in old age was also
reported to reduce by about a factor of 3 from young normal values[24, 43, 44]. At
this character size, the old group reads at 66% of the rate of the young group.
Therefore, losses in contrast sensitivity can account quantitatively for the
age-related reduction in reading rate at 0.15 degree. MNREAD acuity chart
consisted of a range of print sizes until -0.5 logMAR[40] and RRC had print sizes until -0.2 logMAR[45],
while BCMRC had the smallest print size of 0.00 logMAR[36],
similar with Bailey-Lovie chart[34] and Practical
Near Acuity Chart[36]. The threshold for reading
acuity was 0.00 logMAR which was equivalent to 6/6 or 20/
Reading Speed Both reading speed and maximum reading speed increased with age and deteriorated when reached adults age, 40y and above. Our findings on the reading speed for children were aligned with the previous report using MNREAD acuity chart. They reported that maximum reading speed increased by 65 wpm from 8 to 15 years old, about plateau for young adults with slight decrement by only 1.68 wpm (16 to 40 years old), and reduced for older population by 25 wpm (from 40 to 81 years old)[13]. The increment of reading speed in our study also showed drastic changes from children (mean age: 9.93y) to teenagers (mean age: 14.88y) by approximately 42.76 wpm. It might due to the maturation of the white matter in the left temporal-parietal of brain connectivity that correlated to the range of reading ability among children 8 to 12 years old[46]. The mean reading speed among children was found to be lower in the MNREAD acuity chart compared to our findings of the reading speed on CS set, 126.18 wpm[2]. It might due to the method used for reading which was monocular, each eye for each chart[2]. However, binocularity was found to be physiologically correlated to reduce fixation disparity during fixation, and minimum amount of fixation disparity reflected the optimal binocular status[47]. The mean data of maximum reading speed for Radner Reading Chart among children[48] was found to be slightly higher (169.46 wpm), compared to maximum reading speed for CS set in our study (159.40 wpm). The age range was different. Their age range was slightly older (10 to 12y), compared to our study (8 to 12y). Different age represented different grade in school. One grade indicated one additional year of education. That made a difference because reading speed increased with school grade[2].
Our study confirmed that no increment from teenagers to young adults which was in agreement with the previous study[13]. The reading speed remained almost constant from 16 to 40 years old, as the reading skills had fully developed[13]. The range of reading speed among teenagers and young adults in our study supported previous studies that assessed the reading speed among the same age group[42, 45, 49, 50, 51]. The reading speed then decreased later in life. As found in our study, the reading speed among adults was significantly reduced compared to young adults, about 9% decrement in wpm. The reduction of reading speed among adults supported the previous study that reported the maximum reading speed decreased from 200 wpm in young adults to 175 wpm in adults[13]. Reading ability was found significantly declined with age even among a group of people with good acuity[52]. Three possible contributing factors for the apparent reduction in reading speed among older adults: reduced contrast sensitivity in increasing age[53], deterioration in motor processing such as eye movement[54], and defective transient system[7]. Contrast sensitivity reduced by about a factor of 3 for older subjects[23]. Oculomotor limitations provided an alternative qualitative explanation for the age-related reading speed reduction. There was evidence of age-related deficits in eye-movement control[22]. A defective transient system in older subjects with longer lasting neural images at low-spatial frequency might affect the reading speed[55, 56]. Other factors affecting reading in older age including slowing down in visual processing[55] and declined in cognitive processing[57].
In conclusion, reading performance equivalent to age among healthy eyes population was established using the Buari-Chen Malay Reading Chart. The information could be a useful guide in assessing reading acuity and reading speed in clinical practice. Limitation of our study was the lacking of normative data for different types of visual impairment. Future research might focus on developing norms for different types of visual impairments for visual rehabilitation purposes.
ACKNOWLEDGEMENTS
Foundation: Supported by the Research Grant Scheme 600-IRMI-DANA 5/3/BESTARI (00013/2016) and 600-IRMI/MYRA 5/3/MITRA (007/2017)-2 from the Universiti Teknologi MARA, Malaysia
Conflicts of Interest: Chen AH, None; Khalid NM, None; Buari NH, None.
REFERENCES