
Citation: Wang SL, Piao SY, Xu MY, Zhang W, Ma JQ, Hao J, Chi H, Xue ZQ, Ha SP, Zhuang WJ. Evaluating correlation between the ocular biometry and genetic variants of MYOC and ABCA1 with primary angle-closure glaucoma in a cohort from northern China. Int J Ophthalmol 2019;12(8):1317-1322. DOI:10.18240/ijo.2019.08.13
・Investigation・
Evaluating correlation between the ocular biometry and genetic variants of MYOC and ABCA1 with primary angle-closure glaucoma in a cohort from northern China
Shao-Lin Wang1,2, Shun-Yu Piao1, Man-Yun Xu2, Wen Zhang2, Jian-Qing Ma3, Juan Hao4, Hao Chi5, Zhong-Qi Xue2, Shao-Ping Ha2, Wen-Juan Zhuang2
1Clinical Medical College of Ningxia Medical University, Yinchuan 750001, Ningxia Hui Autonomous Region, China
2Ningxia Eye Hospital, People’s Hospital of Ningxia Hui Autonomous Region (First Affiliated Hospital of Northwest University For Nationalities), Yinchuan 750011, Ningxia Hui Autonomous Region, China
3Department of Ophthalmology, Wuzhong People’s Hospital, Wuzhong 751100, Ningxia Hui Autonomous Region, China
4Department of Ophthalmology, Taiyuan Central Hospital, Taiyuan 030000, Shanxi Province, China
5Shandong Academy of Medical Sciences, Jinan University, Jinan 250000, Shandong Province, China
Co-first authors: Shao-Lin Wang and Shun-Yu Piao
Correspondence to: Wen-Juan Zhuang and Shao-Ping Ha. Ningxia Eye Hospital, People’s Hospital of Ningxia Hui Autonomous Region, 936 Huang He East Road, Yinchuan 750011, Ningxia Hui Autonomous Region, China. zh_wenj@163.com; hashaoping@163.com
Received:
Abstract
AIM: To investigate whether the gene variants in MYOC and ABCA1 are associated with primary angle-closure glaucoma (PACG) and anterior chamber depth (ACD) and axial length (AL) in samples from northern China.
METHODS: The present case-control association study consisted
of 500 PACG patients and 720 unrelated controls. Each participant was genotyped
for eleven single nucleotide polymorphisms (SNPs) in MYOC and ABCA1 genes
(rs12076134, rs183532, rs235875 and rs
RESULTS: Two SNPs rs183532 and rs235875 as well as a haplotype TTC in MYOC were nominally associated with PACG despite the significance was lost after Bonferroni correction. No association was observed between ABCA1 and PACG, neither did the association between these variants and ACD as well as AL.
CONCLUSION: The present study suggests MYOC and ABCA1 do not play a part in the pathogenesis of PACG as well as the regulation of ocular biometric parameters in a northern Chinese population. Further investigations with large sample size are needed to verify this consequence.
KEYWORDS: MYOC; ABCA1; primary angle-closure glaucoma; anterior chamber depth; axial length; single nucleotide polymorphisms
DOI:10.18240/ijo.2019.08.13
Citation: Wang SL, Piao SY, Xu MY, Zhang W, Ma JQ, Hao J, Chi H, Xue ZQ, Ha SP, Zhuang WJ. Evaluating correlation between the ocular biometry and genetic variants of MYOC and ABCA1 with primary angle-closure glaucoma in a cohort from northern China. Int J Ophthalmol 2019;12(8):1317-1322
INTRODUCTION
Glaucoma is a common eye disease characterized by the progressive degeneration of retinal ganglion cells and optic nerve axons, for which, intraocular pressure (IOP) is the primary modifiable risk factor[1]. Meanwhile, glaucoma is considered to be the most common disease leading to irreversible blindness worldwide[2]. In 2013, the glaucoma patients in the elderly population (aged 40-80y) worldwide was estimated to be 64.3 million, which will increase to 76.0 million in 2020 and 111.8 million in 2040[3]. According to the anatomical features, glaucoma is mainly subdivided into two major forms: primary open angle glaucoma (POAG) and primary angle-closure glaucoma (PACG). The prevalence of POAG is highest in Africa while most PACG cases are in Asia[4-5], especially in China[6]. Epidemiological studies have found that PACG is the most common cause of bilateral glaucoma blindness worldwide[7].
Glaucoma is a multifactorial disease, genetic factors take an important part in its pathogenesis[1], many disease-causing mutations and multiple susceptibility loci have been found to be associated with various forms of glaucoma. What’s interesting is some genetic risks are shared for the two main types of glaucoma PACG and POAG, for example polymorphisms within the ARHGEF12 and GAS7 gene are found to be associated with both POAG and PACG[8]. Since MYOC is preferentially expressed in trabecular meshwork (TM)[9], which is thought to affect the outflow of aqueous humor resulting in elevation of IOP[10], while ABCA1 has been proved to be associated with POAG and IOP by GWAS[11], in addition, mutations in MYOC gene as well as variants near ABCA1 gene have been confirmed to be associated with POAG[12-15]. In view of this, this study aimed to investigate whether the POAG related genes MYOC and ABCA1 are associated with PACG in a northern Chinese cohort. Meanwhile, the associations between these single nucleotide polymorphisms (SNPs) and anterior chamber depth (ACD) and axial length (AL) were also evaluated.
SUBJECTS AND METHODS
Ethical Approval The present study was approved by the Ethics Committee of Ningxia People’s Hospital and its implementation process strictly complied with the standards of the Declaration of Helsinki. Each participant was informed in detail of the purpose of the study and signed a written informed consent prior to the study.
Subjects It consisted of 500 PACG cases and 720 unrelated control subjects recruited from Ningxia Eye Hospital from the northern regions of China. The detailed ophthalmic examinations for every participant as well as the inclusion and exclusion criteria were identical to our previous study[16].
DNA Extraction Peripheral venous blood was drawn from all subjects, genomic DNA was extracted utilizing the Simgen DNA Blood Mini Kit (Simgen, Hangzhou, China) according to the manufacturer’s protocol. The extracted DNA was eluted in TE buffer (10 mmol/L Tris-HCl, 0.5 mmol/L EDTA, pH 9.0) and was measured for the A260/A280 optical density by Nanodrop2000. DNA was then stored at -80° until use.
Single
Nucleotide Polymorphism Selection and Genotyping Drew on the experiences of previous
studies[17-18], eleven SNPs
were chosen as candidate SNPs including rs12076134, rs183532, rs235875 and rs
Statistical Analysis The comparison of demographic characteristics between cases and controls and the correlation analysis between genotypes and ocular biometric parameters were implemented by SPSS software (version 17.5: SPSS Science, Chicago, IL, USA). Linkage disequilibrium (LD) patterns were generated using Haploview 4.2 software (Daly Lab at the Broad Institute, Cambridge, MA). The genetic association analyses were performed by PLINK (version 1.07; http://pngu.mgh.harvard.edu/-purcell/plink/, in the public domain) using a logistic regression model. Bonferroni correction was used for multiple comparisons and the statistical power was evaluated by the Power and Sample Size Calculation (PS; version 3.1.232).
RESULTS
We enrolled 500 PACG patients and 720 control subjects in this study. The general demographic characteristics of the participants are listed in Table 1. The control subjects were significantly older and included less women than the case group.
Table 1 Demographic characteristic of study participants
Parameters |
PACG |
Controls |
P |
Number |
500 |
720 |
|
Age, y, mean±SD |
63.77±9.576 |
71.82±7.2 |
0.000 |
Gender, n (%) |
0.000 |
||
Male |
147 (29.4) |
332 (46.1) |
|
Female |
353 (70.6) |
388 (53.9) |
PACG: Primary angle-closure glaucoma.
All eleven SNPs conformed to the Hardy-Weinburg
equilibrium (HWE; P>0.05; Table 2), in which, rs
Table 2 Allele frequencies and the association between SNPs and PACG under the allelic model
Gene |
SNP |
CHR |
BP |
Minor allele |
Genotype (AA/Aa/aa)a |
MAF |
HWE-P |
OR (95%CI) |
P |
|||
Case |
Control |
Case |
Control |
Case |
Control |
|||||||
MYOC |
rs12076134 |
1 |
171606054 |
G |
331/150/19 |
468/218/33 |
0.188 |
0.198 |
0.662 |
0.2401 |
0.954 (0.759-1.198) |
0.6828 |
MYOC |
rs183532 |
1 |
171609481 |
T |
295/181/24 |
402/271/47 |
0.229 |
0.254 |
0.7037 |
0.9215 |
0.781 (0.629-0.969) |
0.025 |
MYOC |
rs235875 |
1 |
171613756 |
T |
239/204/57 |
363/300/57 |
0.318 |
0.287 |
0.1813 |
0.716 |
1.171 (0.964-1.423) |
0.1124 |
MYOC |
rs235913 |
1 |
171618656 |
T |
193/225/82 |
237/363/120 |
0.389 |
0.419 |
0.2586 |
0.3589 |
0.883 (0.733-1.063) |
0.1895 |
ABCA1 |
rs2422493 |
9 |
107690995 |
A |
175/242/83 |
232/374/114 |
0.408 |
0.418 |
1 |
0.0782 |
0.968 (0.801-1.171) |
0.7397 |
ABCA1 |
rs2487042 |
9 |
107694522 |
T |
262/192/46 |
366/296/58 |
0.284 |
0.286 |
0.2262 |
0.9274 |
0.959 (0.783-1.173) |
0.6817 |
ABCA1 |
rs2472496 |
9 |
107695353 |
A |
169/237/94 |
223/372/125 |
0.425 |
0.433 |
0.5219 |
0.1718 |
0.979 (0.812-1.181) |
0.8267 |
ABCA1 |
rs2472493 |
9 |
107695848 |
A |
149/245/106 |
195/382/142 |
0.457 |
0.464 |
0.7871 |
0.0722 |
0.992 (0.822-1.197) |
0.9303 |
ABCA1 |
rs2487032 |
9 |
107703934 |
A |
156/239/105 |
202/374/143 |
0.449 |
0.459 |
0.4697 |
0.2295 |
0.942 (0.782-1.135) |
0.5304 |
ABCA1 |
rs2472459 |
9 |
107710562 |
T |
250/196/54 |
350/306/64 |
0.304 |
0.302 |
0.1124 |
0.8596 |
0.981 (0.804-1.196) |
0.8476 |
ABCA1 |
rs2472519 |
9 |
107715878 |
G |
236/202/62 |
333/314/71 |
0.326 |
0.318 |
0.0832 |
0.8634 |
0.984 (0.809-1.196) |
0.8691 |
SNP: Single nucleotide polymorphisms; PACG: Primary angle-closure glaucoma; CHR: Chromosome; BP: Base pair position; MAF: Minor allele frequency; HWE-P: The P-value of Hardy-Weinburg equilibrium; OR: Odds ratio; CI: Confidence intervals. P, OR, and CI were calculated with logistic regression model by adjusting for age and gender under the allelic model with the major allele as reference. aA represents the wild allele and a represents the minor allele.
Table 3 Genotype distribution of target SNPs in cases and controls
Gene |
SNP |
Dominant model |
Recessive model |
||||||||||
Aa+aaa |
AAa |
Aa+aab |
AAb |
OR (95%CI) |
P |
aaa |
AA+Aaa |
aab |
AA+Aab |
OR (95%CI) |
P |
||
MYOC |
rs12076134 |
169 |
331 |
251 |
468 |
0.960 (0.732-1.26) |
0.769 |
19 |
481 |
33 |
686 |
0.858 (0.447-1.649) |
0.647 |
MYOC |
rs183532 |
205 |
295 |
318 |
402 |
0.748 (0.575-0.972) |
0.029 |
24 |
476 |
47 |
673 |
0.707 (0.403-1.242) |
0.228 |
MYOC |
rs235875 |
261 |
239 |
357 |
363 |
1.114 (0.861-1.441) |
0.412 |
57 |
443 |
57 |
663 |
1.595 (1.04-2.446) |
0.032 |
MYOC |
rs235913 |
307 |
193 |
483 |
237 |
0.776 (0.593-1.015) |
0.064 |
82 |
418 |
120 |
600 |
0.987 (0.698-1.397) |
0.942 |
ABCA1 |
rs2422493 |
325 |
175 |
488 |
232 |
0.852 (0.649-1.12) |
0.251 |
83 |
417 |
114 |
606 |
1.168 (0.822-1.661) |
0.386 |
ABCA1 |
rs2487042 |
238 |
262 |
354 |
366 |
0.858 (0.663-1.11) |
0.243 |
46 |
454 |
58 |
662 |
1.324 (0.831-2.112) |
0.238 |
ABCA1 |
rs2472496 |
331 |
169 |
497 |
223 |
0.836 (0.635-1.101) |
0.203 |
94 |
406 |
125 |
595 |
1.221 (0.873-1.71) |
0.244 |
ABCA1 |
rs2472493 |
351 |
149 |
524 |
195 |
0.861 (0.647-1.146) |
0.305 |
106 |
394 |
142 |
577 |
1.18 (0.855-1.628) |
0.314 |
ABCA1 |
rs2487032 |
344 |
156 |
517 |
202 |
0.795 (0.599-1.055) |
0.112 |
105 |
395 |
143 |
576 |
1.126 (0.816-1.554) |
0.471 |
ABCA1 |
rs2472459 |
250 |
250 |
370 |
350 |
0.865 (0.668-1.119) |
0.270 |
54 |
446 |
64 |
656 |
1.401 (0.899-2.183) |
0.137 |
ABCA1 |
rs2472519 |
264 |
236 |
385 |
333 |
0.846 (0.653-1.095) |
0.204 |
62 |
438 |
71 |
647 |
1.443 (0.95-2.192) |
0.086 |
SNP: Single nucleotide polymorphisms; OR: Odds ratio; CI: Confidence intervals. aThe genotype counts in cases; bThe genotype counts in controls; a represents the minor allele, A represents the wild allele; Dominant model: Aa+aa compared with AA; Recessive model: aa compared with AA+Aa. P, OR, and CI were calculated with logistic regression model by adjusting for age and gender.
Table 4 Haplotype frequencies in PACG and control cohorts
Block |
SNPs |
Haplotype |
f1 (%) |
f2 (%) |
ORa |
Pa |
P-permutationb |
Block 1 |
rs2487042, rs2472496, rs2472493 |
TAA |
0.283 |
0.286 |
0.958 |
0.679 |
0.9998 |
CAA |
0.14 |
0.146 |
1.01 |
0.913 |
1 |
||
CGA |
0.034 |
0.031 |
1.2 |
0.493 |
0.9967 |
||
CGG |
0.541 |
0.537 |
0.998 |
0.98 |
1 |
||
Block 2 |
rs2487032, rs2472459, rs2472519 |
ATG |
0.303 |
0.293 |
1.01 |
0.905 |
1 |
ACG |
0.018 |
0.019 |
0.72 |
0.334 |
0.9671 |
||
ACA |
0.127 |
0.141 |
0.948 |
0.691 |
1 |
||
GCA |
0.546 |
0.534 |
1.06 |
0.536 |
0.9981 |
||
Block 3 |
rs12076134, rs183532, rs235875 |
TCT |
0.315 |
0.284 |
1.18 |
0.104 |
0.6279 |
TTC |
0.223 |
0.253 |
0.77 |
0.018 |
0.1576 |
||
GCC |
0.179 |
0.196 |
0.94 |
0.598 |
0.999 |
||
TCC |
0.274 |
0.264 |
1.1 |
0.34 |
0.9693 |
OR: Odds ratio; f1: Haplotype frequencies in cases; f2: Haplotype frequencies in controls. aOR and P value were calculated with logistic regression model by adjusting for age and gender. bA total of 10 000 permutations were performed.
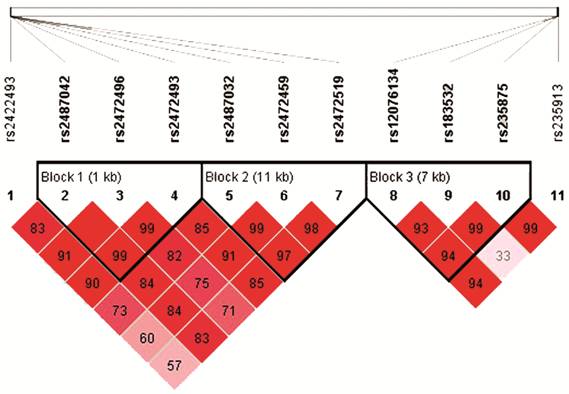
Figure 1 The patterns of linkage disequilibrium of the eleven target SNPs with their D’ value Three haplotype blocks are presented in HapMap CHB cohort combined of PACG cases and controls.
Table 5 Association between SNPs and AL and ACD
Gene |
SNP |
Minor allele |
ACD (2.74±0.474; 0.67-3.51)a |
AL (22.92±0.891; 20.01-25.51)a |
||||
β |
SE |
P |
β |
SE |
P |
|||
MYOC |
rs12076134 |
G |
0.008 |
0.0194 |
0.674 |
-0.009 |
0.037 |
0.817 |
MYOC |
rs183532 |
T |
0.027 |
0.0178 |
0.132 |
-0.015 |
0.0345 |
0.667 |
MYOC |
rs235875 |
T |
-0.017 |
0.0175 |
0.330 |
-0.010 |
0.0328 |
0.757 |
MYOC |
rs235913 |
T |
0.008 |
0.0158 |
0.617 |
0.014 |
0.0290 |
0.635 |
ABCA1 |
rs2422493 |
A |
0.009 |
0.0162 |
0.598 |
0.017 |
0.0319 |
0.592 |
ABCA1 |
rs2487042 |
T |
0.009 |
0.0174 |
0.594 |
-0.014 |
0.0338 |
0.688 |
ABCA1 |
rs2472496 |
A |
0.014 |
0.0161 |
0.395 |
0.006 |
0.0314 |
0.85 |
ABCA1 |
rs2472493 |
A |
0.013 |
0.0160 |
0.405 |
-0.011 |
0.0313 |
0.725 |
ABCA1 |
rs2487032 |
A |
-0.005 |
0.0161 |
0.758 |
0.025 |
0.0301 |
0.407 |
ABCA1 |
rs2472459 |
T |
-0.0001 |
0.0178 |
0.996 |
-0.013 |
0.0342 |
0.714 |
ABCA1 |
rs2472519 |
G |
-0.003 |
0.0173 |
0.844 |
0.010 |
0.0337 |
0.770 |
SNP: Single nucleotide polymorphisms; AL: Axial length; ACD: Anterior chamber depth; β: Per-allele effect of the minor allele; SE: Standard error; P: P-value for association adjusting for age and gender. aThe mean±SD and the range of measured values for AL or ACD.
Due to the differences of the minor allele frequencies (MAF), the power varies between the eleven SNPs. Therefore, assuming an allelic odds ratio (OR) of 1.5, our sample size provides more than 98% of statistical power to detect a significant association at an α level of 0.05.
DISCUSSION
The present
study evaluated the association of two POAG related genes MYOC and ABCA1 with PACG in a northern China cohort and found rs183532 and rs235875 as
well as a haplotype TTC in MYOC were nominally associated with PACG,
moreover, there was no correlation between ABCA1 and PACG. Glaucoma is a
multifactorial disease, genetic factors have been found to be significant for
its progression[1]. Studies have shown that PACG
partly shared the genetic risks with POAG[8]. MYOC is the first and the most significant gene found to be associated with POAG[9-10]. About 3% to 5% of adult POAG
cases worldwide are caused by MYOC[19-23]. MYOC is preferentially expressed in the
anterior segment of eye, especially in the TM[13,24]. Transgenic mouse models of POAG indicated mutant MYOC accumulated in the endoplasmic reticulum of TM, thereby inducing endoplasmic
reticulum stress in TM, which was found to be associated with TM cell death and
elevation of IOP[25-26]. The
mechanism of action of MYOC working in POAG is still being researched
deeply, since PACG and POAG share the same basic characteristics: elevated IOP
and progressive degeneration of retinal ganglion cells and optic nerve axons[1]. Whether or not MYOC is associated with PACG is
also worth exploring. Faucher et al[27] founded a mutation in MYOC was associated with PACG in the Quebec
population. The association between MYOC gene mutation and PACG was also
reported in Chinese population[28-29].
Even so, there are also some studies that did not support the association
between MYOC mutation and PACG[30-31].
Hence. The relationship of MYOC gene variants with PACG is still
unclear. In 2015, Jin et al[17] identified
rs
ABCA1 gene
encodes a membrane protein that is a major regulator of cellular cholesterol
and phospholipid homeostasis[32]. It is expressed
in many ocular tissues especially in the ganglion cell layer of retina[11]. Recent GWAS have indicated that genetic variants
near ABCA1 gene were significantly associated with POAG[11-12]. Variants near ABCA1 gene were also associated with IOP in normal populations[15].
Previous studies using the DBA/2J glaucoma mouse model identified ABCA1 was related to ganglion cell death[33].
Degeneration of retinal ganglion cells is a common sign of both PACG and POAG[1]. It also prompts us for the possible association
between ABCA1 and PACG. However, Luo et al[18] evaluated the correlation between ABCA1 and PACG in a Chinese population
and did not find a certain association between them, although they found two
haplotypes in ABCA1 were associated with PACG/PAC. In present study, the
association between ABCA1 and PACG has not been confirmed, thus, further
research is necessary to validate the role of ABCA
Moreover, seeing that shallow ACD and short AL have been reported to be strong risk factors for PACG[34-36], the associations between these eleven SNP genotypes and the ocular biometric parameters of AL and ACD were also evaluated in our study. We found that none of the target SNPs showed significant association with ocular biometric parameters of AL and ACD. Our result suggests these POAG related genes MYOC and ABCA1 do not have a role in the regulation of ocular biometric parameters of AL and ACD.
The limitation of the study is also obvious. The SNPs were chosen on the experiences of previous studies, which may not represent the gene completely in our cohort. Therefore, further study utilizing the tagger program based on our cohort should be done in the future.
In conclusion, our study investigated the association of two POAG related genes MYOC and ABCA1 with PACG as well as ocular biometric parameters of AL and ACD in a northern Chinese cohort. Our result suggests these POAG related genes MYOC and ABCA1 do not play a part in the pathogenesis of PACG as well as the regulation of ocular biometric parameters of AL and ACD. Additional studies are necessary to confirm this conclusion.
ACKNOWLEDGEMENTS
The authors thank all the patients and participants.
Foundations: Supported by the National Natural Science Foundation of China (No.81460093); the Ningxia Nature Science Funding from the Department of Science and Technology of Ningxia Hui Autonomous Region (No.NZ16194).
Conflicts of Interest: Wang SL, None; Piao SY, None; Xu MY, None; Zhang W, None; Ma JQ, None; Hao J, None; Chi H, None; Xue ZQ, None; Ha SP, None; Zhuang WJ, None.
REFERENCES