IF in JCR CiteScore
Rank About IJO Current
Issue Featured Articles Articles In Press Recent Accepted
 International Journal
of Ophthalmology
International Journal
of Ophthalmology
2017; 10(9): 1392-1395
・Clinical Research・
Optical coherence tomography angiography of optic
disc perfusion in non-arteritic anterior ischemic optic neuropathy
Jia-Wen Ling1,2, Xue Yin1,
Qian-Yi Lu1, Yi-Yi Chen1, Pei-Rong Lu1
1Department of Ophthalmology, the First
Affiliated Hospital of Soochow University, Suzhou 215006, Jiangsu Province,
China
2Department of Ophthalmology, the Third
People's Hospital of Zhangjiagang, Zhangjiagang 215600, Jiangsu Province, China
Correspondence to: Pei-Rong Lu.
Department of Ophthalmology, the First Affiliated Hospital of Soochow
University, 188 Shizi Street, Suzhou 215006, Jiangsu Province, China. lupeirong@suda.edu.cn
Received: 2017-02-10
Accepted: 2017-05-11
Abstract
AIM: To
compare the optic disc blood flow of non-arteritic ischemic optic neuropathy
(NAION) eyes with normal eyes.
METHODS: The
optic disc blood flow densities of diagnosed non-acute phase NAION eyes (21
eyes, 14 individuals) and normal eyes (19 eyes, 12 individuals) were detected via
Optovue optical coherence tomography angiography (OCTA). The optic disc blood
flow was measured via Image J software. Correlations between optic disc
perfusion and visual function variables were assessed by linear regression analysis.
RESULTS:
The average percentage of the optic disc non-perfusion areas in the non-acute
phase NAION patients (17.84%±6.18%) was increased, when compared to the normal
control eyes (8.61%±1.65%), and the difference was statistically significant (P<0.01).
Moreover, there was a proportional correlation between the visual field mean
defect (MD) and the optic disc non-perfusion area percentage, and the
relationship was statistically significant (t=3.65, P<0.01, R2=0.4118).
In addition, the critical correlation between the best corrected visual acuity
(BCVA) and the optic disc non-perfusion area percentage was statistically
significant (t=4.32, P<0.01, R2=0.4957).
CONCLUSION: The
optic disc non-perfusion area percentages detected via OCTA in NAION eyes
were significantly increased when compared with the normal eyes. Both the BCVA
and MD were correlated with the optic disc flow detected, revealing that OCTA
may be valuable in the diagnosis and estimation of NAION.
KEYWORDS: non-arteritic anterior ischemic optic
neuropathy; optical coherence tomography angiography; visual field; visual
acuity
Citation: Ling JW, Yin X, Lu QY, Chen YY, Lu PR. Optical coherence tomography
angiography of optic disc perfusion in non-arteritic anterior ischemic optic
neuropathy. Int J Ophthalmol 2017;10(9):
1402-1406
INTRODUCTION
Anterior ischemic optic neuropathy (AION) is the result of disease in
the small vessels supplying the anterior portion of the optic nerve[1-2]. AION can be divided into arteritic
ischemic optic neuropathy and non-arteritic ischemic optic neuropathy (NAION).
NAION makes up approximately 85% of all cases of AION, and is a common cause of
sudden vision loss due to optic nerve dysfunction in adults over 55 years of
age. Generally, it causes sudden, painless, unilateral vision loss, leading to
swelling of the optic nerve head[3]. To date,
there is no consistently effective treatment, either to improve vision in an
eye affected by NAION or to prevent visual loss from NAION in the fellow eye[1].
Optical coherence tomography (OCT) can measure optic disc oedema,
ganglion cell layer (GCL) thinning and retinal nerve fibre layer (RNFL) loss in
different NAION eye stages. The macula and GCL are thinner in NAION eyes, and
show stronger correlation with the visual field[4-7]. However, the specific correlation between the optic
disc blood flow perfusion and the visual function remains unknown. Although
optic disc perfusion changes can be observed in some NAION eyes via
fundus fluorescence angiography (FFA), its application value is limited because
it is invasive and the result is not digital. In recent years, a newly
developed optical coherence tomography angiography (OCTA) technology, which is
non-invasive, reproducible and sensitive, has demonstrated an ability to
quantify the disc blood flow both rapidly and accurately[8-9]. This has prompted us to examine the role of the optic
disc blood flow perfusion in the pathogenesis of NAION. In this study, we
retrospectively reviewed the clinical data of non-acute phase NAION patients,
focusing on the visual field and visual acuity, to explore the features of OCTA
and its correlation with visual function.
SUBJECTS AND METHODS
Participants Fourteen patients diagnosed with non-acute phase NAION in the Outpatient
Clinic of our hospital from May 2015 to November 2016 were included in this
research. The diagnostic criteria of NAION consisted of the following as
previous described[10-11]: 1)
a history of sudden visual loss and absence of other ocular and neurologic
diseases that might influence or explain the patient’s visual symptoms; 2)
optic disc-related visual field defects in the eye; 3) limited or diffuse
papillary oedema and constant linear peripheral haemorrhage; 4) a relative
afferent papillary defect (RAPD) (+) and/or aberrant visual evoked potential
(VEP); 5) ruled out other optic nerve diseases. All of the patients involved
underwent medical optometry, an intraocular pressure measurement, slit-lamp
microscopic and fundus examinations, fundus photography, and visual field and
VEP examinations. FFA was performed when a patient demonstrated a good general
physical condition. This research followed the tenets of the Declaration
of Helsinki (as revised in Brazil in 2013) and was approved by the First Affiliated
Hospital of Soochow University. Written consent was obtained from all of the
patients before participating in this study.
Standards of Inclusion and Exclusion The inclusion criteria were non-acute phase NAION patients, 18-80 years old,
with 3 or more months since the onset of disease. The exclusion criteria were
the following: 1) non-NAION or acute phase NAION patients; 2) non-acute phase
NAION patients with other eye diseases; 3) poor cooperation with fixation or
the OCTA examination; 4) abnormal morphological optic discs leading to
inaccurate OCTA data; 5) a refractive error greater than 5.0 diopters (D) of
spherical equivalent or 3.0 D of astigmatism. The control group consisted of
healthy individuals without systemic or eye diseases, with normal optic discs.
Observation Index The best corrected visual acuity (BCVA) was tested at each visit using
the standard Snellen decimal-acuity chart. The visual fields were tested using
Octopus 101 perimeter (Haag-Streit, Koeuiz, Switzerland) and the visual field
mean defect (MD) was obtained.
OCTA was performed using the RTVue XR Avanti with Angio Vue (Optovue,
Fremont, California, USA). The optic disc flow index was set as the optic disc
non-perfusion area percentage detected via OCTA. Retinal scanning using
a wide-field en-face swept-source OCTA contributed to the optic disc-centred
graphical reports (4.50×4.50 mm2). The graphs were analysed using
Image J software. We defined the optic disc areas as A (except any major branch
retinal blood vessels), and the optic disc non-perfusion areas as B by setting
different threshold values. Subsequently, we defined the optic disc
non-perfusion area percentages as C, and calculated C using the following
formula: C=B/A×100%. We adopted the same threshold value, and scoped the optic
disc margin according to the fundus photograph and previous reports
(termination of the retinal pigment epithelium/Bruch’s membrane complex)[12-14], as far as possible, to reduce
human error.
Statistical Analysis The results were expressed as the mean±standard deviation (SD) using
SPSS 22.0 software (SPSS, Los Angeles, CA, USA). A linear regression analysis
was performed between the optic disc non-perfusion area percentages and MD, as
well as the BCVA. One-way ANOVA was used to compare the measurements between
the eyes with NAION and the normal controls. A value of P<0.05 was
considered to be statistically significant.
RESULTS
Participant Characteristics For this study, 14 patients (8 females, 6 males) with non-acute phase
NAION were included. The analysis showed that the age of the subjects varied
between 38 and 76 years old, with an average age of 59.76±8.77 years old. The
onset time varied from 3 to 120mo, with an average time of 12.90±24.97mo. The
BCVA varied from 0.04 to 1.2, with an average acuity of 0.66±0.33.
For the control group, we collected information on 19 normal eyes of 12
healthy participants without any eye nor systemic diseases (8 females, 4
males). The mean age of the control group was 31.58±10.66 years old, and none
of their BCVAs were lower than 1.0.
Optic Disc Blood Flow Index via Optical Coherence Tomography
Angiography The vascular scanning model of the Optovue OCTA revealed precise perfusion
in four disparate layers, including the nerve head layer, vitreous layer,
radial peripapillary capillaries and choroid. In this study, the optic nerve
head layer was chosen to detect the optic disc blood flow (Figure 1A, 1E and
1I).
First, we selected the optic disc margin threshold (Figure 1B, 1F and
1J), showing the optic disc non-perfusion areas (Figure 1C, 1G and 1K), and the
optic disc region, with the exception of the major branch retinal blood vessels
(Figure 1D, 1H and 1L). Figure 1 shows the top, middle and bottom panels as a
normal eye, NAION eye and contralateral NAION eye, respectively.
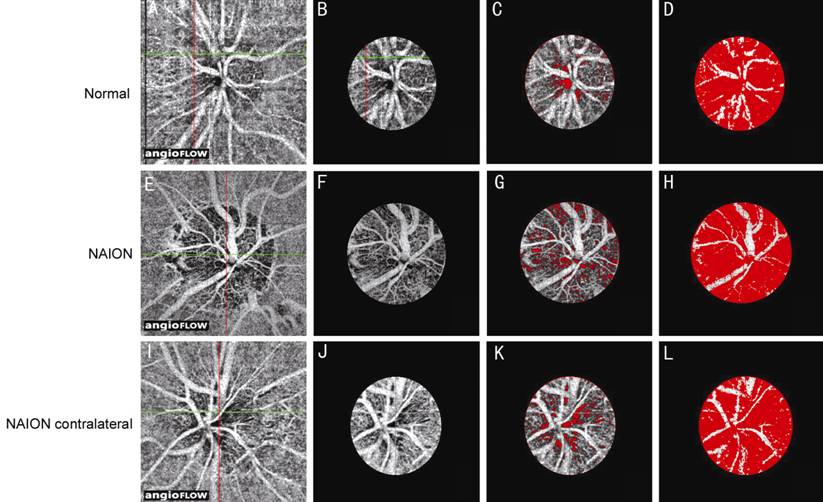
Figure 1 Optic disc blood flow index via
optical coherence tomography angiography
A, E, I: Optic disc-centred 4.50×4.50 mm2 OCT angiograms;
B, F, J: Selected optic disc OCT angiograms; C, G, K: Optic disc non-perfusion
areas; D, H, L: Optic disc areas (except major branch retinal blood vessels).
A-D: In the eyes of a normal subject; E-H: NAION eye; I-L: Contralateral eye of
a NAION patient. The non-perfusion areas are marked in red (C, D, G, H, K, L).
Regardless of bilaterality, whether or not the central vision was
normal, the average optic disc non-perfusion area percentage in the non-acute
phase NAION eyes (Figure 2) was 17.84%±6.18%. It was 8.61%±1.65% in the normal
eyes of the control group. The statistically significant difference between the
two groups (P<0.01) suggests an obvious increase in the optic disc
non-perfusion areas of the non-acute phase NAION eyes when compared to the
control group. Furthermore, to avoid type I error[15-16], ANOVA (randomly choose one eye in the 7 patients with
bilateral NAION and 7 health control data with bilateral eyes) was conducted,
which further confirmed the difference.
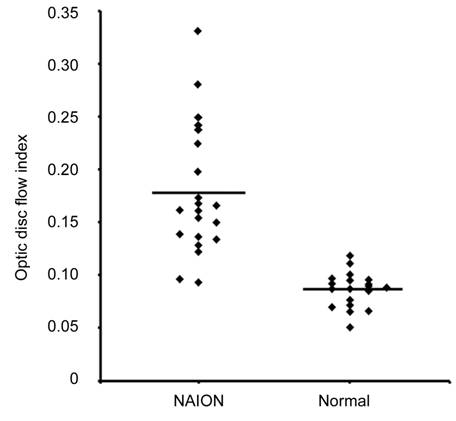
Figure 2 Optic disc non-perfusion
measurements The optic disc
non-perfusion area percentage was significantly higher in the NAION eyes than
in the normal eyes (P<0.01).
Visual Field Alterations and Optic Disc Non-perfusion Area Percentages
in Non-acute Phase Eyes Following the above observation, we sought to explore the relationship
between the blood flow in the optic disc and the visual damage. We found that
the larger the optic disc non-perfusion area percentage, the greater the visual
field MD of the NAION eye. A further correlation analysis revealed a proportional
relationship (t=3.65, P<0.01, R2=0.4118) between
these two factors (Figure 3).
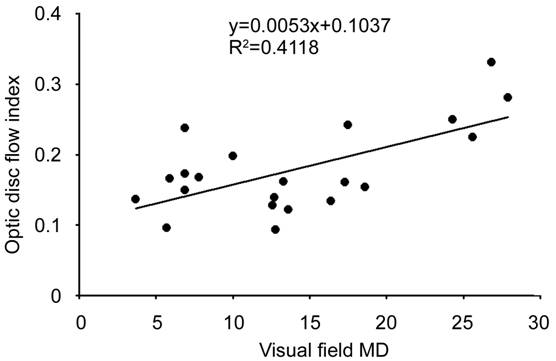
Figure 3 Correlation between the optic disc
non-perfusion area and the visual field in the NAION eyes The visual field MD and optic disc
non-perfusion area percentages in the NAION eyes are shown.
Visual Acuity and Optic Disc Non-perfusion Area Percentages in Non-acute
Phase Eyes Having shown the critical role of the optic disc blood flow perfusion in
visual field alterations, we suspected that the optic disc blood flow perfusion
may be also be involved in the visual acuity. Therefore, we analysed the
relationship between the optic disc non-perfusion area percentages and the
BCVAs of our non-acute phase NAION eyes. As expected, the results indicated an
obvious significant correlation (t=4.32, P<0.01, R2=0.4957)
between these two factors (Figure 4).
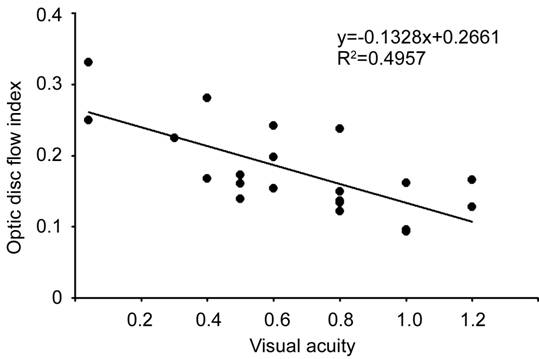
Figure 4 Correlation between the optic disc
non-perfusion area and visual acuity in the NAION eyes The BCVAs and optic disc non-perfusion
area percentages in the NAION eyes are shown.
DISCUSSION
We have shown OCTA can non-invasively detect and estimate the optic disc
blood flow of non-acute phase NAION eyes. We revealed that both the visual
acuity and visual field are correlated with the optic disc blood flow
perfusion, as detected via OCTA. Since the visual field is
representative of peripheral vision acuity, these two critical relationships
suggest that the vision function of non-acute phase NAION hinges on, at least
partly, the degree of optic disc blood flow perfusion. Therefore, more
attention should be focused on the role of optic disc perfusion alterations in
the pathogenesis of non-acute phase NAION, while considering that NAION can
cause irreversible visual damage.
Clinically, NAION is diagnosed by examining the fundus, visual field,
FFA and VEP; however, the disadvantages of these methods in monitoring the
progression and estimating the prognosis of NAION remain. Previous reports have
indicated that the OCT can measure optic disc oedema, GCL thinning and RNFL
loss. The RNFL and GCL thickness show stronger correlations with the visual
field in NAION eyes[4-7]. Using
scanning laser polarimetry, a few authors have reported that in acute phase
NAION eyes with optic disc swelling, scanning laser polarimetry may be better
than OCT for predicting the visual field loss[17-18]. OCTA is a novel technology developed to scan blood
vessels, and it has been applied to determine choroidal neovascularization in
patients with age-related macular degeneration[19-20]. It is widely acknowledged that the advantages of
OCTA consist of its non-invasiveness, datamation and repeatability. Moreover,
with its tracking technology to overcome eye movement, OCTA can offer high
resolution retinal and choroidal graphs[9].
Accumulating evidence suggests that the optic disc perfusion detected via
OCTA can be correlated to the GCL and RNFL thickness and visual field loss in
glaucoma patients[21-22].
Essentially, the main vascular pathology of NAION is focused on ischemia of the
anterior lamina cribrosa around the optic disc and metarterioles of the
posterior ciliary vessels, leading to a local infarct of the optic disc,
favouring the progression of optic dysneuria. Including these vessels makes
OCTA ideal for predicting the optic disc blood flow and supply in NAION eyes.
This research has provided evidence that the optic disc blood flow of
non-acute phase NAION was significantly decreased, when compared to a normal
control group, which suggests the poor blood flow recovery of the optic disc,
coinciding with the poor visual function prognosis of NAION. In addition, OCTA
revealed a dramatic decline in the optic disc blood flow in a portion of NAION
eyes that did not show any alterations in the visual acuity or VEP. Considering
that the subjectivity of a visual field examination is inevitably inferior to
the objectivity of OCTA, we suggest that OCTA could be utilized as a potential
diagnosis method for NAION.
The main limitation of this research was that it was a single-centre,
small-sample size, retrospective study; these results should be confirmed by
multi-centre, large-sample, prospective studies. In addition, the potential
involvement of age in the optic disc blood flow requires further exploration.
There have been conflicting reports of the effects of age on the optic nerve
head blood flow, possibly due to the different number of subjects and detection
techniques used in those studies[23-24].
Although the age range of our research subjects varied widely, we acquired a
preliminary understanding of the scope of normal optic disc non-perfusion area
percentages. Moreover, in view of the fact that the optic discs of patients
with acute phase NAION exhibit constant oedema, we excluded these subjects to
maintain the accuracy of our detection. In addition, abnormal morphologies of
the optic disc were excluded accordingly, due to their influence on OCTA.
In conclusion, here we have shown that both the visual acuity and visual
field are significantly correlated with the optic disc non-perfusion area
percentages of non-acute phase NAION eyes. This indicates, at least in part,
the prominent role of OCTA in estimating the progression of NAION. In addition,
our results suggest the possibility of future use of OCTA alone, or in
combination with automated perimetry, for the early diagnosis of NAION.
ACKNOWLEDGEMENTS
Foundations: Supported in part by
Jiangsu Province’s Outstanding Medical Academic Leader Program
(No.CXTDA2017039); the Soochow Scholar Project of Soochow University.
Conflicts of Interest: Ling JW, None; Yin X, None; Lu QY, None; Chen YY, None; Lu
PR, None.
REFERENCES
1
Bernstein SL, Johnson MA, Miller NR. Nonarteritic anterior ischemic optic
neuropathy (NAION) and its experimental models. <ii>Prog Retin Eye
Res</ii> 2011;30(3):167-187. [CrossRef]
[PMC free article] [PubMed]
2
Biousse V, Newman NJ. Ischemic optic neuropathies. <ii>N Engl J
Med</ii> 2015;372(25):2428-2436. [CrossRef]
[PubMed]
3
Mathews MK, Guo Y, Langenberg P, Bernstein SL. Ciliary neurotrophic factor (CNTF)-mediated
ganglion cell survival in a rodent model of non-arteritic anterior ischaemic
optic neuropathy (NAION). <ii>Br J Ophthalmol </ii>
2015;99(1):133-137. [CrossRef]
[PMC free article] [PubMed]
4
Rebolleda G, de Dompablo E, Muñoz-Negrete FJ. Ganglion cell layer analysis
unmasks axonal loss in anterior optic neuritis. <ii>J Neuroophthalmol
</ii> 2015;35(2):165-167. [PubMed]
5
Kernstock C, Beisse F, Wiethoff S, Mast A, Krapp E, Grund R, Dietzsch J,
Lagrèze W, Fischer D, Schiefer U. Assessment of functional and morphometric
endpoints in patients with non-arteritic anterior ischemic optic neuropathy
(NAION). <ii>Graefes Arch Clin Exp Ophthalmol
</ii>2014;252(3):515-521. [CrossRef]
[PubMed]
6
Gonul S, Koktekir BE, Bakbak B, Gedik S. Comparison of the ganglion cell
complex and retinal nerve fibre layer measurements using Fourier domain optical
coherence tomography to detect ganglion cell loss in non-arteritic anterior
ischaemic optic neuropathy. <ii>Br J Ophthalmol
</ii>2013;97(8):1045-1050. [CrossRef]
[PubMed]
7
Papchenko T, Grainger BT, Savino PJ, Gamble GD, Danesh-Meyer HV. Macular
thickness predictive of visual field sensitivity in ischemic optic neuropathy.
<ii>Acta Ophthalmol</ii> 2012;90(6):e463-469. [CrossRef]
[PubMed]
8
Jia Y, Morrison JC, Tokayer J, Tan Q, Lombardi L, Baumann B, Lu CD, Choi W,
Fujimoto JG, Huang D. Quantitative OCT angiography of optic nerve head blood
flow. <ii>Biomed Opt Express</ii> 2012;3(12):3127-3137. [CrossRef]
[PMC free article] [PubMed]
9
Jia Y, Wei E, Wang X, Zhang X, Morrison JC, Parikh M, Lombardi LH, Gattey DM,
Armour RL, Edmunds B, Kraus MF, Fujimoto JG, Huang D. Optical coherence
tomography angiography of optic disc perfusion in glaucoma.<ii>
Ophthalmology</ii> 2014;121(7):1322-1332. [CrossRef]
[PMC free article] [PubMed]
10
Hayreh SS, Zimmerman B. Visual field abnormalities in nonarteritic anterior
ischemic optic neuropathy: their pattern and prevalence at initial examination.
<ii>Arch Ophthalmol </ii> 2005;123(11):1554-1562. [CrossRef]
[PubMed]
<no>11
Neuro-ophthalmology Group, Ophthalmology Branch of Chinese Medical Association.
Expert consensus for the diagnosis and management of non-arteritic ischemic optic
neuropathy. <ii>Chin J Ophthalmol </ii> 2015; 51(5):323-326.
12
Strouthidis NG, Yang H, Reynaud JF, Grimm JL, Gardiner SK, Fortune B, Burgoyne
CF. Comparison of clinical and spectral domain optical coherence tomography
optic disc margin anatomy. <ii>Invest Ophthalmol Vis Sci</ii>
2009;50(10):4709-4718. [CrossRef]
[PMC free article] [PubMed]
13
Strouthidis NG, Yang H, Fortune B, Downs JC, Burgoyne CF. Detection of optic
nerve head neural canal opening within histomorphometric and spectral domain
optical coherence tomography data sets. <ii>Invest Ophthalmol Vis
Sci</ii> 2009;50(1):214-223. [CrossRef]
[PMC free article] [PubMed]
14
Hu Z, Abràmoff MD, Kwon YH, Lee K, Garvin MK. Automated segmentation of neural
canal opening and optic cup in 3D spectral optical coherence tomography volumes
of the optic nerve head. <ii>Invest Ophthalmol Vis Sci
</ii>2010;51(11):5708-5717. [CrossRef]
[PMC free article] [PubMed]
15
Armstrong RA. Statistical guidelines for the analysis of data obtained from one
or both eyes. <ii>Ophthalmic Physiol Opt </ii> 2013;33(1):7-14. [CrossRef]
[PubMed]
16
Murdoch IE, Morris SS, Cousens SN. People and eyes: statistical approaches in
ophthalmology. <ii>Br J Ophthalmol </ii>1998;82(8):971-973. [CrossRef]
17
Kupersmith MJ, Anderson S, Durbin M, Kardon R. Scanning laser polarimetry, but
not optical coherence tomography predicts permanent visual field loss in acute
nonarteritic anterior ischemic optic neuropathy.<ii> Invest Ophthalmol
Vis Sci </ii>2013;54(8):5514-5519. [CrossRef]
[PMC free article] [PubMed]
18
Hata M, Miyamoto K, Oishi A, Kimura Y, Nakagawa S, Horii T, Yoshimura N. Measurement
of retinal nerve fiber layer thickness in eyes with optic disc swelling by
using scanning laser polarimetry and optical coherence tomography.
<ii>Clin Ophthalmol </ii>2014;8:105-111. [PubMed]
19
Yeung L, Lima VC, Garcia P, Landa G, Rosen RB. Correlation between spectral
domain optical coherence tomography findings and fluorescein angiography
patterns in diabetic macular edema. <ii>Ophthalmology</ii>
2009;116(6):1158-1167. [CrossRef]
[PubMed]
20
Jia Y, Bailey ST, Wilson DJ, Tan O, Klein ML, Flaxel CJ, Potsaid B, Liu JJ, Lu
CD, Kraus MF, Fujimoto JG, Huang D. Quantitative optical coherence tomography
angiography of choroidal neovascularization in age-related macular
degeneration. <ii>Ophthalmology </ii> 2014;121(7): 1435-1444. [CrossRef]
[PMC free article] [PubMed]
21
Wang X, Jiang C, Ko T, Kong X, Yu X, Min W, Shi G, Sun X. Correlation between optic
disc perfusion and glaucomatous severity in patients with open-angle glaucoma:
an optical coherence tomography angiography study. <ii>Graefes Arch Clin
Exp Ophthalmol </ii>2015;253(9):1557-1564. [CrossRef]
[PubMed]
22
Liu L, Jia Y, Takusagawa HL, Pechauer AD, Edmunds B, Lombardi L, Davis E,
Morrison JC, Huang D. Optical coherence tomography angiography of the
peripapillary retina in glaucoma. <ii>JAMA Ophthalmol</ii>
2015;133(9):1045-1052. [CrossRef]
[PMC free article] [PubMed]
23
Groh MJ, Michelson G, Langhans MJ, Harazny J. Influence of age on retinal and
optic nerve head blood circulation. <ii>Ophthalmology
</ii>1996;103(3):529-534. [CrossRef]
24
Boehm AG, Koeller AU, Pillunat LE. The effect of age on optic nerve head blood
flow. <ii>Invest Ophthalmol Vis Sci</ii> 2005;46(4):1291-1295. [CrossRef]
[PubMed]
--------------------------------------------------------------------------------------------------------------------------------
All rights reserved by Press of International Journal of Ophthalmology (IJO
PRESS)